Gold/EUR Forecast — 6 January 2025
Time Zone: GMT +2
Time Frame: 4 Hours (H4)
Fundamental Analysis
The GOLDEUR pair, which reflects the price of gold in euros, is influenced by broader macroeconomic developments, such as inflation expectations and central bank policies. Today’s trading is expected to see lower liquidity due to the Italian banks being closed in observance of Epiphany Day, which could result in irregular volatility for the Euro. Meanwhile, the Eurozone CPI release will be critical for gauging inflation trends, with a higher-than-expected reading likely to strengthen the Euro by raising the probability of further European Central Bank tightening. Gold, however, may act as a safe haven, particularly if upcoming Eurozone economic data highlights uncertainties or weaknesses.
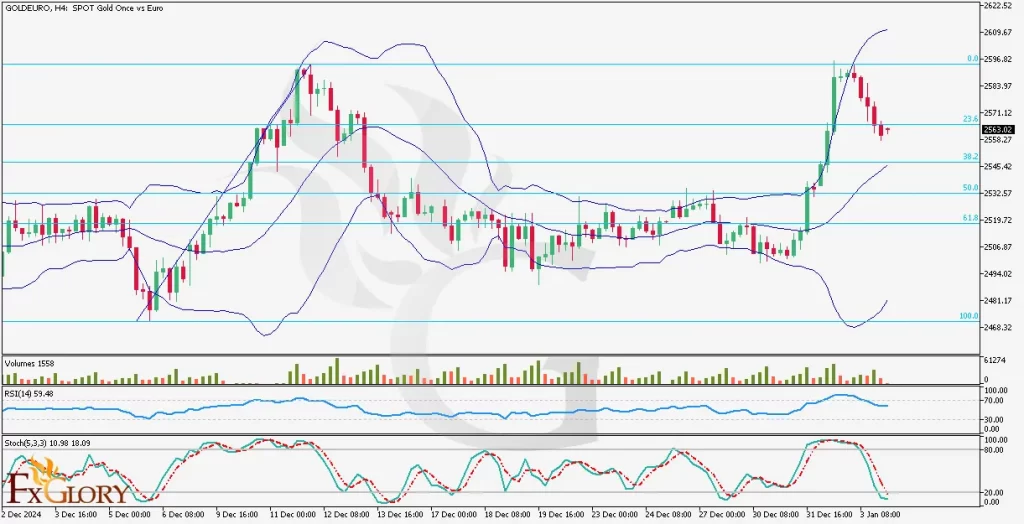
Price Action
In the H4 timeframe, GOLD/EUR exhibits a corrective pullback after a strong bullish surge. The GOLD EUR pair has recently touched the upper Bollinger Band and is now retracing towards the 23.6% Fibonacci level. Several bearish candles have formed, signaling the potential for further downside correction. If the price sustains below the 23.6% Fib level, it could continue its decline towards the 38.2% and 50.0% Fibonacci retracement levels, aligning with critical support zones. However, should the price regain upward momentum, a re-test of the recent highs near the upper Bollinger Band is possible.
Key Technical Indicators
Bollinger Bands: The bands have widened significantly, indicating recent high volatility. The price has retreated from the upper band and is approaching the middle band, which acts as a dynamic support level. A break below this level could signal further bearish momentum.
Volume: Volume has decreased slightly during the correction phase, indicating weaker bullish conviction and the possibility of continued downward movement.
RSI (Relative Strength Index): The RSI is currently at 59.48, reflecting moderate bullish momentum. However, it is moving away from the overbought zone, suggesting potential room for further correction.
Stochastic Oscillator: The Stochastic Oscillator is in the oversold region (10.98), hinting at possible bearish exhaustion. This could indicate an imminent reversal or consolidation before further price action develops.
Support and Resistance Levels
Support: Immediate support is located at 2,571, which aligns with the 23.6% Fibonacci level and recent price retracement.
Resistance: The nearest resistance level is at 2,583, coinciding with the recent high and the upper Bollinger Band.
Conclusion and Consideration
GOLD-EUR currently shows signs of a technical correction within its broader bullish trend. While the RSI and Stochastic Oscillator suggest that the correction could soon exhaust, traders should monitor the key Fibonacci levels and Bollinger Band dynamics for clearer signals. The 23.6% Fibonacci level will serve as a critical pivot; a sustained break below it could open the path to deeper retracement levels. Conversely, a rebound could re-establish bullish momentum. The upcoming Eurozone CPI data will likely have a significant impact on GOLD EUR volatility, and lower liquidity due to the Italian holiday might exacerbate price swings.
Disclaimer: The analysis provided for GOLD/EUR is for informational purposes only and does not constitute investment advice. Traders are encouraged to perform their own analysis and research before making any trading decisions on GOLDEUR. Market conditions can change quickly, so staying informed with the latest data is essential.