
The daily chart keeps price above its key averages and the trend intact, while softer momentum, a neutral H4 picture and US inflation and producer price releases keep the weekly setup conditional.
Daily check — 11 November 2026: The latest completed D1 close was 6.69209 on 10 November 2026. It remains above the lower formal invalidation level 6.65030; the upper calibrated boundary 6.74947 is an extension/confirmation boundary. The authored weekly thesis remains valid.
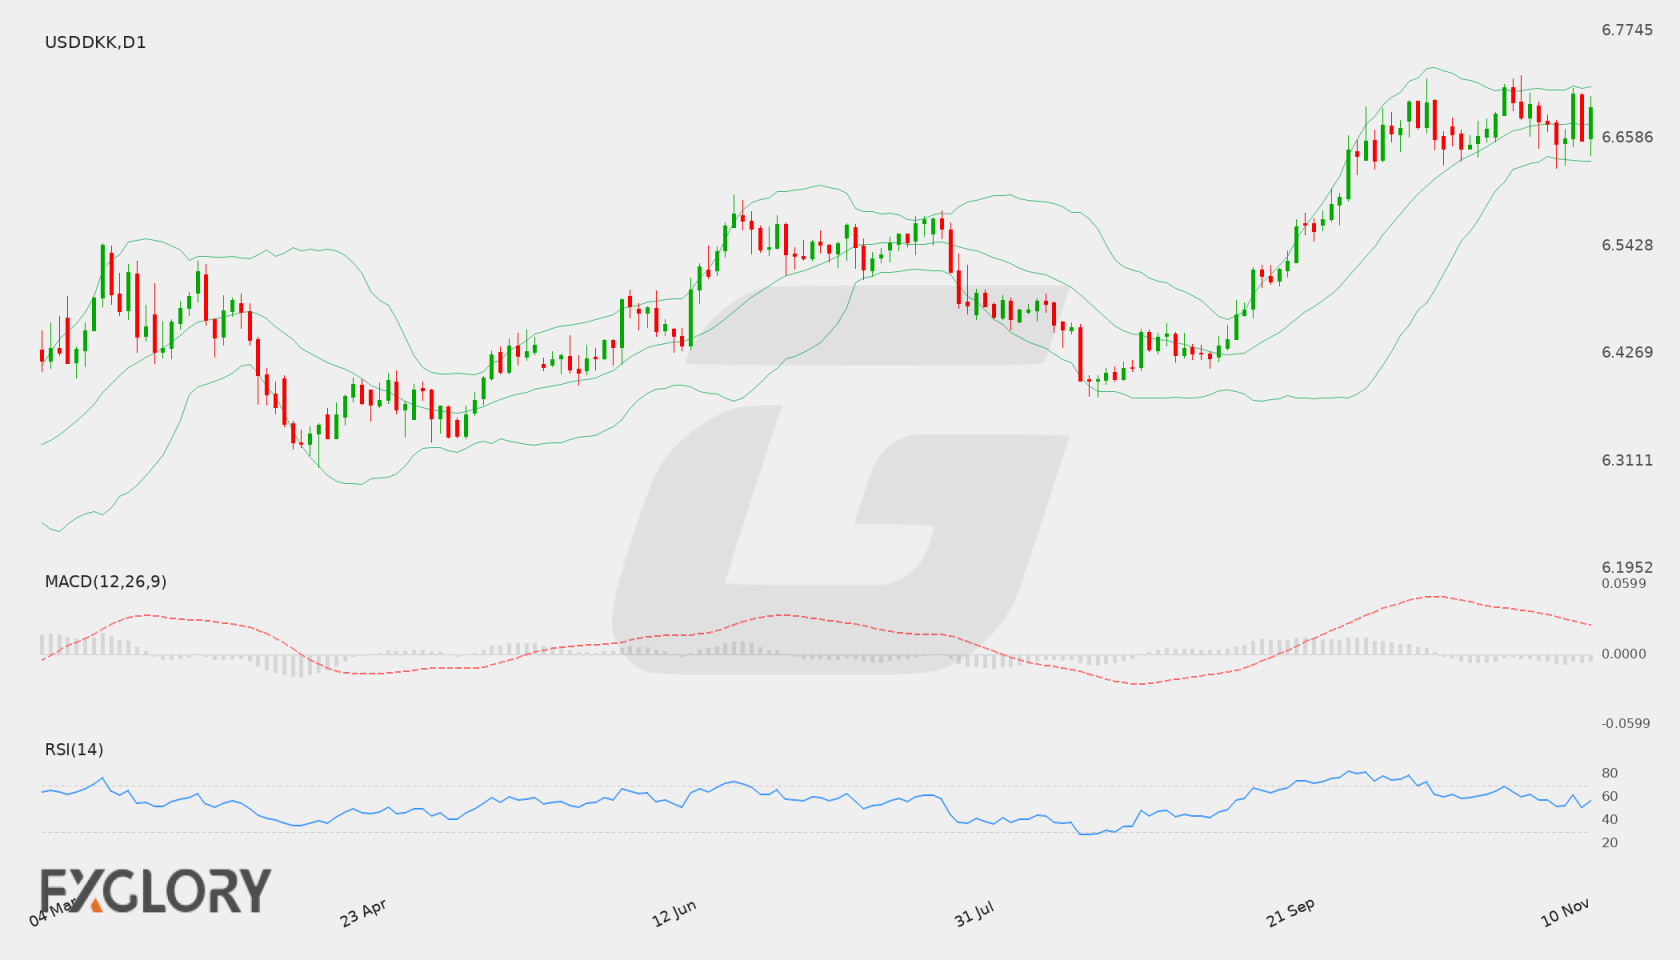
USD/DKK Weekly Forecast at a Glance
In brief
USDDKK carries a bullish weekly bias because D1 structure remains above its moving averages, though mixed closes, softer MACD momentum and US inflation and PPI releases keep the setup conditional.
On the daily chart, USDDKK closed at 6.70638, above EMA20 at 6.66516, EMA50 at 6.61116, SMA200 at 6.47392 and the Bollinger middle band. Both EMA50 and SMA200 are rising, which keeps the controlling timeframe in an uptrend. The close sequence is mixed rather than a steady run of higher closes, and price remains below primary resistance at 6.72656, so the bullish structure has not yet pushed through the nearest overhead level.
Momentum only partly corroborates the trend. D1 RSI at 61.95 supports the bullish stance, but D1 MACD remains positive while sitting below its signal line with a negative histogram, which points to momentum softening relative to the trend. H4 is neutral: MACD is above its signal, yet RSI is below 50 and the close is beneath H4 EMA20 while above EMA50, so tactical timing is not yet clean. Scheduled US CPI and PPI releases add catalyst risk that could test the 6.6752 to 6.72656 range.
- Bullish targets
-
- T16.76573 (projected)
- T26.80491 (projected)
- Bearish targets
-
- T16.65422
- T26.63418
- Invalidation
- One completed D1 close below 6.65030.
Selected key events
- Core CPI y/y10 Nov 2026 16:30 GMT+3High
- CPI y/y10 Nov 2026 16:30 GMT+3High
- Core CPI m/m10 Nov 2026 16:30 GMT+3High
| Price at last update | 6.69181 as of 11 Nov 2026 06:05 GMT+3 |
|---|---|
| Completed D1 reference close | 6.70638 as of 6 November 2026 |
| Primary support | 6.67520 |
| Secondary support | 6.65422 |
| Primary resistance | 6.72656 |
| Bullish targets | 6.76573 (projected), 6.80491 (projected) |
| Bearish targets | 6.65422, 6.63418 |
| Formal weekly thesis invalidation | Lower 6.65030 — One completed D1 close below 6.65030 formally invalidates the bullish weekly thesis. |
Live USD/DKK Tools
A forecast is a snapshot. These pages keep moving with the market.
- Live
Live chart & price
Watch USD/DKK move tick by tick. Flip from the 1-minute chart to the monthly, with trading conditions right alongside.
- Live
Technical signals
Buy, sell or sit it out? Oscillators, moving averages and pivot points boiled down to one clear reading, updated live.
Economic calendar
Know what's coming before it hits the price: every scheduled release with impact, forecast and actual.
Historical data
Open, high, low and close on any timeframe from 1 minute to monthly. Test your idea, then download the data.
All USD/DKK forecasts
Every weekly outlook in one place. Scroll back to see how earlier calls played out against the chart.
USD/DKK Fundamental Drivers This Week
Scheduled economic events relevant to USD/DKK during 9–14 November 2026 include FOMC Member Waller Speaks, Core CPI y/y, CPI y/y. Directional impact depends on the released data relative to supplied expectations.
Scroll table sideways for more columns →
| Event | Scheduled | Importance | Consensus | Previous |
|---|---|---|---|---|
| FOMC Member Waller Speaks | 10 Nov 2026 12:00 GMT+3 | Medium | — | — |
| Core CPI y/y | 10 Nov 2026 16:30 GMT+3 | High | — | 2.6% |
| CPI y/y | 10 Nov 2026 16:30 GMT+3 | High | — | 3.7% |
| Core CPI m/m | 10 Nov 2026 16:30 GMT+3 | High | 0.2% | 0.3% |
| CPI m/m | 10 Nov 2026 16:30 GMT+3 | High | 0.3% | 0.6% |
Current USD/DKK Price and Weekly Market Context
D1 is the controlling frame and remains bullish: price sits above its EMA20, EMA50, SMA200 and Bollinger middle, with the two long-term averages rising. Momentum is the main reservation, since D1 RSI supports the trend while MACD sits below its signal with a negative histogram and closes are mixed. H4 is neutral and adds tactical hesitation rather than an opposing weekly view, so the picture is a bullish structure awaiting cleaner follow-through and stable volatility.
- D1 trendbullishClose vs 50 EMA and 200 SMA
- H4 tacticalneutralH4 close vs 20 and 50 EMA
- MomentummixedRSI and MACD histogram
- VolatilitystableD1 ATR change
Is USD/DKK Bullish or Bearish This Week?
The bullish scenario is the primary case because the daily trend and moving-average structure favour upside development toward the ATR-based reference targets, but mixed closes and softer MACD momentum mean it requires confirmation. The base scenario describes consolidation between primary support and primary resistance, reflecting the mixed close sequence. The bearish scenario is the counter-case, requiring a completed D1 close below primary support to shift the structure.
Scenario 1 of 3Bullish continuation
- D1 confirmation
- A completed D1 close above primary resistance at 6.72656 would move price out of its current position below that level and into the upper range, supporting progression toward the bullish ATR-based reference targets.
- H4 tactical signal
- An H4 close above H4 resistance at 6.67617 would help H4 align with the D1 bullish bias, particularly if H4 momentum improves from its current below-50 RSI reading.
- Targets
- 6.76573 (projected), 6.80491 (projected)
- Scenario failure condition
- A completed D1 close back below primary support at 6.6752 would weaken the bullish setup and shift attention to secondary support at 6.65422.
Scenario 2 of 3Base / neutral
- D1 confirmation
- Completed D1 closes that remain between primary support at 6.6752 and primary resistance at 6.72656 would confirm consolidation inside the range rather than a directional break.
- H4 tactical signal
- H4 closes oscillating between H4 support at 6.66812 and H4 resistance at 6.67617 would reflect the tactical neutrality currently shown on H4.
- Targets
- A range between primary support at 6.6752 and primary resistance at 6.72656, with secondary support at 6.65422 as the next reference level beneath it.
- Scenario failure condition
- A completed D1 close above 6.72656 or below 6.6752 would take price out of the range and shift the emphasis to the corresponding directional scenario.
Scenario 3 of 3Bearish reversal
- D1 confirmation
- A completed D1 close below primary support at 6.6752 would indicate that the daily structure has lost its immediate support, opening the bearish target candidates at 6.65422 and 6.63418.
- H4 tactical signal
- An H4 close below H4 support at 6.66812 would add tactical pressure, particularly as the H4 close already sits beneath its EMA20.
- Targets
- 6.65422, 6.63418
- Scenario failure condition
- A completed D1 close back above primary support at 6.6752 would restore the bullish structure and reduce the bearish case to a pullback within the daily trend.
USD/DKK D1 Outlook and H4 Technical Triggers
The daily timeframe controls the weekly thesis. H4 evidence is used only for earlier confirmation, tactical warning and scenario-failure context. Complete live H4, H1 and intraday readings remain on the Technical page.
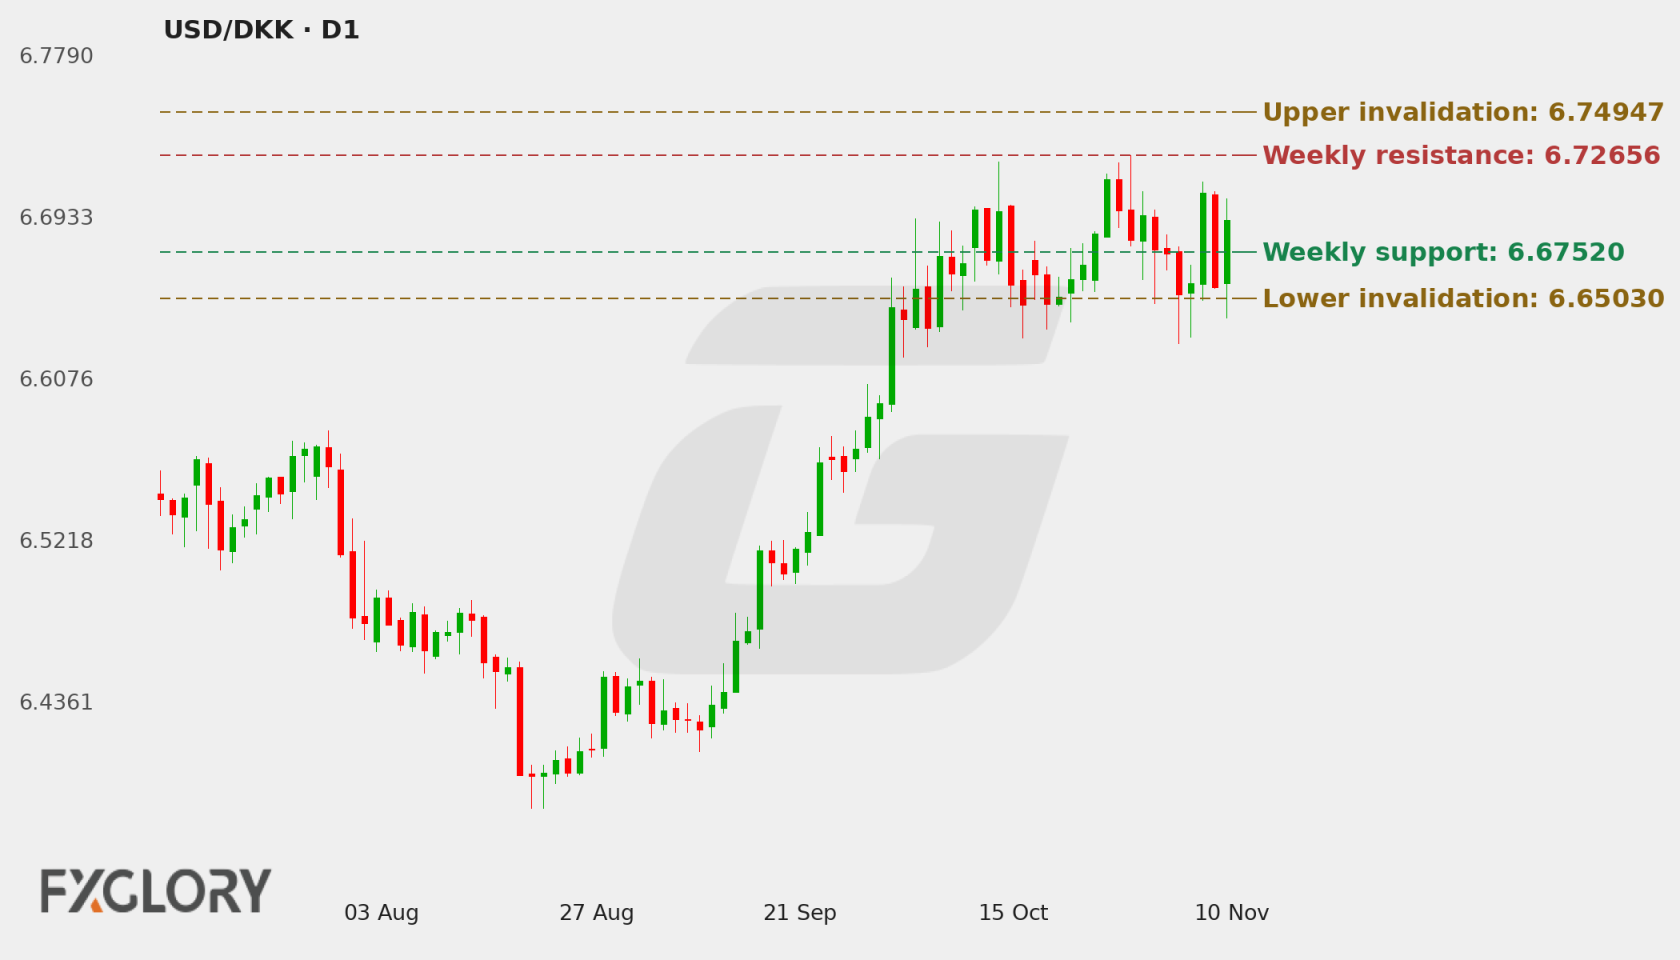
D1 Price Action and Market Structure
The D1 close at 6.70638 sits above primary support at 6.6752 and below primary resistance at 6.72656, and above the Bollinger middle while beneath the upper band at 6.71519. The close sequence is mixed rather than a steady run of higher closes, so the uptrend is intact without yet pressing decisively into resistance.
H4 Tactical Triggers
H4 is neutral and does not independently overturn the D1 thesis. H4 MACD is above its signal with a positive histogram, which is constructive, but H4 RSI is below 50 and the close is beneath EMA20 while above EMA50, so short-term momentum has not yet pressed higher. The H4 close sits between H4 support at 6.66812 and H4 resistance at 6.67617, so tactical confirmation is partial and works best as a timing filter.
Technical Indicators at a Glance
Automated technical summary
D1 is bullish with price above EMA20, EMA50, SMA200 and the Bollinger middle, and rising long-term averages. Momentum is mixed, with D1 RSI supportive but MACD below its signal. H4 is neutral, volatility is stable, and the weekly thesis remains bullish but conditional on follow-through above primary resistance.
Selected snapshot: D1 with H4 tactical context. Updated 11 November 2026.
- RSI61.95Neutral
- MACDBelow signalBearish
- Bollinger Bands89% of bandUpper half
- Moving averagesAbove bothBullish
- ATR391.7 pipsStable
RSI (14)
Neutral
H4 49.92
D1 RSI above 50 supports the bullish trend, while H4 RSI below 50 shows that short-term momentum is lagging. The higher timeframe is therefore more constructive than the lower one, which fits the neutral H4 state.
- D1 RSI
- 61.95
- H4 RSI
- 49.92
MACD (12, 26, 9)
Bearish momentum
D1 MACD is positive but sits below its signal line with a negative histogram, so momentum is softening relative to the trend. H4 MACD is above its signal with a positive histogram, a short-term recovery that partly offsets the daily softness without resolving the mixed D1 picture.
- MACD
- 0.022419
- Signal
- 0.02831
- Histogram
- -0.00589
Bollinger Bands (20, 2σ)
Upper half
Striped ends = price outside the bands.
The D1 close sits above the middle band and below the upper band, which places price in the upper half of its recent envelope without pressing the upper edge. The D1 middle band shares the 6.6752 figure with primary support, but the support designation rests on the level data rather than the band.
- Position in band
- 89%
- Band width
- 799.9 pips (1.20%)
Moving averages (D1)
Bullish structure
- 50 EMA rising6.61116Price is 952.2 pips above (+1.44%)
- 200 SMA rising6.47392Price is 2324.6 pips above (+3.59%)
On D1, price is above EMA20, EMA50 and SMA200, and both EMA50 and SMA200 are rising, so the moving-average structure supports the uptrend on the controlling timeframe. On H4, price is above EMA50 but below EMA20, a mixed tactical picture that matches the neutral H4 state.
- D1 close
- 6.70638
- 50 EMA
- 6.61116
- 200 SMA
- 6.47392
ATR (14)
Stable volatility
One ATR either side of the latest close. A measure of move size, not a price target.
Volatility is stable. The D1 ATR sets the scale for the projected ATR-based reference targets, while the H4 ATR frames shorter-term movement. Stable volatility points to orderly development rather than a volatility-driven directional signal.
- D1 ATR
- 0.03917 (0.58%)
- H4 ATR
- 0.01639 (0.24%)
Technical conclusion: The weekly thesis is Bullish, anchored on the D1 trend, with price above its key averages and both long-term averages rising. The strongest supporting evidence is the D1 moving-average structure and D1 RSI above 50. The main counterargument is momentum softening, with D1 MACD below its signal and mixed closes, while H4 remains neutral. The levels that matter next are primary resistance at 6.72656, which would need a completed D1 close above it to advance the bullish case, and primary support at 6.6752, which a completed D1 close below would weaken.
View all live USD/DKK oscillators, moving averages, pivot points and timeframe signals.
USD/DKK Weekly Support, Resistance and Invalidation
| Level | Role | Timeframe | Why it matters |
|---|---|---|---|
| 6.6752 | Primary support | D1 | A completed D1 close below this level would weaken the bullish setup and move attention to secondary support. |
| 6.65422 | Secondary support and bearish target candidate | D1 | This is the next structural reference beneath primary support and sits above the lower invalidation boundary of 6.6503. |
| 6.63418 | Lower support candidate and bearish target candidate | D1 | It marks the deepest supplied support candidate, below the lower boundary of 6.6503. |
| 6.72656 | Primary resistance | D1 | A completed D1 close above this level would move price into the upper range and support the bullish reference targets. |
| 6.66812 | H4 support | H4 | An H4 close below this level would add tactical pressure against the D1 bias without replacing the weekly thesis. |
| 6.67617 | H4 resistance | H4 | An H4 close above this level would help H4 align with the bullish D1 structure. |
These are forecast-specific market-structure levels. Formula-based Classic, Fibonacci and Camarilla pivots remain on the Technical page.
Economic News & Events to Watch for USD/DKK This Week
Selected events may increase USD/DKK volatility. Direction depends on the released value relative to consensus and previous results.
Scroll table sideways for more columns →
| Event | Date and time | Importance | Previous | Consensus |
|---|---|---|---|---|
| Core CPI y/y | 10 Nov 2026 16:30 GMT+3 | High | 2.6% | — |
| CPI y/y | 10 Nov 2026 16:30 GMT+3 | High | 3.7% | — |
| Core CPI m/m | 10 Nov 2026 16:30 GMT+3 | High | 0.3% | 0.2% |
| CPI m/m | 10 Nov 2026 16:30 GMT+3 | High | 0.6% | 0.3% |
| Core PPI m/m | 13 Nov 2026 16:30 GMT+3 | High | 0.7% | 0.3% |
Showing 5 of 8 scheduled events; high-importance events appear first.
Calendar source: FXGlory economic calendar. Retrieved 09 Nov 2026 15:28 GMT+3. View the complete USD/DKK economic calendar.
USD/DKK Outlook for 9–14 November 2026
The weekly thesis remains Bullish because the D1 trend leads: price sits above its EMA20, EMA50, SMA200 and Bollinger middle, and the two long-term averages are rising. Momentum and tactical signals keep this from being a clean conviction setup, since D1 MACD is below its signal, closes are mixed and H4 is neutral.
The decisive levels are primary resistance at 6.72656, where a completed D1 close above would support progression toward the bullish ATR-based reference targets, and primary support at 6.6752, where a completed D1 close below would weaken the setup. The US inflation and producer price releases are the main catalysts that could test these levels this week.
Weekly Forecast Risks and What Would Change the Outlook
- Timeframe disagreement: The neutral H4 state, with RSI below 50 and close beneath H4 EMA20, can delay tactical follow-through even while the D1 trend stays bullish.
- Momentum conflict: D1 MACD sits below its signal with a negative histogram despite RSI above 50, so the trend may be less supported by momentum than by moving averages alone.
- Event-driven volatility: The US inflation releases on 10 November and producer price releases on 13 November could produce sharp moves that test primary support and resistance before the structure resolves.
Formal weekly invalidation: The bullish weekly thesis is formally invalidated by one completed D1 close below 6.65030. One completed D1 close above 6.74947 confirms upper structural extension and continuation.
USD/DKK Weekly Forecast FAQs
Is USD/DKK bullish or bearish this week?
The bias is Bullish because the D1 trend is bullish, with price above EMA20, EMA50, SMA200 and the Bollinger middle, and both EMA50 and SMA200 rising. Mixed closes and softer MACD momentum prevent the bias from being treated as certain, and the neutral H4 state means tactical confirmation is still incomplete.
What scenario would strengthen for USD/DKK this week?
The primary case is continuation, in which D1 holds above primary support at 6.6752 and works toward primary resistance and the bullish ATR-based reference targets. A base case of consolidation between 6.6752 and 6.72656 remains a valid alternative given the mixed closes, while a bearish shift requires a completed D1 close below 6.6752.
What are the key USD/DKK support and resistance levels?
Primary support is 6.6752 and secondary support is 6.65422, with primary resistance at 6.72656. Bullish ATR-based reference targets are 6.76573 and 6.80491, and the bearish target candidates are 6.65422 and 6.63418.
What would invalidate this USD/DKK forecast?
The bullish weekly thesis is formally invalidated by one completed D1 close below 6.65030.
Methodology, Data and Sources
- Price-data source: FXGlory price feed (USDDKK)
- Live quote timestamp: 11 Nov 2026 06:05 GMT+3
- Weekly analysis timestamp: 9 November 2026
- Chart timestamp: 11 November 2026 (redrawn daily)
- Daily check: Every day at 04:00 GMT+3: the latest completed D1 close is checked against the invalidation levels and the chart is redrawn.
- Technical snapshot timestamp: 9 November 2026
- Calendar-data source: FXGlory economic calendar
- Calendar retrieval timestamp: 09 Nov 2026 15:28 GMT+3
- Candle convention: FXGlory D1 and H4 candles; D1 candle dates are evaluated in UTC and invalidation uses completed D1 closes only.
- Indicator settings: D1 RSI(14), MACD(12,26,9), Bollinger Bands(20,2), EMA(50), SMA(200), ATR(14); H4 RSI/MACD/Bollinger/EMA/ATR.
- Level-selection method: Weekly D1 support/resistance levels are structural market levels. Formal invalidation uses a hard 1.00× D1 ATR(14) minimum anchor distance plus a 0.10× D1 ATR(14) outward buffer; H4 levels are tactical only.
- Weekly forecast method: D1 controls the weekly thesis; H4 supplies tactical confirmation/warning only.