Current weekly forecast: This outlook covers 11–17 October 2026 and remains valid until 17 October 2026, unless its stated invalidation condition is triggered earlier.
In brief
The weekly bias is bearish, although bullish H4 momentum and mixed D1 evidence leave scope for a conditional recovery toward resistance before the broader structure is reassessed.
NZD/JPY closed at 88.511, below the D1 EMA20 at 89.40907, EMA50 at 90.87434 and SMA200 at 92.5904. The bearish D1 trend and falling EMA50 and SMA200 slopes provide the primary weekly framework, while the mixed close sequence prevents the structure from being treated as one-directional.
The H4 picture is more constructive: its bullish tactical state is supported by RSI at 54.63, a positive MACD histogram of 0.033573 and an H4 close of 88.762 above the H4 middle Bollinger level at 88.63645. That countertrend strength can delay bearish follow-through, but it remains tactical while the D1 trend controls the weekly assessment.
NZD/JPY D1 technical-analysis context for the weekly forecast. Chart data captured 11 October 2026.
NZD/JPY has been under sustained downward pressure as market participants weigh shifts in broader risk sentiment against monetary policy expectations between New Zealand and Japan. As a classic risk-sensitive cross, NZDJPY often responds to changes in global risk appetite, commodity demand, and yield differentials. With safe-haven appeal and changing carry-trade dynamics influencing the Japanese Yen, the currency pair continues to exhibit sensitivity to macroeconomic sentiment.
Price Action:
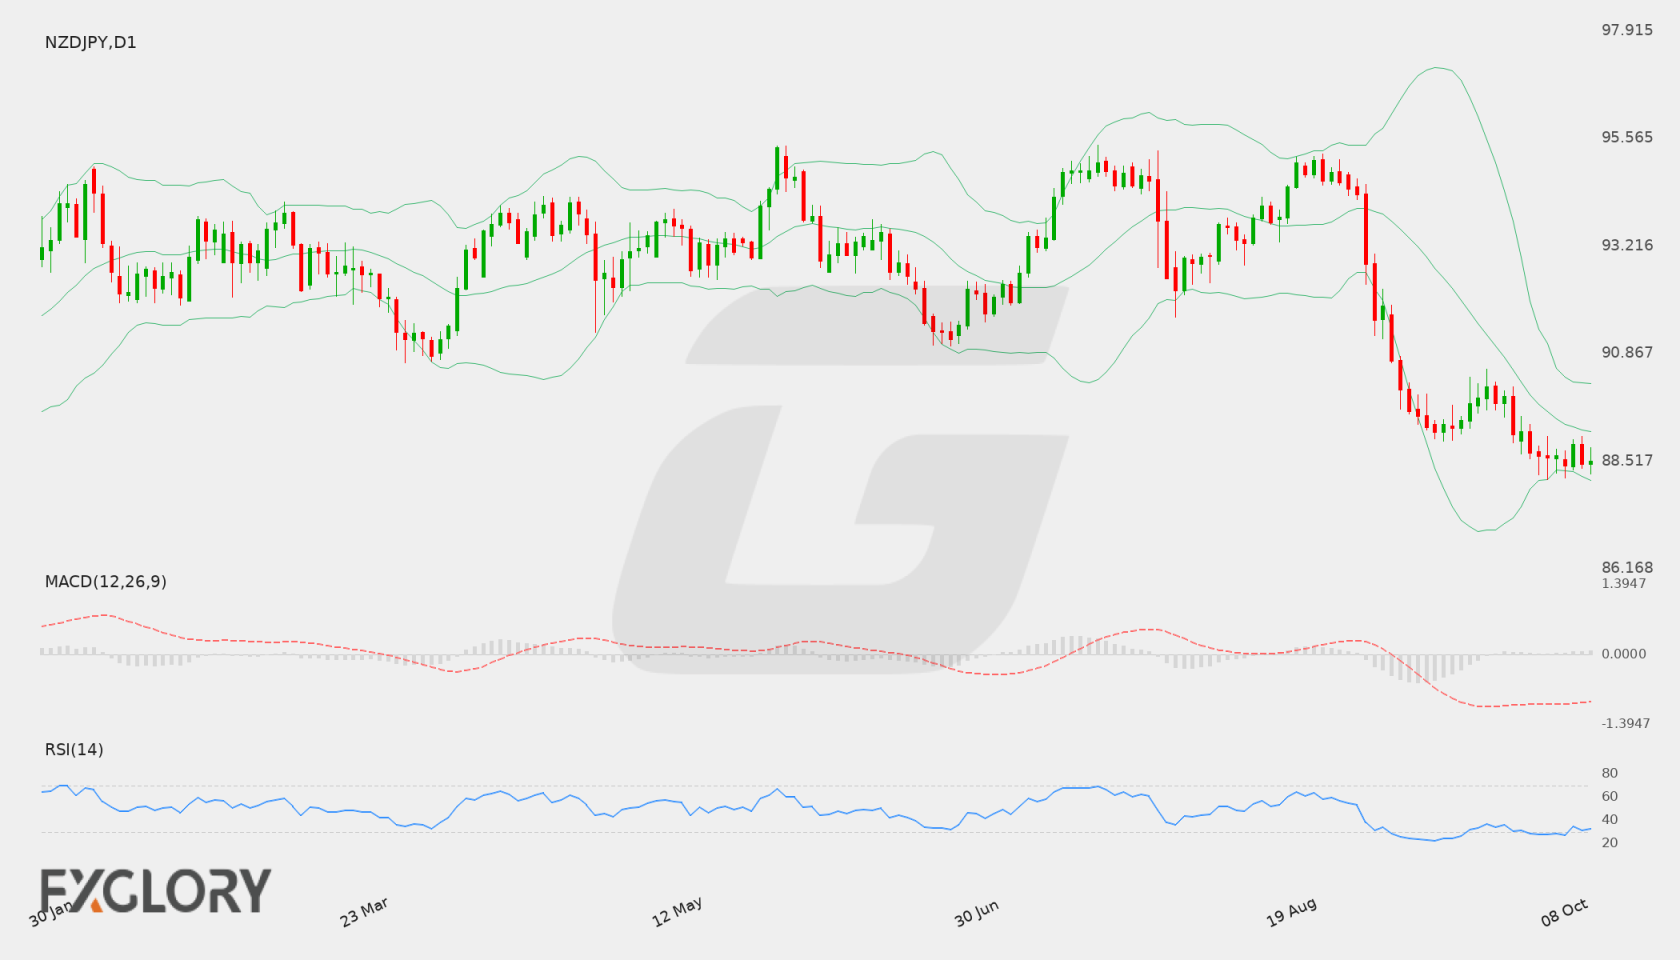
On the daily chart, NZD/JPY has maintained a pronounced downward trajectory after falling from peaks above 95.00. Recent sessions have printed consecutive lower closes, dropping from 89.931 to 89.098, 88.711, 88.639, and most recently 88.592. The latest daily candle established an intraday low of 88.100 before closing slightly higher, indicating that sellers remain in control while testing recent troughs.
Key Technical Indicators:
Bollinger Bands: The Bollinger Bands highlight ongoing downside volatility for NZD/JPY. The middle band sits at 89.596, while the upper band is positioned at 91.081 and the lower band at 88.111. With the last close at 88.592 lingering close to the lower band, the pair remains pinned in the lower half of the volatility envelope, indicating persistent downward pressure.
RSI: The 14-day Relative Strength Index (RSI) for NZD/JPY is currently reading at 27.43. This places the indicator into oversold territory beneath the 30 benchmark, suggesting heavy recent selling pressure that may either lead to consolidation or an attempted technical pause.
MACD: The Daily MACD for NZD/JPY sits well below zero at -0.991. This negative reading reflects consistent bearish momentum across recent trading sessions, showing that downside pressure continues to dominate the broader trend without a confirmed bullish crossover.
Support and Resistance:
Technical parameters for NZD/JPY identify primary daily support at 88.100, which aligns closely with the lower Bollinger band at 88.111. On the upside, major structural resistance is positioned at 95.415, while the 20-day middle Bollinger band at 89.596 serves as the immediate dynamic hurdle.
News to Watch for NZDJPY This Week:
No specific economic calendar events are available for this pair. Traders should monitor generic high-impact releases, central bank comments, and broader risk sentiment.
Weekly Outlook and Consideration:
The technical structure for NZD/JPY remains tilted to the downside following a sharp retreat toward the 88.592 level. With the MACD at -0.991 and price action trading near the lower Bollinger band of 88.111, downward momentum is clearly established. However, with the daily RSI deep in oversold conditions at 27.43, traders will likely watch whether the 88.100 support floor can hold off further declines or if corrective retracements will face resistance toward the middle band at 89.596.
Disclaimer: The analysis provided for NZD/JPY is for informational purposes only and does not constitute investment advice. Traders are encouraged to perform their own analysis and research before making any trading decisions. Market conditions can change quickly, so staying informed with the latest data is essential.
The NZD/JPY pair reflects ongoing interactions between New Zealand economic prospects and Japan’s monetary policy backdrop. Trading dynamics continue to respond to shifting sentiment around regional inflation pressures and broader interest rate expectations.
Price Action:
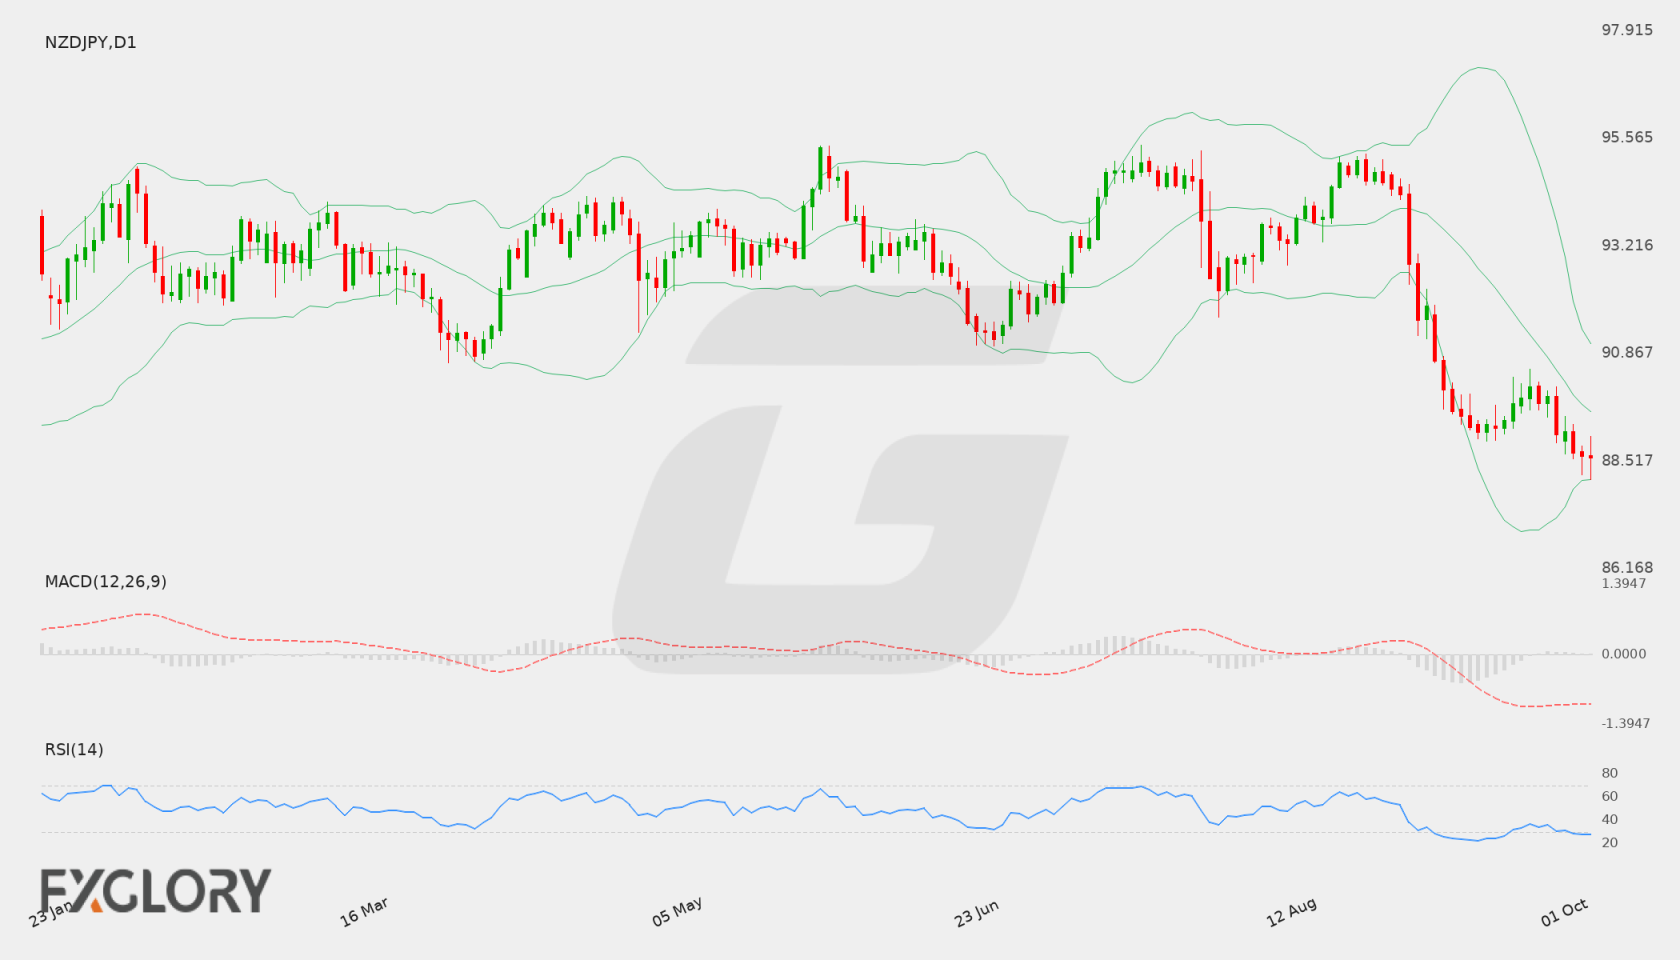
On the daily (D1) chart, NZD/JPY has experienced steady downward movement, bringing the latest close to 89.40. Price action reflects sustained selling pressure after declining from higher levels toward key historical support zones.
Key Technical Indicators:
Bollinger Bands: The D1 Bollinger Bands indicate a middle band at 92.0235, an upper band at 96.8243, and a lower band at 87.2227. With the current close at 89.40, price is trading noticeably below the middle line and navigating the lower half of the channel.
RSI: The 14-period RSI on the daily chart is currently at 26.18. This value falls below the 30 threshold, placing the instrument in oversold conditions and signaling possible downside fatigue.
MACD: The D1 MACD main line sits at -1.2637. This negative territory highlights underlying bearish momentum for the pair over recent daily sessions.
Support and Resistance:
Immediate key daily support for NZD/JPY is identified at 88.944, while key overhead resistance stands at 95.415.
News to Watch for NZDJPY This Week:
Tokyo Core CPI y/y: This release provides key inflation data from Japan that could influence monetary policy expectations and impact JPY sentiment.
Weekly Outlook and Consideration:
The daily timeframe for NZD/JPY (NZDJPY) maintains a cautious posture as price trades near 89.40, constrained beneath the middle Bollinger Band of 92.0235 and supported by negative MACD momentum at -1.2637. Nevertheless, the D1 RSI at 26.18 signals oversold conditions, which could encourage consolidation near the key support level of 88.944. A breach below this support level could reinforce bearish pressure, while a rebound would face substantial overhead resistance around 95.415.
Disclaimer: The analysis provided for NZD/JPY is for informational purposes only and does not constitute investment advice. Traders are encouraged to perform their own analysis and research before making any trading decisions. Market conditions can change quickly, so staying informed with the latest data is essential.
The NZD/JPY pair continues to be driven by shifting global risk sentiment and monetary policy expectations surrounding central banks in Japan and New Zealand. Market participants are closely watching upcoming economic data releases and official commentary to gauge potential policy shifts and broader market direction.
Price Action:
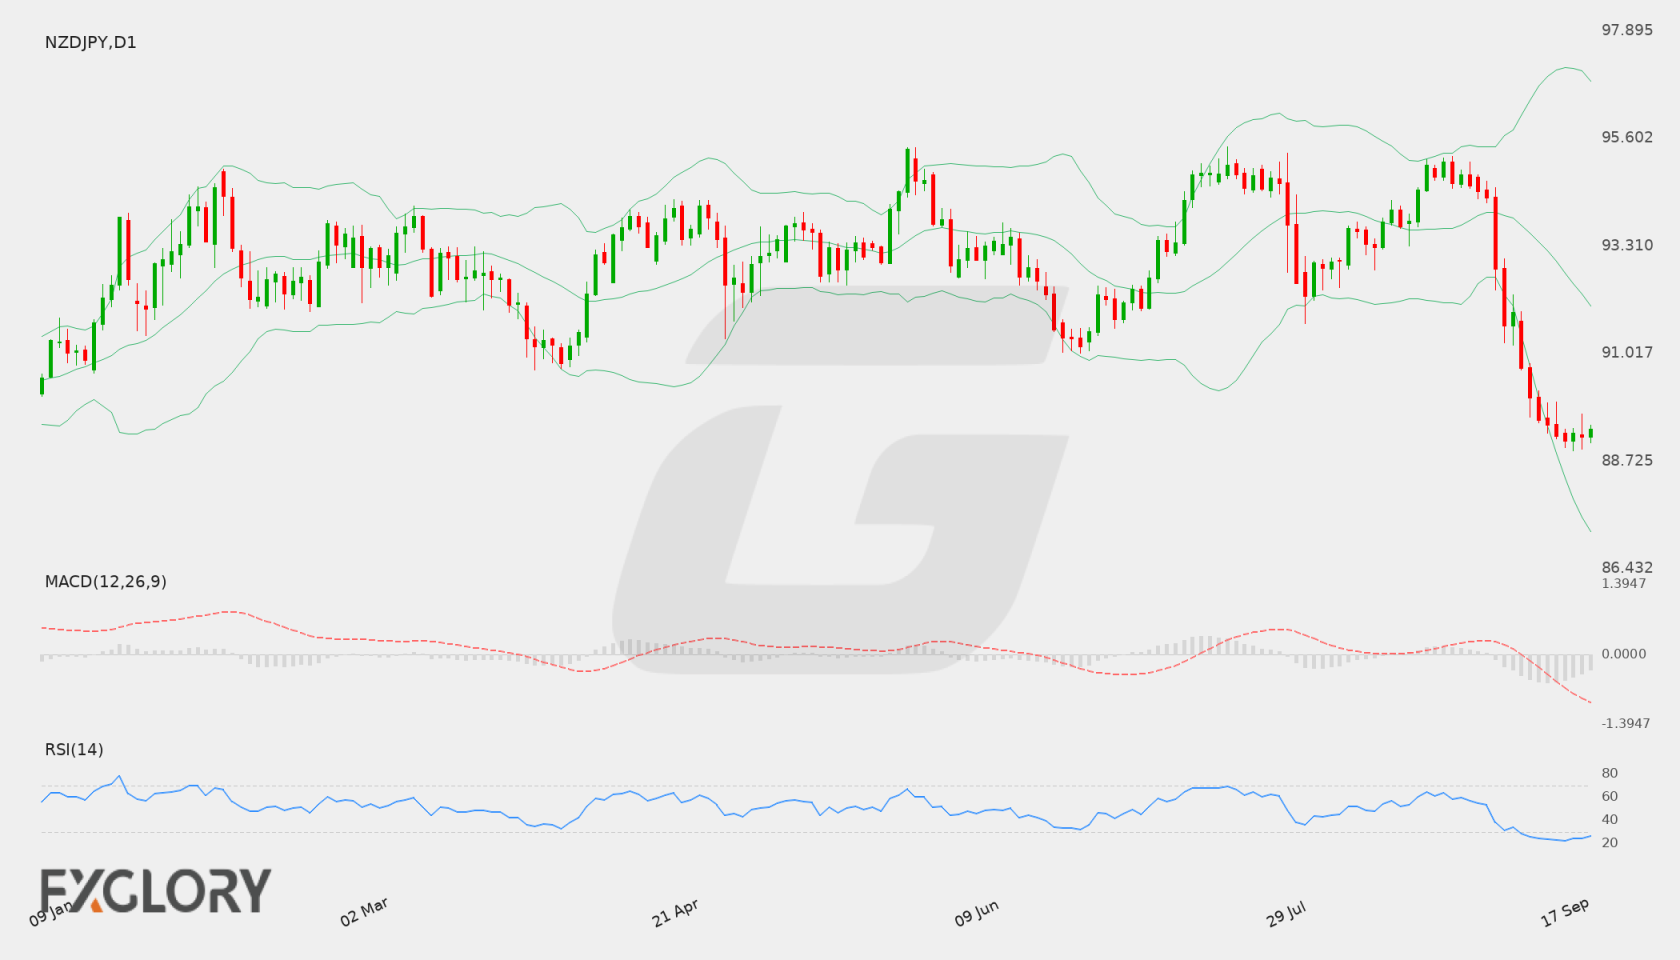
On the Daily (D1) chart, NZD/JPY has experienced a sharp decline from recent highs near 95.00 down to close at 89.511. The pair recently tested lows near the primary technical support level of 89.316, reflecting persistent selling momentum over recent trading sessions.
Key Technical Indicators:
Bollinger Bands: Bollinger Bands analysis on the daily timeframe places the middle band at 93.2036, the upper band at 96.9312, and the lower band at 89.4760. With the latest close at 89.511 sitting right near the lower band, price action reflects elevated downside momentum and trades near the lower threshold of its recent range.
RSI: The 14-period RSI currently reads 23.49, placing NZD/JPY firmly in oversold territory on the daily chart. While this highlights strong recent selling pressure, oversold levels can also signal the potential for a temporary stabilization or technical pullback.
MACD: The MACD line is recorded at -0.9717, remaining deep below the zero line. This indicates that bearish momentum continues to dominate the daily chart, though traders will watch for any signs of a momentum shift or convergence.
Support and Resistance:
Key short-term support is located at 89.316 near recent daily lows, while primary resistance is established at 95.415. Intermediate resistance on any upward recovery sits near the daily middle Bollinger band around 93.2036.
News to Watch for NZDJPY This Week:
GDP q/q: Growth statistics provide valuable insight into economic activity and broad macroeconomic health.
Monetary Policy Statement: Offers detailed guidance on future monetary stance and macroeconomic forecasts.
BOJ Press Conference: Outlines central bank monetary policy decisions and future guidance.
BOJ Policy Rate: Changes to interest rate settings directly influence currency valuations and market yields.
Weekly Outlook and Consideration:
NZD/JPY remains under heavy downside pressure following a drop to 89.511. However, with the RSI showing oversold conditions at 23.49 and price approaching the key support level of 89.316 alongside the lower Bollinger band at 89.4760, sellers may encounter strong technical resistance. A breach below support could open the door for further downside, whereas a failure to break lower might allow for a consolidation phase or rebound toward 93.2036.
Disclaimer: The analysis provided for NZD/JPY is for informational purposes only and does not constitute investment advice. Traders are encouraged to perform their own analysis and research before making any trading decisions. Market conditions can change quickly, so staying informed with the latest data is essential.
NZD/JPY remains heavily influenced by shifts in risk sentiment and interest rate expectations surrounding both the Reserve Bank of New Zealand and the Bank of Japan. Economic data and central bank signals from both economies play a crucial role in directing short-term trend direction.
Price Action:
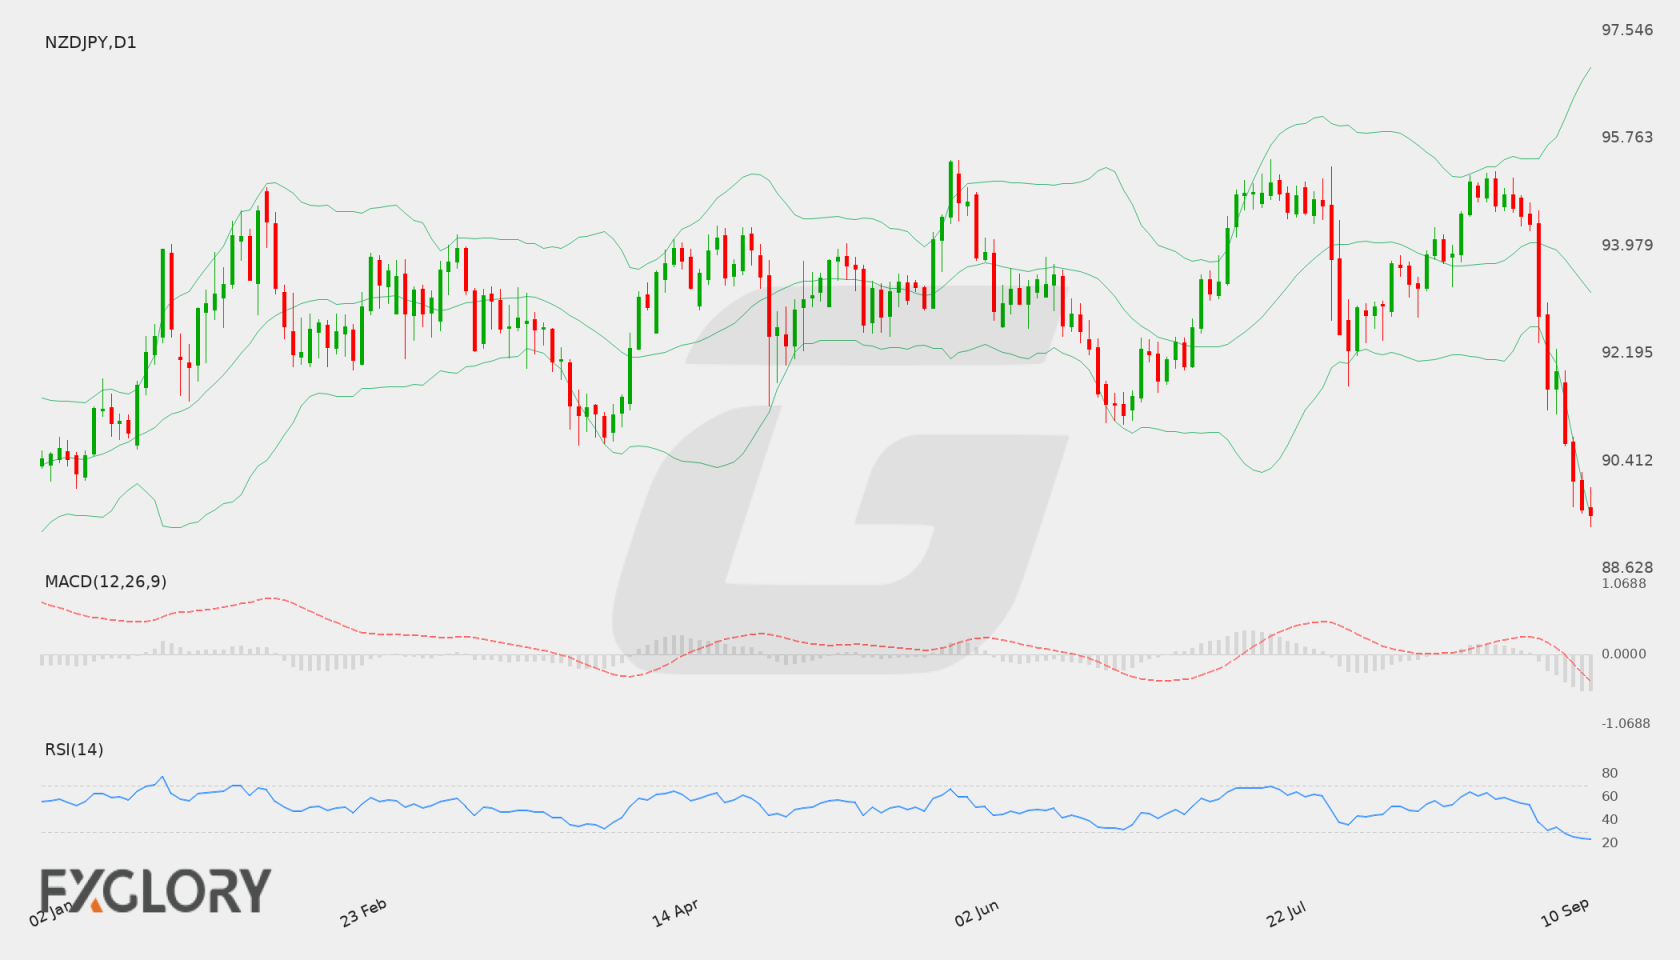
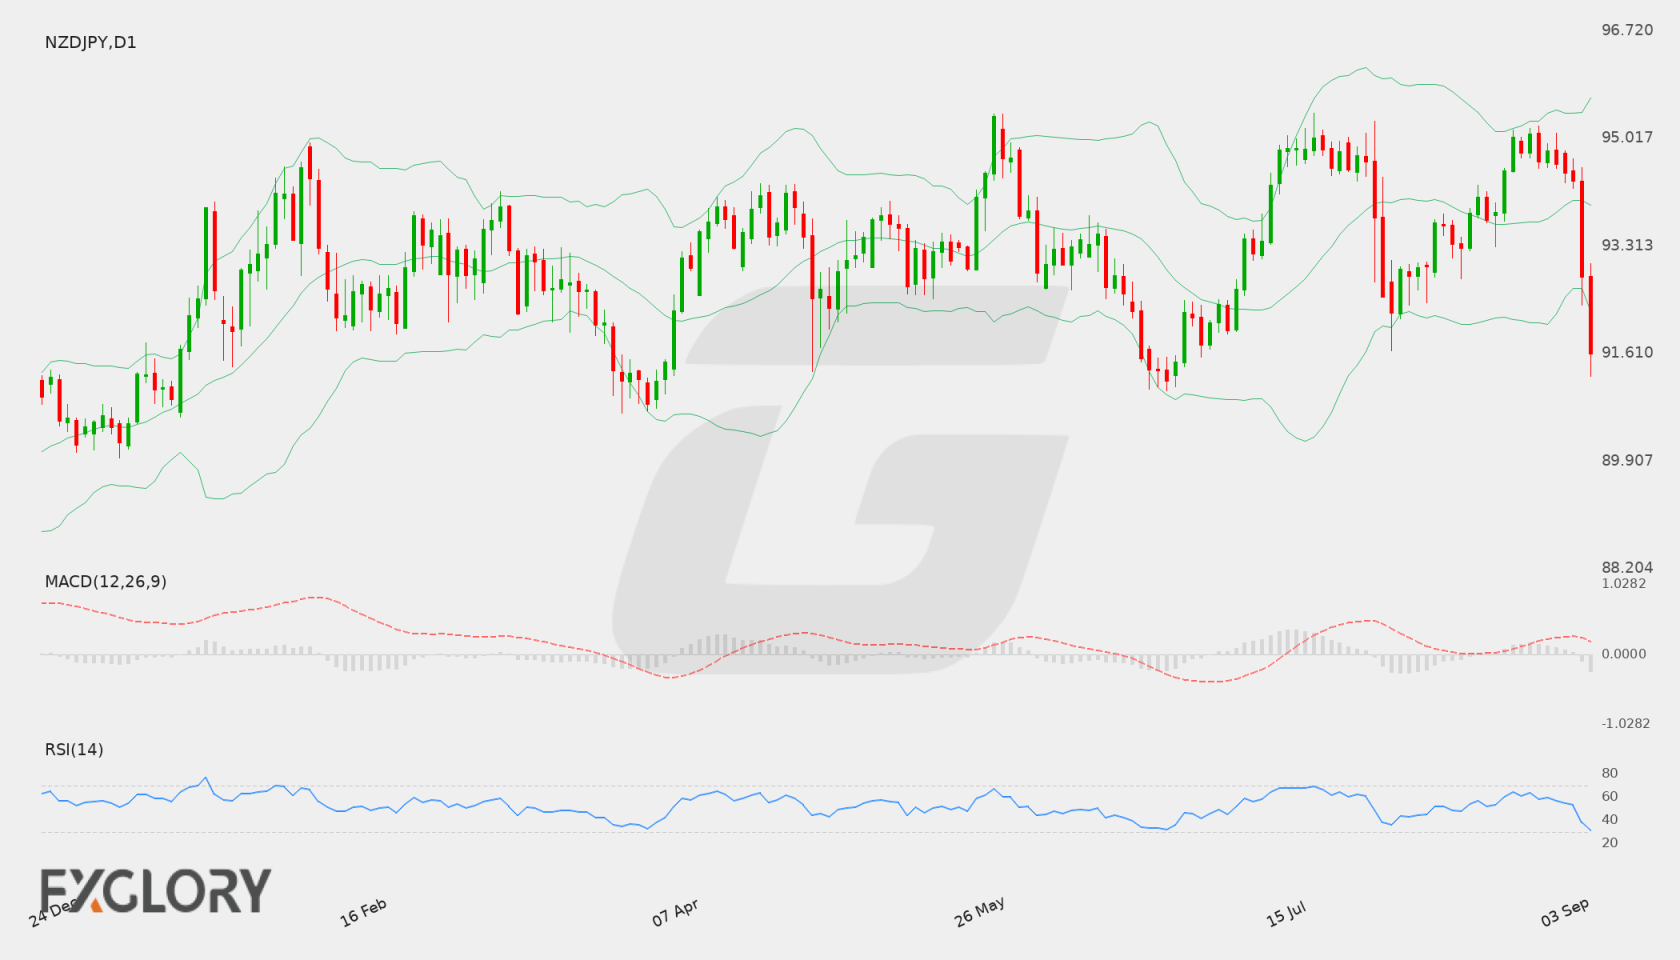
The daily chart highlights a sharp downward wave for NZD/JPY, dropping from recent peaks above 95.00 down toward a close of 91.611. Consistent lower daily lows indicate strong selling interest on the D1 timeframe.
Key Technical Indicators:
Bollinger Bands: The middle Bollinger Band sits at 93.960, with the upper band at 95.653 and lower band at 92.267. The last close of 91.611 sits below the lower band, reflecting expanded volatility to the downside.
RSI: The 14-day RSI is currently at 30.75, approaching the oversold threshold of 30, which indicates intense selling pressure in recent sessions.
MACD: The MACD indicator registers a negative value of -0.0748, confirming that bearish momentum currently dominates the daily price movement.
Support and Resistance:
Key technical levels for NZD/JPY place daily support at 91.023 and daily resistance at 95.415.
News to Watch for NZDJPY This Week:
GDP q/q: Reflects economic performance in New Zealand and can influence domestic rate expectations.
BOJ Policy Rate: Determines the benchmark interest rate in Japan and drives direct interest in the yen.
BOJ Press Conference: Delivers direct insights from central bank leadership regarding economic outlook and monetary policy.
Monetary Policy Statement: Summarizes monetary policy decisions and provides economic guidance for Japan.
Weekly Outlook and Consideration:
NZD/JPY enters the week with significant downside momentum, trading below its lower Bollinger Band and approaching the 91.023 support zone. A sustained hold near support could invite a corrective pullback toward the middle Bollinger Band at 93.960. However, if selling pressure breaks support at 91.023, the pair may see further downside expansion. Traders should monitor upcoming economic updates and policy statements closely for directional drivers.
Disclaimer: The analysis provided for NZD/JPY is for informational purposes only and does not constitute investment advice. Traders are encouraged to perform their own analysis and research before making any trading decisions. Market conditions can change quickly, so staying informed with the latest data is essential.