GBPUSD Forecast

GBP iconUSD icon
GBP/USD

British Pound vs US Dollar

GBP/USD Live Price

1.34106
-0.03%

GBP/USD Forecast — 19 May 2026

Time Zone: GMT +3

Time Frame: 4 Hours (H4)

Fundamental Analysis:

The GBPUSD H4 technical and fundamental analysis remains highly sensitive to upcoming inflation-related releases from the United Kingdom alongside speeches from Federal Reserve officials in the United States. Traders are closely monitoring UK CPI, Core CPI, PPI, RPI, and House Price Index data, as stronger inflation readings could reinforce expectations of tighter Bank of England monetary policy and support the British Pound. At the same time, upcoming remarks from Federal Reserve officials including Anna Paulson and Michael Barr may significantly influence USD volatility, especially if hawkish comments regarding future interest rates emerge. In addition, FOMC meeting minutes and US crude oil inventory data may further impact overall USD sentiment. Overall, the current GBPUSD H4 daily analysis and forex forecast suggests that both currencies may experience elevated volatility due to important macroeconomic releases and central bank commentary.

Price Action:

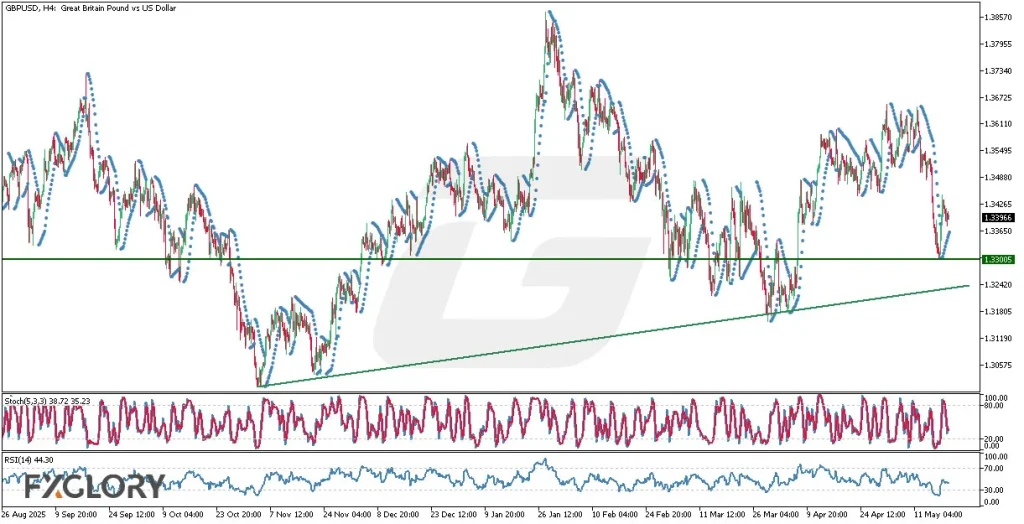
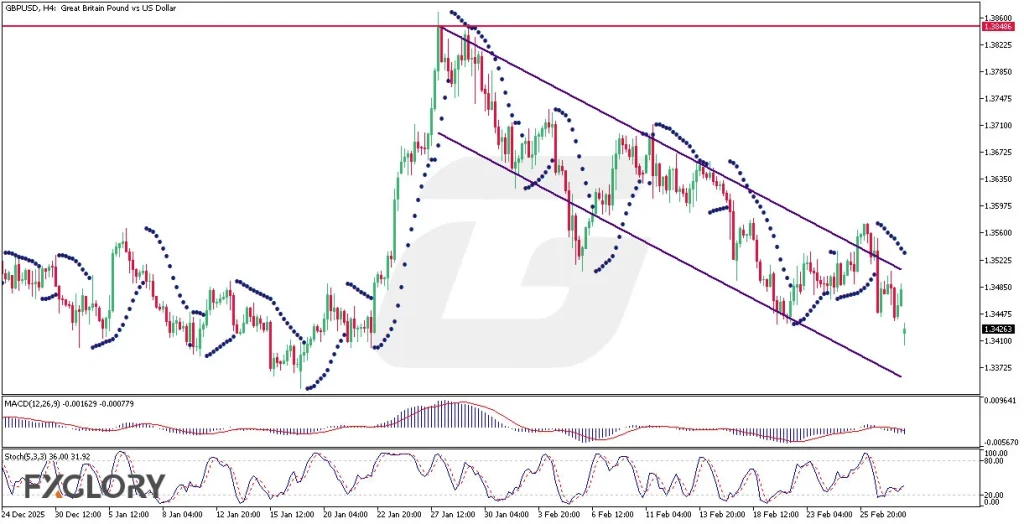
The GBPUSD H4 price action analysis shows that the pair has generally been moving upward along a long-term bullish trendline, forming a constructive higher-low structure over time. However, in the most recent sessions, the candles have been gravitating sharply downward toward the ascending support line, reflecting increasing bearish pressure in the short term. After touching the important support area near 1.33005, the pair managed to rebound temporarily, but sellers have once again pushed prices lower. Based on the previous behavior of the chart and the repeated attraction toward the bullish trendline, the market may continue drifting downward toward the support structure before a clearer directional breakout emerges. This keeps the current GBPUSD H4 chart analysis in a cautious corrective phase despite the broader bullish structure.

Key Technical Indicators:

Parabolic SAR: The Parabolic SAR dots are currently positioned below the candles, signaling that the broader bullish structure still remains technically valid. However, the narrowing distance between the dots and price action suggests weakening bullish momentum and the possibility of increased short-term consolidation.

Stochastic (5,3,3): The Stochastic oscillator currently reads 38.72 and 35.23, indicating that bearish momentum remains present but is not yet in oversold territory. The indicator suggests that sellers still have room to pressure the market lower before a stronger bullish recovery develops.

RSI (14): The RSI currently stands at 44.30, reflecting weakening bullish momentum and a market leaning slightly toward bearish conditions. Since the RSI remains below the neutral 50 level, sellers continue to maintain a short-term advantage in the current GBPUSD H4 technical analysis.

Support and Resistance:

Support: The nearest support level is located around 1.33005, which aligns with the recent rebound area and the ascending long-term support trendline.

Resistance: The closest resistance zone is seen near 1.34880, followed by the stronger resistance area around 1.35495, where previous bearish pressure intensified.

Conclusion and Consideration:

The current GBPUSD H4 technical analysis and price action forecast reflects a market that remains bullish in the broader trend but is facing increasing short-term corrective pressure. Technical indicators such as the RSI and Stochastic oscillator show weakening momentum, while the Parabolic SAR still supports the larger bullish structure. Price behavior suggests that the pair may continue gravitating toward the ascending support trendline before establishing a stronger directional move. Fundamentally, upcoming UK inflation releases and speeches from Federal Reserve officials may significantly increase market volatility and determine whether GBPUSD resumes its broader bullish trend or experiences a deeper correction.

Disclaimer:The analysis provided for GBP/USD is for informational purposes only and does not constitute investment advice. Traders are encouraged to perform their own analysis and research before making any trading decisions on GBPUSD. Market conditions can change quickly, so staying informed with the latest data is essential.

GBPUSD-H4-Technical-and-Fundamental-Analysis-for-05.20.2026

GBP/USD Forecast — 6 May 2026

Time Zone: GMT +3

Time Frame: 4 Hours (H4)

Fundamental Analysis:

The GBPUSD H4 technical and fundamental analysis is expected to experience elevated volatility due to several important Bank of England and US economic events scheduled for today. For the British Pound, traders are focusing on speeches from BOE MPC members Clare Lombardelli and Alan Taylor, as any hawkish comments regarding inflation or future interest rates could strengthen GBP sentiment. In addition, the UK Construction PMI remains an important leading indicator for economic activity and business confidence. On the US side, market participants are monitoring Challenger Job Cuts, Unemployment Claims, labor cost and productivity data, as well as speeches from several Federal Reserve officials including Kashkari, Hammack, and John Williams. Since Fed commentary can significantly influence interest rate expectations, today’s GBPUSD daily analysis may see strong USD-driven volatility depending on whether officials maintain a hawkish or cautious tone.

Price Action:

The GBPUSD H4 price action analysis shows that the pair has been moving in a broader ascending trend, consistently forming higher highs and higher lows over recent weeks. However, the candles are now facing strong resistance around the 1.36295 level, where several bullish attempts have failed to establish a confirmed breakout. At the same time, price continues to react positively from the 1.34587 support area, which has repeatedly acted as a strong buying zone. Between these support and resistance levels, the candles appear to be forming a bullish triangle pattern, suggesting that buying pressure is gradually increasing despite the current consolidation. If the pattern remains valid and buyers manage to break above resistance, the GBPUSD H4 forecast may favor continuation of the bullish trend.

Key Technical Indicators:

Bollinger Bands (30): After a previous expansion phase, the Bollinger Bands are now narrowing, indicating decreasing volatility and a possible breakout setup. The current consolidation near the upper half of the bands supports the ongoing bullish structure.

Stochastic (5,3,3): The Stochastic readings at 36.68 and 52.20 reflect recovering bullish momentum from lower levels. The indicator suggests that buyers are attempting to regain control after the recent pullback.

RSI (14): The RSI at 56.51 remains above the neutral 50 level, supporting a moderate bullish outlook. This indicates that bullish momentum still exists without entering overbought territory.

Support and Resistance:

Support: The major support level is located at 1.34587, which has repeatedly triggered bullish rebounds and maintained the upward structure.

Resistance: The key resistance stands at 1.36295, where recent candles have struggled to confirm a decisive bullish breakout.

Conclusion and Consideration:

The overall GBPUSD H4 chart daily analysis continues to favor a bullish outlook, although the pair is currently consolidating below an important resistance zone. The repeated defense of support at 1.34587 and the formation of a bullish triangle pattern suggest that buyers still maintain underlying market strength. Technical indicators such as RSI and Stochastic support the possibility of renewed bullish momentum, while the narrowing Bollinger Bands hint at a potential volatility expansion ahead. Fundamentally, speeches from BOE and Federal Reserve officials may become the key catalysts that determine the next directional move in the GBPUSD technical and fundamental analysis. A confirmed breakout above 1.36295 could open the door for further bullish continuation in the H4 timeframe.

Disclaimer: The analysis provided for GBP/USD is for informational purposes only and does not constitute investment advice. Traders are encouraged to perform their own analysis and research before making any trading decisions on GBPUSD. Market conditions can change quickly, so staying informed with the latest data is essential.

GBPUSD-H4-Technical-and-Fundamental-Analysis-for-05.07.2026

GBP/USD Forecast — 22 April 2026

Time Zone: GMT +3

Time Frame: 4 Hours (H4)

Fundamental Analysis:

The GBPUSD H4 technical and fundamental analysis for today is shaped by a series of important UK and US economic releases that could drive volatility across the session. For the British Pound, traders are monitoring the government budget balance, Manufacturing PMI, Services PMI, and CBI Industrial Trends Orders, all of which help measure economic momentum and business confidence. Better-than-expected UK figures would likely support Sterling and improve bullish sentiment in the GBPUSD daily analysis, while weaker data may pressure the Pound. On the US side, the main focus remains on Initial Jobless Claims, Manufacturing PMI, Services PMI, and Natural Gas Storage, with labor market data often having the strongest immediate effect on the US Dollar. As a result, today’s GBPUSD fundamental analysis suggests a potentially reactive market, where any surprise in macroeconomic data could trigger a directional move on the GBPUSD H4 chart.

Price Action:

The GBPUSD H4 price action analysis shows that after breaking out from the previous bearish trend, the pair managed to recover but has now started moving again inside a shallow bearish channel. This type of structure usually reflects a corrective decline rather than a strong impulsive selloff, meaning the market is still undecided about its next broader move. The latest candles are positioned around the middle of the channel, which clearly signals indecision and hesitation between buyers and sellers. On a wider scale, price is also trading midway between the major resistance at 1.38474 and the major support at 1.31836, which further confirms the absence of a dominant directional force. In this GBPUSD technical analysis, the next breakout from the channel may become the key signal that defines the pair’s short-term trend on the H4 timeframe.

Key Technical Indicators:

Moving Average: The moving average is very close to the latest candles and slightly above them, indicating mild bearish pressure in the short term. This suggests the line is acting as dynamic resistance unless price can reclaim it with stronger bullish momentum.

RSI (14): The RSI at 47.12 reflects neutral momentum with a slight bearish bias. It shows that the market is not oversold, but buyers currently lack enough strength to fully regain control.

Williams %R (14): The Williams %R at -58.53 points to a neutral-to-bearish tone, with price trading in the lower half of its recent range. This supports the idea of consolidation with limited bullish conviction for now.

Support and Resistance:

Support: The major support level is located at 1.31836, which represents the lower boundary of the broader visible range on the GBPUSD H4 chart.

Resistance: The major resistance level stands at 1.38474, marking the upper boundary of the broader range and the main bullish target if momentum strengthens.

Conclusion and Consideration:

The overall GBPUSD H4 chart daily analysis reflects a market in consolidation, where the previous bullish recovery has slowed and price is now moving within a shallow bearish channel. The current GBPUSD price action does not yet confirm a full bearish reversal, but it does show that bullish momentum has weakened considerably. At the same time, the neutral readings from RSI and Williams %R support the idea that the pair is waiting for a stronger catalyst before making its next major move. From a fundamental perspective, today’s UK and US economic releases may provide that catalyst and increase volatility in the pair. In this GBPUSD H4 forecast, traders should watch carefully for a breakout above or below the channel, as that move may determine the next short-term trading direction.

Disclaimer: The analysis provided for GBP/USD is for informational purposes only and does not constitute investment advice. Traders are encouraged to perform their own analysis and research before making any trading decisions on GBPUSD. Market conditions can change quickly, so staying informed with the latest data is essential.

GBPUSD-H4-Technical-and-Fundamental-Analysis-for-04.23.2026

GBP/USD Forecast — 19 March 2026

Time Zone: GMT +2

Time Frame: 4 Hours (H4)

Fundamental Analysis:

The GBPUSD H4 fundamental analysis today reflects a mixed outlook driven by upcoming UK labor market data and US economic indicators. For GBP, traders are closely watching the Claimant Count Change, Average Earnings, and ILO Unemployment Rate, as stronger-than-expected results could support the pound. Meanwhile, Bank of England (BOE) monetary policy expectations remain a key driver, especially if signals turn more hawkish. On the USD side, Initial Jobless Claims and manufacturing data will influence dollar strength, with positive data supporting USD demand. Overall, this GBPUSD fundamental outlook suggests elevated volatility, making this forex daily analysis crucial for traders following GBPUSD price action.

Price Action:

The GBPUSD H4 price action analysis shows a sustained bearish trend, with candles moving steadily within a descending channel. Price is currently approaching the lower boundary of the channel while also testing a long-term ascending trendline, forming a strong confluence support zone. Although bearish pressure remains dominant, weakening momentum and potential bullish divergence suggest a possible reversal. This GBPUSD technical analysis indicates that a breakout or rebound from this zone could define the next directional move.

Key Technical Indicators:

Parabolic SAR: The dots are currently above the candles, confirming ongoing bearish momentum in the GBPUSD H4 chart. However, the tightening gap suggests a possible trend shift if the price reverses upward.

RSI (14): The RSI indicates weak bearish momentum and is close to oversold territory, hinting at potential exhaustion. A move above 50 would support a bullish recovery in GBPUSD price action.

MACD (12,26,9): The MACD remains negative, confirming the bearish trend in this GBPUSD H4 analysis. However, the shrinking histogram suggests weakening downside momentum and a possible bullish crossover.

Support and Resistance:

Support: Key support is located near 1.3220–1.3250, aligning with the lower channel boundary and long-term trendline.

Resistance: Immediate resistance is around 1.3400–1.3450, corresponding to the upper channel and recent highs.

Conclusion and Consideration:

This GBPUSD H4 technical and fundamental daily analysis shows a bearish market approaching a critical support zone with signs of weakening momentum. While indicators still favor sellers, potential bullish divergence and support confluence increase the likelihood of a reversal. Traders should monitor upcoming GBP and USD economic data closely, as they may trigger volatility and confirm the next move. A breakout above resistance could signal a bullish reversal, while a breakdown below support may extend the bearish trend.

Disclaimer: The analysis provided for GBP/USD is for informational purposes only and does not constitute investment advice. Traders are encouraged to perform their own analysis and research before making any trading decisions on GBPUSD. Market conditions can change quickly, so staying informed with the latest data is essential.

GBPUSD_H4_Technical_and_Fundamental_Analysis_For_03.19.2026

GBP/USD Forecast — 2 March 2026

Time Zone: GMT +2

Time Frame: 4 Hours (H4)

Fundamental Analysis:

The GBPUSD H4 technical and fundamental analysis today is driven by key macroeconomic releases from both the UK and the US. For the USD, traders are monitoring the S&P Global Manufacturing PMI, ISM Manufacturing PMI, and the ISM Manufacturing Prices Paid index. Stronger-than-forecast PMI readings above 50.0 would indicate expansion and could support the US Dollar, increasing volatility in the GBPUSD H4 chart. On the GBP side, Nationwide House Price Index (HPI), BOE money supply data, mortgage approvals, consumer credit figures, and speeches from BOE MPC members are in focus. Hawkish commentary or stronger UK data may provide short-term support to the British Pound and influence the GBPUSD H4 price action.

Price Action:

In this GBPUSD H4 chart daily analysis, after marking the highest level in a while at 1.38486, the candles have begun descending along a clear bearish channel, forming several breakout failures along their way. The rejection near the upper boundary confirmed strong selling pressure and a shift to a bearish market structure. Currently, the candles have reached the mid-band of the channel, acting as a decision zone. If bearish momentum continues, the price could move toward the lower band of the channel, reinforcing the ongoing downtrend in this GBPUSD H4 technical analysis.

Key Technical Indicators:

Parabolic SAR: The Parabolic SAR dots remain above the candles, confirming a bearish trend on the H4 timeframe. As long as the dots stay above price, selling pressure dominates and the downward channel structure remains valid.

MACD (12,26,9): The MACD is in negative territory with the MACD line below the signal line, reflecting ongoing bearish momentum. No bullish crossover is visible yet, keeping the GBPUSD H4 forecast tilted to the downside.

Stochastic (5,3,3): The Stochastic is below the 50 level, indicating weak bullish momentum and room for further downside. A turn back toward oversold would support continuation of the bearish price action.

Support and Resistance:

Support: Immediate support is located at 1.34260, aligning with a recent swing low and the lower half of the bearish channel.

Resistance: The nearest resistance level stands at 1.35600, near the mid-to-upper boundary of the descending channel.

Conclusion and Consideration:

The GBPUSD H4 technical and fundamental analysis shows that the pair remains under bearish pressure within a descending channel after failing to hold above 1.38486. Technical indicators support a cautious bearish outlook, while upcoming PMI data and BOE-related events may trigger volatility. Traders following this GBPUSD H4 chart daily analysis and price action strategy should wait for confirmation signals around key support and resistance levels.

Disclaimer: The analysis provided for GBP/USD is for informational purposes only and does not constitute investment advice. Traders are encouraged to perform their own analysis and research before making any trading decisions on GBPUSD. Market conditions can change quickly, so staying informed with the latest data is essential.

GBPUSD_H4_Technical_and_Fundamental_Analysis_For_02.03.2026

1GBP = –––USD –––%
GBPUSD
Loading chart...