

The D1 structure remains bullish, but consecutive lower closes, negative momentum and bearish H4 conditions make the weekly setup conditional rather than one-sided.
EUR/SEK Weekly Forecast at a Glance
In brief
EUR/SEK is bullish on the controlling D1 timeframe, although negative momentum and bearish H4 conditions make the outlook conditional.
The weekly thesis is anchored to a bullish D1 trend state and rising EMA50 and SMA200 slopes, with the last D1 close at 11.1747 above the primary support at 11.13138. However, the consecutive lower-close sequence and negative momentum show that the broader structure is not currently receiving clean short-term confirmation.
The tactical picture is less supportive: H4 is bearish, its last close is 11.19042, and its bearish condition sits alongside the D1 reference close below the primary resistance at 11.27526. A recovery through the supplied resistance framework would improve the bullish case, while weakness through the lower structural boundary would materially weaken it.
| Price at last update | 11.19034 as of 10 Oct 2026 02:50 GMT+3 |
|---|---|
| Completed D1 reference close | 11.17470 as of 8 October 2026 |
| Primary support | 11.13138 |
| Secondary support | 11.09611 |
| Primary resistance | 11.27526 |
| Bullish targets | 11.3108, 11.34777 |
| Bearish targets | 11.09611, 11.06132 |
| Formal weekly thesis invalidation | Lower 11.11991 — One completed D1 close below 11.11991 formally invalidates the bullish weekly thesis. |
Live EUR/SEK Tools
A forecast is a snapshot. These pages keep moving with the market.
- Live
Live chart & price
Watch EUR/SEK move tick by tick. Flip from the 1-minute chart to the monthly, with trading conditions right alongside.
- Live
Technical signals
Buy, sell or sit it out? Oscillators, moving averages and pivot points boiled down to one clear reading, updated live.
Economic calendar
Know what's coming before it hits the price: every scheduled release with impact, forecast and actual.
Historical data
Open, high, low and close on any timeframe from 1 minute to monthly. Test your idea, then download the data.
All EUR/SEK forecasts
Every weekly outlook in one place. Scroll back to see how earlier calls played out against the chart.
EUR/SEK Fundamental Drivers This Week
No scheduled events were provided for this forecast, so the weekly assessment is driven by the technical structure, momentum, tactical timeframe and supplied levels.
Current EUR/SEK Price and Weekly Market Context
The D1 framework remains bullish, but the last close at 11.1747 is accompanied by consecutive lower closes and negative momentum. H4 is bearish, creating tactical pressure against the broader D1 direction. Stable volatility suggests that level tests may develop without a volatility-based directional signal, leaving the interaction with 11.13138 support and 11.27526 resistance central to the weekly reading.
- D1 trendbullishClose vs 50 EMA and 200 SMA
- H4 tacticalbearishH4 close vs 20 and 50 EMA
- MomentumnegativeRSI and MACD histogram
- VolatilitystableD1 ATR change
Is EUR/SEK Bullish or Bearish This Week?
The primary scenario is a conditional bullish continuation framework supported by D1 trend and moving-average slope, but the immediate path is contested by lower D1 closes, negative momentum and bearish H4 structure. A neutral range would reflect unresolved two-sided pressure, while a bearish alternative would require deterioration through the lower structural boundary.
Scenario 1 of 3Bullish continuation
- D1 confirmation
- The bullish case would receive stronger D1 support if price action reasserted the broader bullish structure and progressed through the supplied resistance sequence beginning at 11.27526, with 11.3108 and 11.34777 as the permitted upside targets.
- H4 tactical signal
- A bullish H4 shift would improve tactical alignment if H4 moved out of its bearish condition and reclaimed the supplied H4 resistance at 11.20635, allowing the D1 thesis to receive nearer-term confirmation.
- Targets
- 11.3108, 11.34777
- Scenario failure condition
- The bullish scenario would be materially weakened by continued consecutive lower D1 closes or a move through the lower structural boundary at 11.11991, particularly if H4 remains bearish.
Scenario 2 of 3Base / neutral
- D1 confirmation
- The base scenario would be supported if the D1 trend remained bullish but price continued to show consecutive lower closes without a decisive resolution of the supplied support and resistance framework.
- H4 tactical signal
- The base scenario would fit an H4 market that remains bearish or fails to provide a clear directional shift, preserving tactical pressure without independently replacing the D1 weekly thesis.
- Targets
- The neutral interpretation is a two-sided interaction between primary support at 11.13138 and primary resistance at 11.27526, with secondary levels at 11.09611 and 11.3108 defining the next supplied boundaries.
- Scenario failure condition
- The base scenario would lose relevance if a completed D1 close established a clear structural resolution beyond the supplied weekly framework, or if weakness reached the lower boundary at 11.11991.
Scenario 3 of 3Bearish reversal
- D1 confirmation
- The bearish alternative would gain D1 support if the consecutive lower-close sequence extended and price weakened through 11.13138 toward the permitted bearish targets at 11.09611 and 11.06132.
- H4 tactical signal
- Bearish tactical pressure would become more relevant if H4 remained below its supplied resistance at 11.20635 while its bearish condition continued to oppose the broader D1 trend.
- Targets
- 11.09611, 11.06132
- Scenario failure condition
- The bearish scenario would weaken if D1 price action recovered through the supplied resistance sequence, particularly 11.27526 and 11.3108, and H4 stopped confirming downside pressure.
EUR/SEK D1 Outlook and H4 Technical Triggers
The daily timeframe controls the weekly thesis. H4 evidence is used only for earlier confirmation, tactical warning and scenario-failure context. Complete live H4, H1 and intraday readings remain on the Technical page.
D1 Price Action and Market Structure
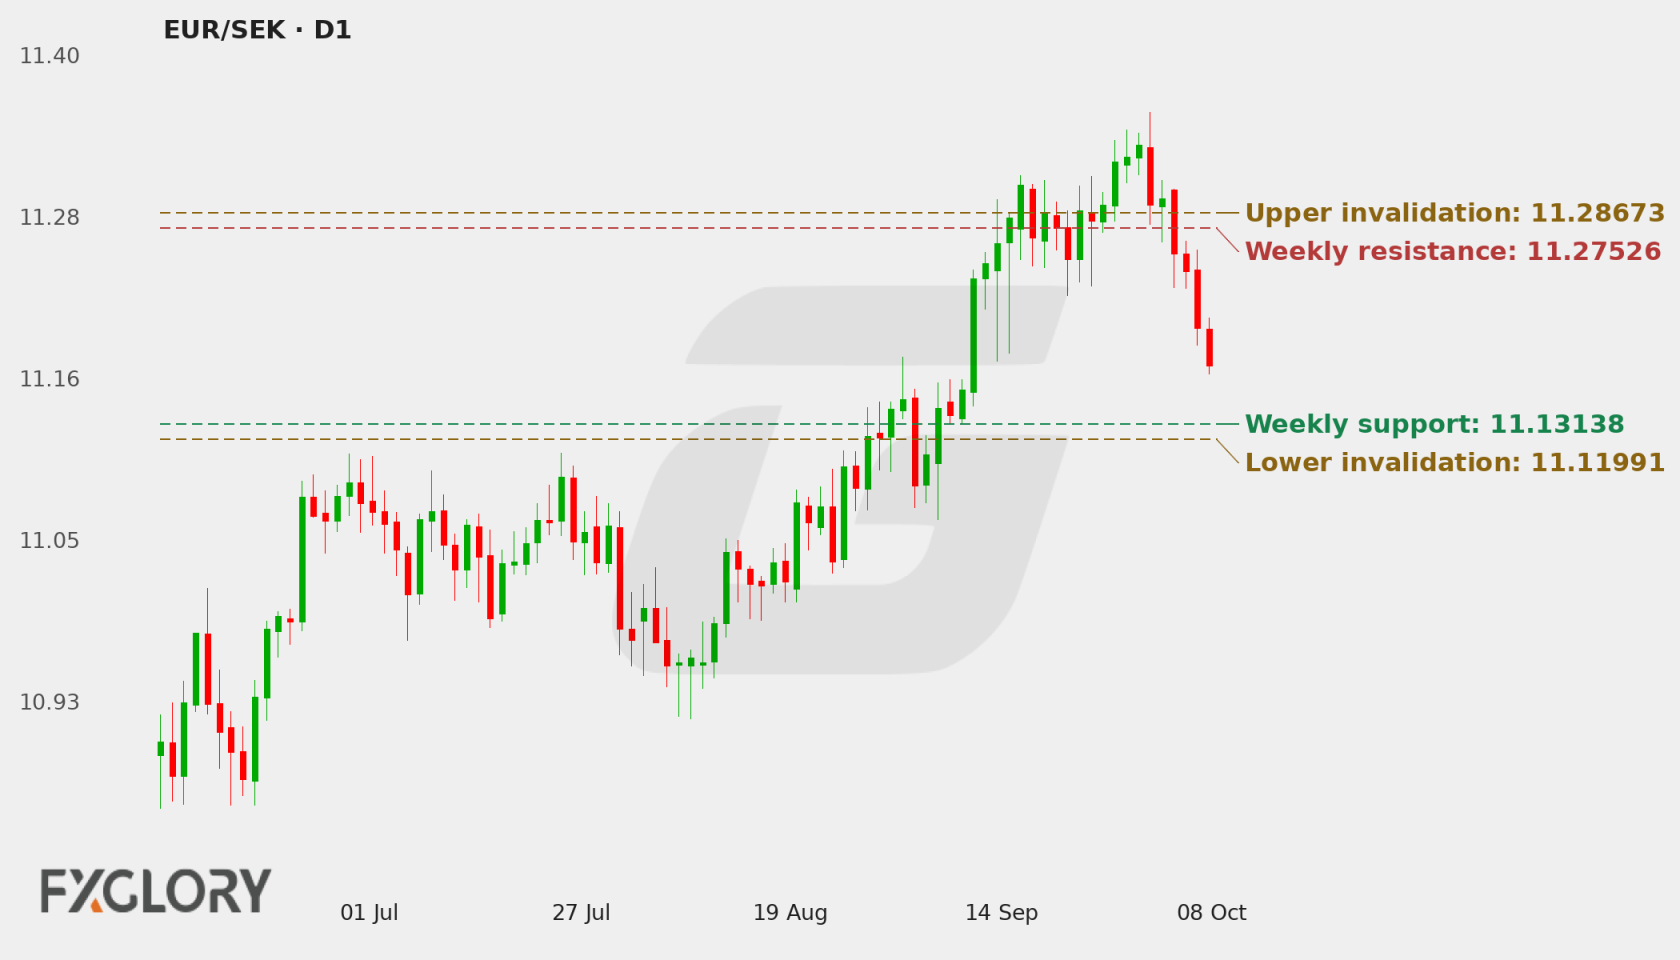
The D1 last close is 11.1747, with consecutive lower closes despite a bullish trend state. It is below the primary resistance at 11.27526 and above the primary support at 11.13138, placing the weekly structure between the key supplied boundaries. The rising EMA50 and SMA200 slopes support the broader trend, while the close sequence shows near-term deterioration within that structure.
H4 Tactical Triggers
H4 is bearish, with a last close of 11.19042 and a bearish tactical relationship to the broader D1 thesis. The supplied H4 support at 11.18332 and resistance at 11.20635 frame the immediate tactical context, while the H4 momentum readings remain below their corresponding signal context even though the MACD histogram is positive at 0.001452. H4 therefore provides a warning and timing constraint rather than a replacement for the D1 thesis.
Technical Indicators at a Glance
Automated technical summary
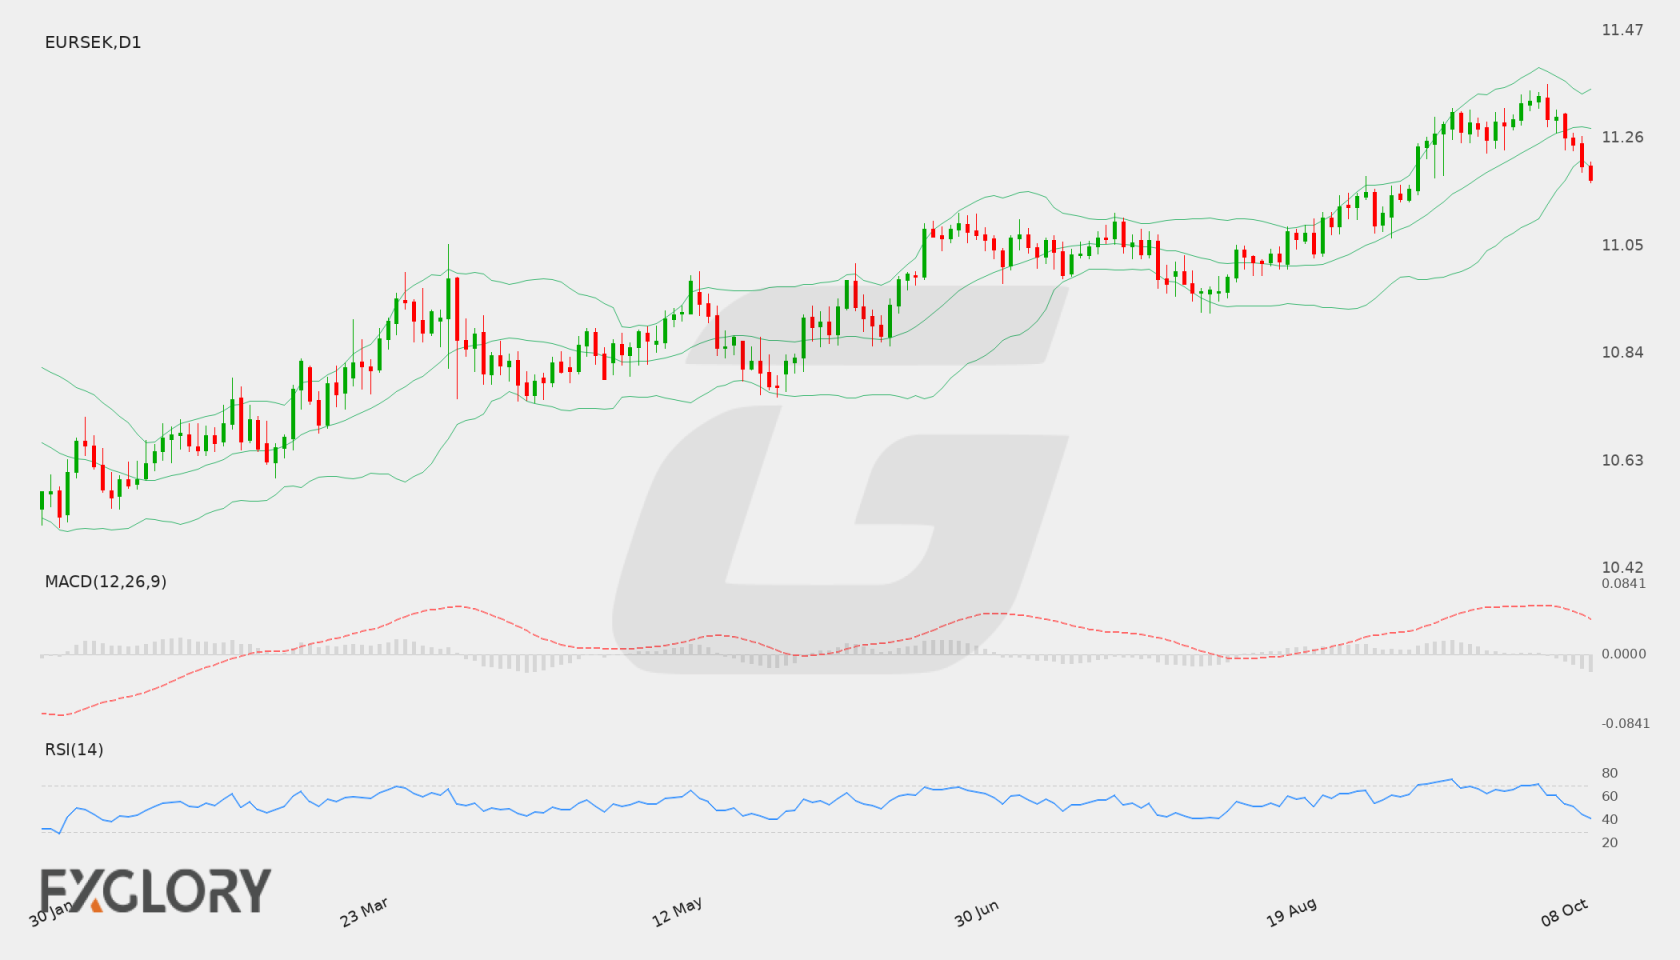
The technical picture is mixed across timeframes: D1 trend structure and rising longer-term moving-average slopes support the bullish bias, while consecutive lower closes, negative D1 momentum and bearish H4 conditions argue for a conditional reading. Stable volatility does not resolve the directional conflict.
Selected snapshot: D1 with H4 tactical context. Updated 11 October 2026.
- RSI41.35Neutral
- MACDBelow signalBearish
- Bollinger BandsOutside bandBelow lower band
- Moving averagesAbove bothBullish
- ATR573.3 pipsStable
RSI (14)
Neutral
H4 37.42
D1 RSI at 41.35 and H4 RSI at 37.42 are consistent with subdued momentum rather than strong upside follow-through. Their weaker readings reinforce the caution created by the lower-close sequence and bearish H4 state, but they do not by themselves determine the weekly direction.
- D1 RSI
- 41.35
- H4 RSI
- 37.42
MACD (12, 26, 9)
Bearish momentum
D1 MACD momentum is negative because the MACD at 0.021175 is below its signal at 0.042203, with a histogram of -0.021028. H4 remains tactically bearish, although its histogram is positive at 0.001452, creating a limited counter-signal that does not yet overturn the H4 tactical state.
- MACD
- 0.021175
- Signal
- 0.042203
- Histogram
- -0.021028
Bollinger Bands (20, 2σ)
Below lower band
Striped ends = price outside the bands.
The D1 close at 11.1747 is below the D1 lower Bollinger level at 11.19854, while the H4 close at 11.19042 is below its middle Bollinger level at 11.20378 and above its lower level at 11.15031. This configuration highlights downside pressure and tactical restraint, while the stable volatility state limits directional interpretation from the bands alone.
- Position in band
- 238.4 pips below lower
- Band width
- 1534.5 pips (1.36%)
Moving averages (D1)
Bullish structure
- 50 EMA rising11.17363Price is 10.7 pips above (+0.01%)
- 200 SMA rising10.90484Price is 2698.6 pips above (+2.47%)
The rising EMA50 and SMA200 slopes support the D1 trend framework. The D1 close at 11.1747 is below the EMA20 at 11.24411 and above the EMA50 at 11.17363, while H4 remains below its EMA20 at 11.20344 and EMA50 at 11.23801. This contrast supports a bullish broader structure with weaker short-term positioning.
- D1 close
- 11.17470
- 50 EMA
- 11.17363
- 200 SMA
- 10.90484
ATR (14)
Stable volatility
One ATR either side of the latest close. A measure of move size, not a price target.
D1 ATR at 0.05733 and H4 ATR at 0.02053 describe the available movement context, while the derived volatility state is stable. Volatility therefore suggests that level tests may occur within an established range of movement, but it does not provide directional confirmation.
- D1 ATR
- 0.05733 (0.51%)
- H4 ATR
- 0.02053 (0.18%)
Technical conclusion: The main thesis remains bullish because the D1 trend state and rising EMA50 and SMA200 slopes provide the strongest structural evidence. The meaningful counterargument is the consecutive lower-close sequence combined with negative D1 momentum and bearish H4 conditions. The next supplied weekly reference points are 11.13138 support and 11.27526 resistance, with the lower structural boundary at 11.11991 defining the formal downside condition for the bullish view.
View all live EUR/SEK oscillators, moving averages, pivot points and timeframe signals.
EUR/SEK Weekly Support, Resistance and Invalidation
| Level | Role | Timeframe | Why it matters |
|---|---|---|---|
| 11.13138 | Primary support | D1 | It is the first supplied support below the 11.1747 D1 reference close and marks the nearest structural area for assessing whether the broader bullish framework is holding. |
| 11.09611 | Secondary support | D1 | It is the second supplied support and also the first permitted bearish target if downside pressure extends beyond primary support. |
| 11.27526 | Primary resistance | D1 | It is the first supplied resistance above the reference close and the initial level required for a stronger upside development. |
| 11.3108 | Secondary resistance and bullish target | D1 | It is the second supplied resistance and the first permitted bullish target, linking resistance progression with the upside scenario. |
| 11.18332 | H4 support | H4 | It frames the immediate tactical downside area within the bearish H4 condition. |
| 11.20635 | H4 resistance | H4 | A recovery through this supplied H4 level would improve tactical alignment with the broader D1 bullish thesis. |
These are forecast-specific market-structure levels. Formula-based Classic, Fibonacci and Camarilla pivots remain on the Technical page.
Economic News & Events to Watch for EUR/SEK This Week
No scheduled events available for this period.
Calendar source: FXGlory economic calendar. Retrieved 11 Oct 2026 17:10 GMT+3. View the complete EUR/SEK economic calendar.
EUR/SEK Outlook for 11–17 October 2026
EUR/SEK retains a bullish weekly bias because the D1 trend state and rising longer-term moving-average slopes outweigh the weaker short-term evidence in the current hierarchy. The reference close at 11.1747 sits between primary support at 11.13138 and primary resistance at 11.27526, leaving the weekly structure conditional rather than resolved.
Negative momentum, consecutive lower D1 closes and bearish H4 conditions are the principal constraints on the bullish case. A stronger upside development would bring 11.3108 and 11.34777 into focus as permitted targets, while deterioration through the lower structural boundary at 11.11991 would materially weaken the selected bias.
Weekly Forecast Risks and What Would Change the Outlook
- D1 and H4 timeframe disagreement: The bullish D1 trend state is opposed by a bearish H4 tactical state, reducing the immediacy and clarity of the weekly setup.
- Negative momentum: D1 RSI at 41.35 and the negative D1 MACD histogram of -0.021028 indicate that momentum is not currently confirming the broader bullish structure.
- Consecutive lower D1 closes: The close sequence shows near-term deterioration within the bullish trend framework and keeps the primary support at 11.13138 in focus.
- Stable volatility: Stable volatility may allow the market to remain range-bound or develop gradually, delaying a clear resolution between the supplied support and resistance levels.
Formal weekly invalidation: The bullish weekly thesis is formally invalidated by one completed D1 close below 11.11991. One completed D1 close above 11.28673 confirms upper structural extension and continuation.
EUR/SEK Weekly Forecast FAQs
Is EUR/SEK bullish or bearish this week?
The weekly bias is Bullish because the controlling D1 trend state and rising longer-term moving-average slopes support the broader structure. Negative momentum and bearish H4 conditions prevent a high-conviction interpretation.
What scenario would strengthen for EUR/SEK this week?
The bullish scenario becomes more relevant if D1 structure firms and price develops through the supplied resistance area toward 11.3108 and 11.34777. A neutral scenario would feature two-sided movement between the supplied support and resistance levels, while a bearish scenario would gain relevance if weakness extends through the lower structural boundary.
What are the key EUR/SEK support and resistance levels?
Primary support is 11.13138, followed by secondary support at 11.09611. Primary resistance is 11.27526, followed by secondary resistance at 11.3108. The permitted bullish targets are 11.3108 and 11.34777, while the permitted bearish targets are 11.09611 and 11.06132.
What would invalidate this EUR/SEK forecast?
The bullish weekly thesis is formally invalidated by one completed D1 close below 11.11991.
Methodology, Data and Sources
- Price-data source: FXGlory price feed (EURSEK)
- Live quote timestamp: 10 Oct 2026 02:50 GMT+3
- Weekly analysis timestamp: 11 October 2026
- Chart timestamp: 11 October 2026 (redrawn daily)
- Technical snapshot timestamp: 11 October 2026
- Calendar-data source: FXGlory economic calendar
- Calendar retrieval timestamp: 11 Oct 2026 17:10 GMT+3
- Candle convention: FXGlory D1 and H4 candles; D1 candle dates are evaluated in UTC and invalidation uses completed D1 closes only.
- Indicator settings: D1 RSI(14), MACD(12,26,9), Bollinger Bands(20,2), EMA(50), SMA(200), ATR(14); H4 RSI/MACD/Bollinger/EMA/ATR.
- Level-selection method: Weekly D1 support/resistance levels are structural market levels. Formal invalidation uses a hard 0.75× D1 ATR(14) minimum anchor distance plus a 0.20× D1 ATR(14) outward buffer; H4 levels are tactical only.
- Weekly forecast method: D1 controls the weekly thesis; H4 supplies tactical confirmation/warning only.
