EURAUD Forecast

EUR iconAUD icon
EUR/AUD

Euro vs Australian Dollar

EUR/AUD Live Price

1.64319
+0.11%

EUR/AUD Forecast — 24 December 2024

Time Zone: GMT +2

Time Frame: 4 Hours (H4)

Fundamental Analysis:

The EUR/AUD currency pair is currently influenced by key fundamental factors. Today, the Eurozone is observing a German Bank Holiday, resulting in reduced liquidity for the EUR. This typically leads to lower trading volumes and can cause the EUR to exhibit subdued volatility. Conversely, the Australian Dollar (AUD) is set to react to the release of the Monetary Policy Meeting Minutes at 12:30 AM. Traders will be closely monitoring these minutes for insights into the Reserve Bank of Australia’s (RBA) future monetary policy decisions, which could significantly impact the AUD’s strength against the EUR. The interplay between reduced EUR liquidity and potential shifts in AUD policy outlooks is expected to shape the trading dynamics of the EURAUD pair today.

Price Action:

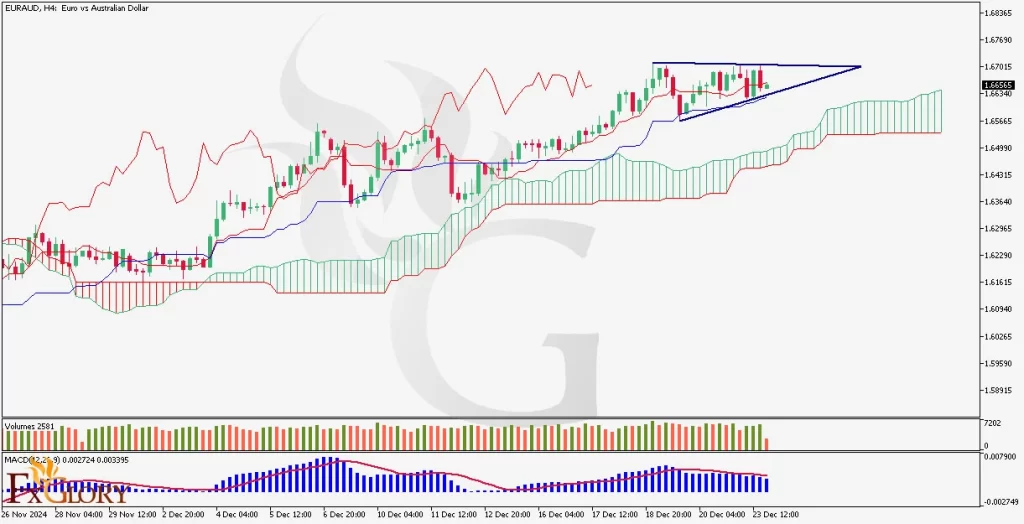
On the H4 timeframe, the EURAUD pair is demonstrating a bullish price action. The current price sits above the Ichimoku Cloud, indicating a strong upward momentum. Additionally, the price is forming a flag pattern, which suggests a continuation of the prevailing bullish trend after a brief consolidation phase. The pair has maintained its position above key support levels at 1.66172, 1.65700, and 1.65620, reinforcing the upward trajectory. This flag pattern, combined with the price being above the Ichimoku Cloud, points to a sustained bullish sentiment among traders, potentially leading to further upward movement in the near term.

Key Technical Indicators:

Ichimoku Cloud: On the EURAUD chart, the price and candles are positioned above the Ichimoku cloud, signaling a strong bullish trend. The Tenkan-sen is above the Kijun-sen, further confirming upward momentum, while the Chikou Span remains above the price action, adding additional bullish confirmation in this technical analysis.

MACD (Moving Average Convergence Divergence): The MACD line is above the signal line and both are above the zero line, indicating robust bullish momentum. The expanding MACD histogram suggests increasing strength in the upward trend, and recent bullish crossovers reinforce the potential for continued price gains.

Volume: Trading volume on the H4 timeframe for EURAUD is on the rise, supporting the bullish outlook as higher volumes accompany the upward price movement. The increasing volume during price advances indicates strong buying interest, reinforcing the likelihood of sustained bullish.

Support and Resistance Levels:

Support: Immediate support at 1.66172, where the price is currently consolidating. Further support levels are seen at 1.65700 and 1.65620, which could provide stronger buying interest if the price continues to decline.

Resistance: Resistance is located at 1.67000, a recent level where price gains were capped. Additional resistance levels are at 1.67500 and 1.68000, where stronger selling pressure may re-emerge if the price rebounds.

Conclusion and Consideration:

The EURAUD pair on the H4 chart exhibits strong bullish momentum, supported by both fundamental and technical indicators. The price remains above the Ichimoku Cloud and is forming a flag pattern, suggesting a continuation of the upward trend. RSI and volume indicators further reinforce the buy signal, while the established support levels provide a safety net against potential pullbacks. However, traders should remain cautious of upcoming fundamental events, such as the release of the AUD Monetary Policy Meeting Minutes, which could introduce volatility. Additionally, the reduced EUR liquidity due to the German Bank Holiday may lead to unexpected price movements. Overall, the technical setup is favorable for bullish traders, but staying alert to fundamental developments is essential.

Disclaimer: The analysis provided for EUR/AUD is for informational purposes only and does not constitute investment advice. Traders are encouraged to perform their own analysis and research before making any trading decisions on EURAUD. Market conditions can change quickly, so staying informed with the latest data is essential.

euraud-H4--Technical-and-fundamental-analysis-and-price-aciton-for-12.24.2024

EUR/AUD Forecast — 5 November 2024

Time Zone: GMT +2

Time Frame: 4 Hours (H4)

Fundamental Analysis

The EUR/AUD currency pair tracks the exchange rate between the Euro (EUR) and the Australian Dollar (AUD). On November 5, 2024, attention is centered on economic developments from both regions. For the Australian dollar, traders are eyeing the Reserve Bank of Australia’s (RBA) latest interest rate announcement and subsequent policy statement. The market will be looking for any indications of future rate hikes or adjustments based on the RBA’s economic outlook. Meanwhile, the Euro is influenced by economic releases such as the French Treasury budget results and industrial output data, which will shed light on the strength of the Eurozone’s economy. Investors will also focus on any remarks from European officials, particularly regarding inflation and fiscal policy, which could sway the market’s expectations for upcoming monetary decisions.

Price Action

On the H4 chart, EUR AUD has exhibited a bullish trend in recent weeks. However, this trend appears to be reversing as the latest candles show increased bearish activity. The price has broken below the 23.6% Fibonacci retracement level and is heading towards the 38.2% level, signaling a potential deeper correction. Although there have been a few bullish candles, the overall sentiment remains bearish, with traders closely monitoring whether the pair will find support or continue declining.

Key Technical Indicators

Ichimoku Cloud: The price is currently positioned above the Ichimoku Cloud but is gradually moving downward. If the price breaks into the cloud, it may confirm a bearish shift, but staying above it could suggest underlying support.

MACD (Moving Average Convergence Divergence): The MACD line is approaching the signal line from above, indicating weakening bullish momentum. The shrinking histogram supports a bearish outlook, and a potential bearish crossover would further confirm downward pressure.

%R (Williams %R): The %R indicator is nearing oversold territory, suggesting that the downtrend may be overextended. However, there are no clear reversal signals yet, so caution is advised.

Parabolic SAR: The Parabolic SAR dots are located above the price candles, confirming a bearish trend. This indicator suggests continued downward movement unless a strong bullish reversal develops.

Support and Resistance Levels

Support: Key support is at 1.6370, aligning with the 38.2% Fibonacci retracement level. A break below this level could accelerate the bearish trend.

Resistance: Initial resistance is at 1.6530, near the 23.6% Fibonacci level, with stronger resistance at 1.6645.

Conclusion and Consideration

The EUR/AUD H4 analysis indicates a likely continuation of the bearish trend, highlighted by signals from the Ichimoku Cloud, Parabolic SAR, and a weakening MACD. Key support at 1.6370 will be critical, and a break below it could signal further declines. The RBA’s interest rate announcement and economic projections will be pivotal for AUD movements, while Eurozone data will affect EUR sentiment. Traders should exercise caution and employ proper risk management strategies, given the potential for increased volatility following these major news events.

Disclaimer: The analysis provided for EUR/AUD is for informational purposes only and does not constitute investment advice. Traders are encouraged to perform their own analysis and research before making any trading decisions on EURAUD. Market conditions can change quickly, so staying informed with the latest data is essential.

EURAUD---H4_Daily_Technical_and_Fundamentan_Analysis_for_11_05_2024-

EUR/AUD Forecast — 3 July 2024

Time Zone: GMT +3

Time Frame: 4 Hours (H4)

Fundamental Analysis:

The EUR/AUD news analysis, often influenced by economic indicators and policy decisions from both the Eurozone and Australia, sees varying volatility based on such releases. Recent data from the Australian Bureau of Statistics show a promising increase in retail sales and new building approvals, suggesting a potential boost in economic activities that may strengthen the Australian Dollar. On the European front, the French Treasury reports a budget surplus and upcoming PMI data indicate healthy service sector growth. These factors collectively enhance the fundamental landscape, offering a mixed outlook for the EUR/AUD forecast today as both currencies find robust support from their respective economies.

Price Action:

The EUR/AUD H4 chart depicts a consolidation phase within a rising channel, indicating a bullish undercurrent tempered by recent hesitations in price movements. The currency pair has consistently tested the channel’s support and resistance boundaries, with the latest of the pair’s technical analysis hinting at a slight bearish retracement from the upper channel line. This typical reaction at upper resistance levels may lead to short-term pullbacks but maintains the overall upward trend.

Key Technical Indicators:

Ichimoku Cloud: The price is currently trading within the Ichimoku Cloud. This positioning indicates a neutral zone where buying and selling pressures are balanced but also suggests potential volatility as the price tests the cloud’s boundaries for either a breakout or a rejection.

RSI (Relative Strength Index): The RSI on the chart is near 51.38, indicating a neutral momentum with neither overbought nor oversold conditions, suggesting that there is room for the price to move in either direction without immediate pressure from momentum extremes.

Stochastic Oscillator: The Stochastic lines are converging around the 30 level, which typically signals a potential upward reversal if they turn upwards, marking a key watch-out for buyers.

Support and Resistance:

Support Levels:The immediate support is visible at the lower boundary of the trading channel and further strengthened by another support near 1.60745, which previously acted as both support and resistance.

Resistance Levels: The upper channel line currently acts as the primary resistance level, with further resistance potentially forming near recent highs at around 1.62500.

Conclusion and Consideration:

As the EUR/AUD analysis today navigates through significant economic releases, the technical setup favors a cautiously bullish outlook with considerations for potential pullbacks. Traders should remain alert to breaking above the cloud or a reversal at key support levels. Monitoring upcoming economic indicators will be crucial in guiding short-term trading strategies.

Disclaimer: The provided analysis is for informational purposes only and does not constitute investment advice. Traders should conduct their own research and analysis before making any trading decisions.

EURAUD H4 Chart on 7-3-2024

EUR/AUD Forecast — 30 April 2024

Time Zone: GMT +2

Time Frame: 4 Hours (H4)

Fundamental Analysis:

The EUR/AUD pair is greatly influenced by the economic health and monetary policies of the Eurozone and Australia. Interest rate differentials, economic growth disparity, and global risk sentiment are key drivers. Europe’s energy situation and Australia’s export performance, particularly in minerals and resources, provide additional context. The Euro might be pressured by internal political dynamics, while the Australian Dollar might react to commodity cycles and trade relationships, especially with China.

Price Action:

The downtrend indicated in the H4 chart has shown signs of a potential pause or reversal, with the last candle closing positively and the ongoing candle showing a sharp rise. This could indicate buying pressure entering the market, suggesting a bullish retracement or even a reversal if further bullish candles follow.

Key Technical Indicators:

Ichimoku Cloud: Price below the cloud suggests a bearish trend; however, a short-term bullish signal might be emerging if price breaks above the cloud.

MACD: Current positioning below the signal line points to bearish momentum, but convergence towards the signal line could indicate weakening bearish momentum.

RSI: Slightly below the mid-point at 44.81, suggesting neither overbought nor oversold conditions, aligning with a potential turning point in market sentiment.

Standard Deviation (StdDev): Low StdDev points to a consolidating market, which could precede a breakout.

Support and Resistance:

Support: The chart suggests 1.6375 as a recent support level where the price has shown some rebound.

Resistance: Resistance is anticipated around 1.6450, indicated by recent price peaks and the Ichimoku cloud’s lower boundary.

Conclusion and Consideration:

The EUR/AUD pair, in the current H4 timeframe, suggests a bearish trend with potential early signs of a bullish correction. The recent positive closure of a candle and an ongoing sharp rise could provide opportunities for a bullish entry with caution. Traders should closely monitor upcoming fundamental data releases affecting both the Euro and the Australian Dollar. It is essential to apply prudent risk management, considering the volatility inherent in the forex market.

Disclaimer: This analysis is for informational purposes only and does not constitute investment advice. Traders should perform their own due diligence before making any investment decisions. own research and analysis before making any trading decisions.

EURAUD-H4-Daily-Technical-Analysis-On-30.04.2024

EUR/AUD Forecast — 17 April 2024

Time Zone: GMT +2

Time Frame: 4 Hours (H4)

Fundamental Analysis:

The jobless report from the Department of Labor is to be published on April 18th and it is possible to highly affect gold prices. Basically, if the report shows fewer people are out of work than it was expected, it means the economy is probably doing alright, and the dollar could get stronger; and when the dollar bulks up, gold usually doesn’t shine as much, and its price could take a hit. On the flip side, if the report isn’t great and shows more people without jobs, it could mean trouble for the US economy, and the dollar might weaken. That’s when gold could start its next move, and we might see its price start to climb. Keep an eye on that report—it’s going to be a strong trading signal for where gold heads next!

Price Action:

A technical analysis of the XAU/USD price action shows the commodity is approaching a significant resistance area between $2420 and $2460. This price level could serve as a turning point for the current bullish momentum. The candlestick formation on the H4 chart indicates that if the price fails to break through this resistance zone, a bearish wave may ensue, leading to potential target levels at $2280.00 and then $2196.50.

Key Technical Indicators:

MACD: The Moving Average Convergence Divergence (MACD) is showing signs of a potential sharp bearish wave as it forms lower tops, showing a potential finish to the current bullish momentum.

RSI: The Relative Strength Index (RSI) exhibits negative divergence, a bearish signal indicating that the upward price momentum is losing strength despite the increase in price.

Gold Bearish Signals:

There are a few bearish signals lining up for the gold market, hinting at a possible downturn. We’re seeing gold approach a resistance level that it might struggle to break through. At the same time, the MACD chart is shaping up in a way that suggests a bearish trend might be on the horizon, and the RSI indicator is also hinting at a downward swing with its negative divergence. When you fold the latest unemployment rate into this mix, it definitely adds an interesting angle to any gold price prediction. It looks like these technical signs, along with the fundamental economic data, are suggesting we keep our eyes peeled for a potential drop in gold prices.

While the market’s focus is often on short-term fluctuations, the broader view of gold’s fundamentals, coupled with technical analysis, provides insights for future gold price directions. The anticipation surrounding the unemployment rate forecast and its implications for monetary policy will be critical in shaping the long-term outlook for XAU/USD.

Conclusion:

Investors and traders considering the gold market must weigh both fundamental economic indicators and technical analysis. The impending unemployment report serves as a near-term catalyst that could influence investor sentiment and gold price trends. While technical indicators suggest the possibility of a bearish reversal, it’s imperative to stay updated with the upcoming fundamental news to make informed trading decisions.

Disclaimer: This analysis is for informational purposes only and does not constitute investment advice. Traders should conduct their own research and analysis before making any trading decisions.

GOLD H4 chart analysis on 17-04-2024

1EUR = –––AUD –––%
EURAUD
Loading chart...