BCHUSD Forecast

BCH iconUSD icon
BCH/USD

Bitcoin Cash vs US Dollar

BCH/USD Live Price

209.88000
-4.91%

BCH/USD Forecast — 19 April 2024

Time Zone: GMT +2

Time Frame: 4 Hours (H4)

Fundamental Analysis:

Bitcoin Cash (BCH) trades against the US Dollar in the BCHUSD pair. As a cryptocurrency, BCH is influenced by factors such as regulatory news, technological advancements, and the overall sentiment in the crypto market. Given that Bitcoin Cash is a fork of Bitcoin, its value can also be affected by the performance and changes in the larger Bitcoin ecosystem. Market liquidity and adoption rates of BCH for transactions and by exchanges play a crucial role as well.

Price Action:

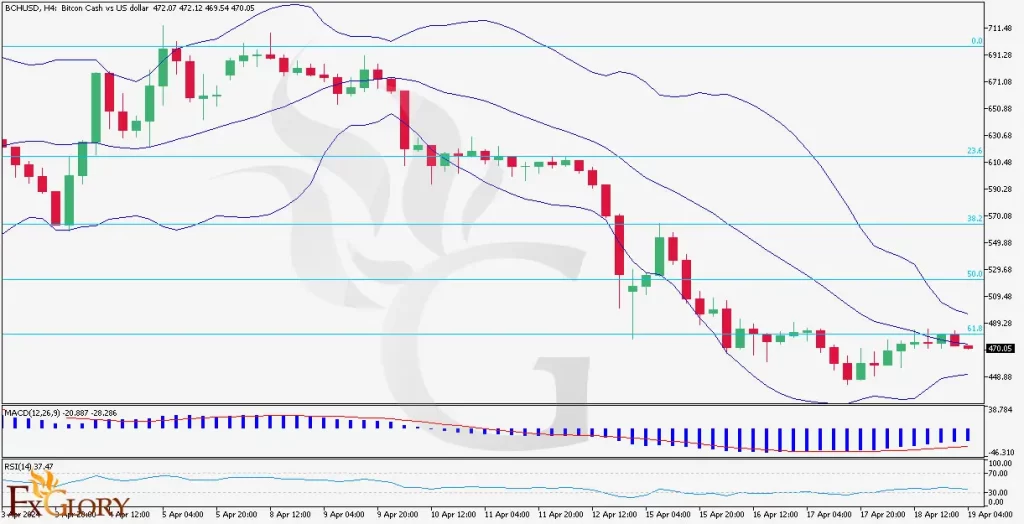
On the H4 chart for BCHUSD, there is a clear bearish trend in progress with the price action creating lower highs and lower lows. Recently, the price has consolidated, forming a slight range as buyers and sellers negotiate the next move. This consolidation is within the context of the larger downtrend, indicating hesitancy among traders.

Key Technical Indicators:

Bollinger Bands: The price is currently near the middle Bollinger Band, showing a neutral position but within a downtrend context.

MACD (Moving Average Convergence Divergence): The MACD line is below the signal line and the histogram bars are on the downside, reinforcing the bearish momentum.

RSI (Relative Strength Index): The RSI is near the 40 mark, suggesting bearish momentum without being in the oversold territory, leaving room for further downward movement.

Support and Resistance:

Support: The nearest support level can be identified around the $460 price zone, where recent lows have formed.

Resistance: The first layer of resistance appears to be at the 0.618 Fibonacci retracement level, near $490, with further resistance possible at the upper Bollinger Band.

Conclusion and Consideration:

The BCHUSD pair is currently in a bearish phase on the H4 chart, with technical indicators supporting the continuation of this trend. However, there is potential for a short-term pullback, considering the market’s attempt to stabilize recently. It’s important for traders to watch for a decisive break out of the current range for direction, and keep an eye on broader market sentiment and news which can significantly impact cryptocurrencies like BCH. Proper risk management should be a priority due to the inherent volatility in the crypto market.

Disclaimer: The provided analysis is for informational purposes only and does not constitute investment advice. Traders should conduct their own research and analysis before making any trading decisions.

BCHUSDH4-Technical-Analysis---19.04

BCH/USD Forecast — 22 February 2024

Time Zone: GMT +2

Time Frame: 4 Hours (H4)

Fundamental Analysis:

Bitcoin Cash (BCH) is a cryptocurrency that resulted from a hard fork of Bitcoin, aiming to provide faster transactions by increasing the block size. Fundamental factors impacting BCH include its adoption rate, regulatory news regarding cryptocurrency, technological advancements, and the overall sentiment in the cryptocurrency market. Additionally, competition from other cryptocurrencies and potential forks can influence investor confidence and price. With the ongoing debate over scalability and transaction fees in the crypto space, developments within the Bitcoin Cash community and its perceived advantages over Bitcoin can also play a crucial role.

Price Action:

The H4 chart of BCHUSD shows that after a substantial uptrend, the price action has entered a period of consolidation. The recent price movements indicate a slight bearish bias as the market made lower highs and lower lows, suggesting a potential trend reversal. However, the last candlestick is touching the lower Bollinger Band, hinting at a possible oversold condition and a short-term bounce or price correction.

Key Technical Indicators:

Bollinger Bands: The price is touching the lower Bollinger Band, indicating a possible oversold condition that could lead to a bounce back towards the mean.

MACD (Moving Average Convergence Divergence): The MACD line is below the signal line and the histogram bars are decreasing in height, suggesting bearish momentum is waning.

RSI (Relative Strength Index): The RSI is slightly below the midline at 46.53, indicating neither overbought nor oversold conditions, but leaning towards a bearish sentiment.

Support and Resistance:

Support: The first level of support is found near the 61.8% Fibonacci retracement level at approximately $253.51. If this level is breached, the next support could be around the 78.6% retracement level.

Resistance: The immediate resistance is at the 50% Fibonacci level, with further resistance possible at the 38.2% retracement and the middle Bollinger Band.

Conclusion and Consideration:

The BCHUSD pair on the H4 chart indicates a short-term bearish momentum with the potential for a bounce back due to the proximity to the lower Bollinger Band. Traders should consider the bearish MACD crossover but also be wary of a potential relief rally if the RSI indicates an oversold condition. Monitoring fundamental news in the crypto space, particularly regarding Bitcoin Cash, will be crucial. As the price approaches key Fibonacci levels, traders should employ risk management strategies and be prepared for possible volatility. It’s important to watch for a solid break below current support or a rebound to confirm the next directional move.

Disclaimer: The provided analysis is for informational purposes only and does not constitute investment advice. Traders should conduct their research and analysis before making any trading decisions.

BCH/USD Forecast — 12 January 2024

Time Zone: GMT +2

Time Frame: 4 Hours (H4)

Fundamental Analysis:

The BCHUSD pair reflects the relationship between Bitcoin Cash (BCH) and the US Dollar (USD). Key fundamental factors that could impact this cryptocurrency pair include regulatory developments, technological advancements within the Bitcoin Cash network, such as updates to the protocol, and macroeconomic data affecting the USD. Sentiment in the cryptocurrency market, particularly investor confidence in Bitcoin Cash’s scalability and transaction efficiency, along with broader economic trends, can significantly influence BCHUSD’s movements.

Price Action:

The H4 chart for BCHUSD shows a period of consolidation followed by a bullish breakout. The price exhibits higher highs and higher lows, indicating a bullish trend. The recent candles closing above the Ichimoku cloud suggest a strong upward momentum.

Key Technical Indicators:

Ichimoku Cloud: The price is above the Ichimoku cloud, indicating a bullish trend.

Parabolic SAR: The dots are placed below the candles, suggesting that the current trend is upward.

RSI (Relative Strength Index): The RSI is above 70, which typically signals overbought conditions, but it can also indicate strong bullish momentum.

MACD (Moving Average Convergence Divergence): The MACD line is above the signal line and the histogram is in the positive zone, reinforcing the bullish sentiment.

Support and Resistance:

Resistance: The resistance level could be identified at the highest recent price before the current bar, which seems to be in the vicinity of 272 – 275 USD.

Support: The support level seems to be where the price has touched the lowest point and reversed upwards, which visually appears to be around the 228 – 230 USD range.

Conclusion and Consideration:

The BCHUSD chart on the H4 timeframe indicates a bullish trend, with technical indicators supporting continued upward momentum. However, given the RSI is signaling potential overbought conditions, traders should be vigilant for signs of a reversal or pullback. It’s important to keep abreast of any fundamental news that could affect market sentiment. Risk management strategies should include setting stop losses below support levels and considering taking profits near potential resistance.

Disclaimer: This analysis does not constitute investment advice; it is provided for informational purposes only to

enhance traders’ knowledge. Trading decisions should be based on one’s own research and risk appetite.

BCH/USD Forecast — 18 December 2023

Time Zone: GMT +2

Time Frame: 4 Hours (H4)

Fundamental Analysis:

Bitcoin Cash (BCHUSD) mirrors the market dynamics between Bitcoin Cash (BCH) and the US Dollar (USD). Fundamental influencers include network updates, adoption rates, and regulatory shifts within the crypto space, particularly policies affecting Bitcoin Cash. Additionally, the USD’s strength, influenced by Federal Reserve policies and macroeconomic indicators such as inflation and employment data, can significantly impact BCHUSD’s value. The crypto market sentiment, driven by investor reactions to global economic events and technological advancements in blockchain, is also a critical factor to watch.

Price Action:

The H4 chart for BCHUSD displays a short-term downtrend, with the price moving below both the short-term and long-term moving averages. After a substantial rise, the price action has been characterized by increased volatility, with the formation of several large bearish candles indicating a potential reversal or correction in the uptrend.

Key Technical Indicators:

Parabolic SAR: The appearance of the last three dots above the candles suggests a bearish reversal, indicating a potential downtrend.

Moving Averages: The 9-period moving average crossing below the 17-period moving average while both lines trend downward is a bearish signal.

MACD: The MACD histogram is shortening towards the baseline, and the MACD line is close to crossing below the signal line, hinting at weakening bullish momentum.

Volumes: Trading volumes are showing fluctuation, with red bars indicating selling pressure which aligns with the bearish sentiment observed in the price action.

Support and Resistance:

Support: The immediate support level is at the most recent swing low, which could be around the $212 mark.

Resistance: The recent swing high forms a resistance level, potentially near the $250 area.

Conclusion and Consideration:

In conclusion, BCHUSD on the H4 timeframe suggests a bearish bias in the short term, as indicated by the Parabolic SAR, bearish crossover of moving averages, and potential MACD crossover. The downward price action supports this view. Traders should watch for a potential continuation of the downtrend, but also be mindful of the key support level, which if held, could indicate a reversal or consolidation. It’s essential to stay updated on fundamental developments that could affect investor sentiment and cause shifts in market dynamics. Risk management strategies such as stop-loss orders should be used to protect against unexpected market moves, particularly in the volatile cryptocurrency market.

Disclaimer: This analysis is for informational purposes only and does not constitute investment advice. Trading cryptocurrencies involves significant risk and can result in the loss of your invested capital. Always conduct your own research before making trading decisions.

BCH/USD Forecast — 16 November 2023

Time Zone: GMT +2

Time Frame: 4 Hours (H4)

Fundamental Analysis:

The BCHUSD pair denotes the exchange rate between Bitcoin Cash (BCH) and the US Dollar (USD). Fundamentals affecting this pair include Bitcoin Cash’s adoption rate, technological updates, and scalability solutions. Additionally, investor sentiment towards Bitcoin Cash as an alternative to Bitcoin, regulatory announcements regarding cryptocurrency, and economic indicators from the US, such as interest rate decisions and inflation figures, could significantly impact this trading pair. As the cryptocurrency market remains sensitive to regulatory and technological changes, staying informed on these aspects is crucial for traders.

Price Action:

The BCHUSD H4 chart shows a period of consolidation followed by a bullish breakout. The recent candles indicate a surge in buying pressure, pushing the price above previous consolidation zones. This suggests an uptrend with potential for continuation if the bullish sentiment persists.

Key Technical Indicators:

Bollinger Bands: The price has broken above the upper Bollinger Band, indicating a strong upward move that may be considered overextended in the short term.

RSI (Relative Strength Index): The RSI is trending upwards, currently above the 50 level, which indicates the momentum has shifted from neutral to bullish.

William’s Percentage Range: The indicator is near the -20 level, which often signifies overbought conditions; however, in strong trends, the price can remain in this territory for an extended period.

Support and Resistance:

Support: The previous consolidation range of around $225 acts as a support level.

Resistance: The next significant resistance level can be expected near the $250 mark, where the price has shown reactions in the past.

Conclusion and Consideration:

The BCHUSD chart on the H4 timeframe displays a bullish breakout from a consolidation phase, with indicators supporting the continuation of the uptrend. However, the proximity to overbought levels on both the Bollinger Bands and William’s Percentage Range suggests caution for potential pullbacks. Traders should watch for sustained trading above the upper Bollinger Band and for the RSI to remain above 50 to confirm bullish momentum, while also being mindful of key support and resistance levels for risk management.

Disclaimer: This analysis is for informational purposes only and should not be construed as investment advice. Traders should conduct their own research and consider their risk tolerance before trading.

1BCH = –––USD –––%
BCHUSD
Loading chart...