Time Zone: GMT +3
Time Frame: Daily (D1) / Weekly Outlook
Weekly Fundamental Overview:
The BTC/EUR market is influenced by broader risk sentiment and European macroeconomic conditions. As digital assets interact with liquidity expectations across global markets, shifts in fiat currency dynamics can impact trading activity for BTCEUR.
Price Action:
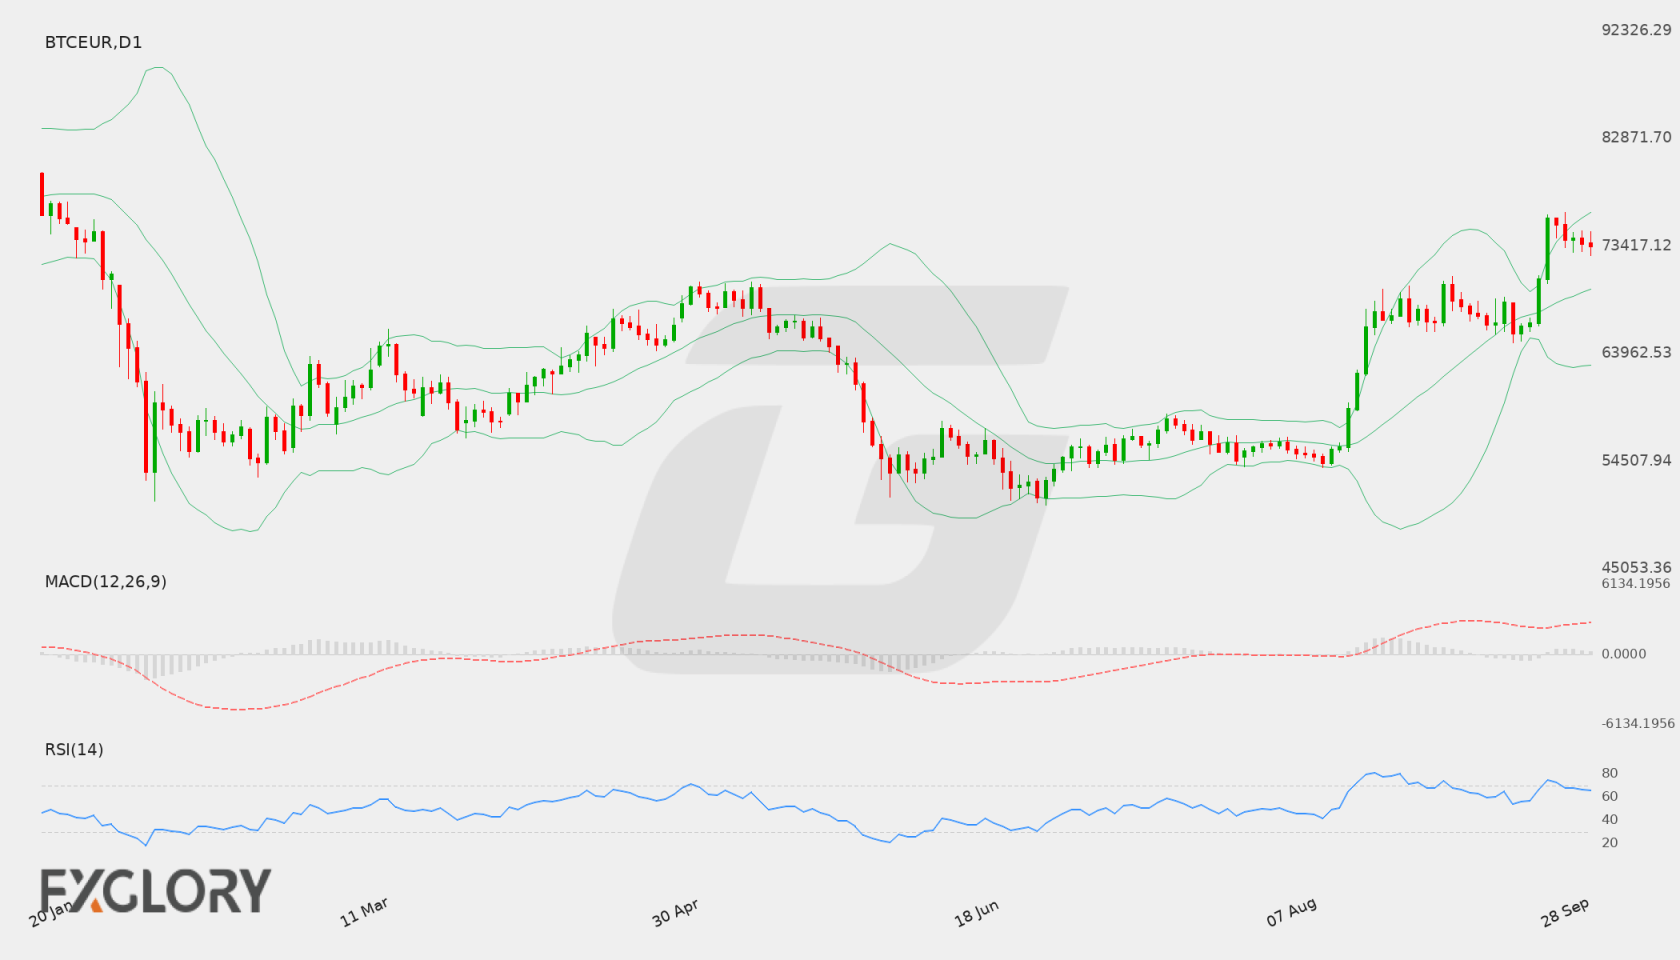
Daily analysis for BTC/EUR shows a strong multi-day advance from lower levels toward recent peaks near the 76329.61 resistance area. Following a peak above 75000, price action retraced slightly to register a daily close at 73420.21, reflecting a period of consolidation after strong buying interest.
Key Technical Indicators:
Bollinger Bands: On the daily chart, BTC/EUR is trading above its middle Bollinger band of 69617.89, holding within the upper half of the envelope toward the upper band at 76335.34. The lower band sits at 62900.45, outlining elevated volatility during the recent upside expansion.
RSI: The 14-period Daily RSI is currently at 65.35, remaining in bullish territory above the neutral 50 level. While indicating firm upward control, it sits near overbought conditions where temporary pauses or pullbacks frequently occur.
MACD: The D1 MACD value stands at 2997.43, operating well above the zero line. This indicates prevailing bullish momentum, although traders remain attentive to any signs of potential momentum deceleration following recent highs.
Support and Resistance:
Key daily technical levels for BTCEUR feature key resistance at 76329.61, representing the recent high boundaries. On the downside, primary technical support is situated at 53912.74.
News to Watch for BTCEUR This Week:
- German Prelim CPI m/m: German consumer price updates can alter euro market dynamics and shift risk sentiment, potentially impacting cryptocurrency liquidity.
Weekly Outlook and Consideration:
The daily timeframe indicates that BTC/EUR maintains a bullish structure supported by a positive MACD of 2997.43 and an RSI of 65.35. If price action breaks cleanly above resistance at 76329.61 toward the upper Bollinger band near 76335.34, further upside expansion could follow. Conversely, failure to sustain current levels may prompt a pullback toward the middle Bollinger band at 69617.89, with longer-term support established at 53912.74.
Disclaimer: The analysis provided for BTC/EUR is for informational purposes only and does not constitute investment advice. Traders are encouraged to perform their own analysis and research before making any trading decisions. Market conditions can change quickly, so staying informed with the latest data is essential.