EURGBP Forecast

EUR/GBP Live Price

0.86465
+0.07%

EUR/GBP Forecast — 22 May 2026

Time Zone: GMT +3

Time Frame: 4 Hours (H4)

Fundamental Analysis:

The EUR/GBP currency pair reflects the exchange rate between the Euro and the British Pound, and today’s EURGBP H4 technical and fundamental chart daily analysis remains sensitive to both Eurozone sentiment data and UK consumer-related releases. For the EUR, traders are watching German GDP, German consumer sentiment, German ifo business climate, ECOFIN/Eurogroup commentary, and Belgium business confidence, as these events can influence expectations around Eurozone growth and ECB policy direction. For the GBP, market attention is focused on UK consumer confidence, retail sales, and public sector borrowing, which can affect Bank of England rate expectations and broader Sterling sentiment. If Eurozone data comes in stronger than expected while UK data disappoints, EUR-GBP may find support; however, stronger UK retail sales or better fiscal/consumer figures could strengthen the Pound and add downside pressure to the EUR GBP H4 price action forecast.

Price Action:

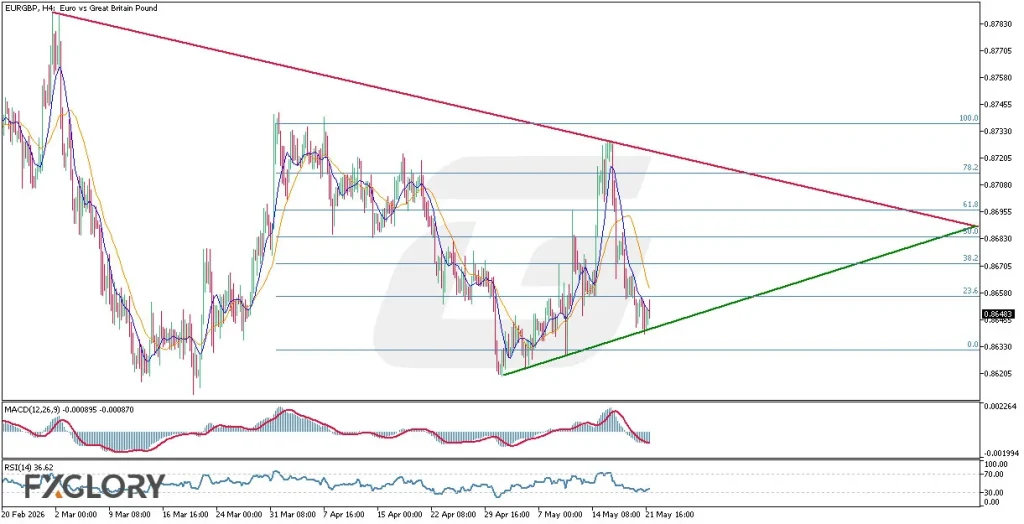
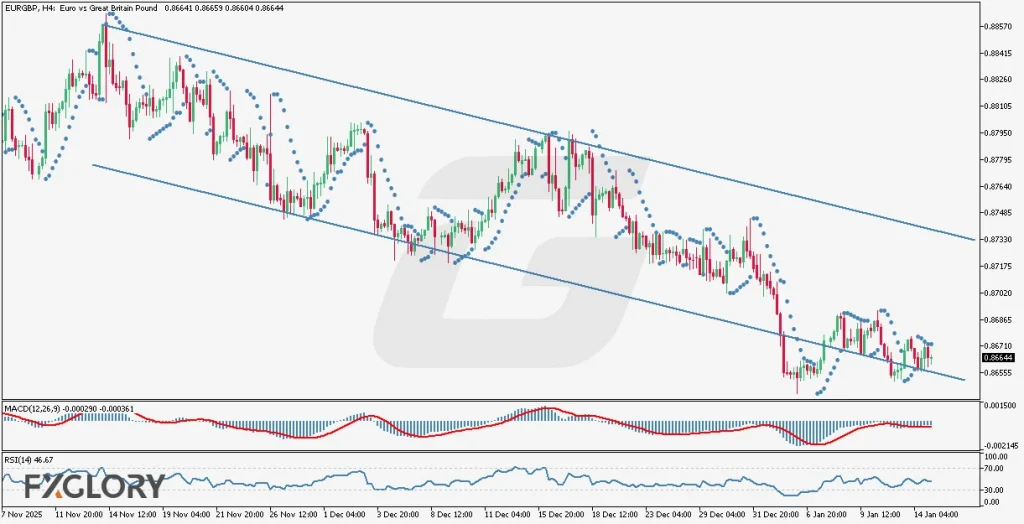
The EUR-GBP pair analysis in the H4 timeframe shows price compressing inside a symmetrical triangle/wedge pattern, with descending resistance marked by the red trendline and ascending support marked by the green trendline. The EUR/GBP price is currently trading near 0.8648, close to the rising trendline support area and below the 23.6% Fibonacci zone, suggesting that sellers remain active after the recent rejection from the upper Fibonacci resistance region. The latest candles show bearish momentum following the failed move near the upper side of the structure, while the market is now testing a critical breakout-or-rebound zone. A clean break below the ascending support could confirm a bearish continuation setup, while a strong bullish rejection from this level could trigger a recovery toward the 0.8683–0.8695 resistance area.

Key Technical Indicators:

Moving Averages (9,21): The MA9 line has crossed below the MA21 line, confirming short-term bearish momentum. As long as price stays below both moving averages, the EUR/GBP H4 technical bias remains cautious and bearish.

MACD (12,26,9): The MACD remains below the signal line with negative histogram bars, supporting the current downside momentum. A bullish crossover would be needed to confirm weakening selling pressure and a possible rebound.

RSI (14): The RSI(14) is around 36, showing bearish momentum but not yet oversold conditions. A move below 30 would confirm stronger downside pressure, while a rebound from this zone may support a short-term correction.

Support and Resistance:

Support: Immediate support is located near 0.8648, where the current price is testing the ascending green trendline; deeper downside support sits around 0.8633, near the 0.0% Fibonacci level and the recent swing-low zone.

Resistance: Immediate resistance is seen around 0.8683 at the 50% Fibonacci level, followed by 0.8695 at the 61.8% level and the upper triangle resistance zone near 0.8710–0.8733.

Conclusion and Consideration:

The EURGBP H4 chart forecast shows a tightening symmetrical triangle formation, suggesting that a breakout may be approaching. The current technical setup favors a cautious bearish bias because price is pressing against the rising support trendline, the MA9 has crossed below the MA21, MACD remains negative, and RSI is below the neutral 50 level. For today’s EUR GBP technical and fundamental daily analysis, traders should watch whether the pair holds above 0.8648–0.8633 support or breaks lower with confirmation. Fundamental volatility may increase around Eurozone business sentiment, German GDP-related data, UK retail sales, UK consumer confidence, and UK borrowing figures, so confirmation from price action is essential before entering any EURGBP trade setup.

Disclaimer: The analysis provided for EUR/GBP is for informational purposes only and does not constitute investment advice. Traders are encouraged to perform their own analysis and research before making any trading decisions on EURGBP. Market conditions can change quickly, so staying informed with the latest data is essential.

FXGLORY_WATERMARK_EURGBP H4 Technical and Fundamental Analysis for 05.22.2026

EUR/GBP Forecast — 14 May 2026

Time Zone: GMT +3

Time Frame: 4 Hours (H4)

Fundamental Analysis:

The EURGBP H4 technical and fundamental analysis is expected to remain sensitive to both Eurozone liquidity conditions and upcoming UK economic releases. For the Euro, French and German bank holidays related to Ascension Day may reduce market liquidity, potentially leading to irregular volatility and sharper price swings in the EURGBP price action. On the British Pound side, traders are closely monitoring RICS Housing data, GDP releases, Manufacturing Production, Industrial Production, Trade Balance, and speeches from BOE Chief Economist Huw Pill. Stronger UK economic data or hawkish BOE commentary could support GBP strength and increase bearish pressure on the pair. Overall, today’s EURGBP daily analysis suggests that lower Eurozone liquidity combined with UK macroeconomic expectations may create volatile trading conditions in the H4 timeframe.

Price Action:

The EURGBP H4 price action analysis shows that over the broader history of the chart, the candles have repeatedly found strong support near the 0.86196 level. However, despite these rebounds, each bullish recovery has formed lower highs, confirming the presence of sustained bearish pressure through the descending trendline. Price is now approaching a critical technical area where the bearish trendline converges with the horizontal support zone. This structure suggests increasing pressure on buyers, especially as the market continues failing to create stronger bullish breakouts. In this EURGBP H4 forecast, a confirmed breakdown below 0.86196 could trigger a stronger bearish continuation in line with the broader downtrend.

Key Technical Indicators:

Bollinger Bands (80): The candles are trading in the upper half of the Bollinger Bands while gradually moving toward the middle band. This suggests weakening bullish momentum and increasing probability of renewed bearish pressure.

MACD (12,26,9): The MACD values at 0.000481 and 0.000653 indicate that bearish momentum currently dominates the market. The signal line remaining above the MACD line reflects fading bullish attempts within the broader bearish structure.

Williams %R (14): The Williams %R reading at -50.67 reflects neutral market conditions. This indicates that the pair is neither overbought nor oversold, supporting the current consolidation near key support.

Support and Resistance:

Support: The key support level is located at 0.86196, where the candles have repeatedly found buying pressure throughout the recent market structure.

Resistance: The main resistance is positioned near 0.86705, aligning with the descending trendline that continues to cap bullish recoveries.

Conclusion and Consideration:

The overall EURGBP H4 chart daily analysis continues to favor a bearish outlook as the pair remains trapped beneath a descending resistance trendline while repeatedly testing the major support at 0.86196. Current EURGBP price action reflects weakening bullish momentum, with the formation of lower highs reinforcing the broader bearish structure. Technical indicators such as MACD and Bollinger Bands support the possibility of renewed downside pressure if support eventually fails. At the same time, low liquidity conditions due to Eurozone bank holidays may temporarily increase volatility and produce irregular price movements. Fundamentally, upcoming UK economic data and BOE commentary could become the main catalysts that determine whether the pair breaks lower or temporarily rebounds from support.

Disclaimer: The analysis provided for EUR/GBP is for informational purposes only and does not constitute investment advice. Traders are encouraged to perform their own analysis and research before making any trading decisions on EURGBP. Market conditions can change quickly, so staying informed with the latest data is essential.

EURGBP-H4-Technical-and-Fundamental-Analysis-for-05.14.2026

EUR/GBP Forecast — 22 April 2026

Time Zone: GMT +3

Time Frame: 4 Hours (H4)

Fundamental Analysis:

The EURGBP H4 technical and fundamental analysis today is shaped mainly by the relative importance of upcoming UK inflation data and Bank of England commentary, while the euro side appears comparatively lighter in the provided calendar. For GBP, traders are looking ahead to the next releases for UK CPI, Core CPI, PPI input, PPI output, RPI, and HPI, all of which are highly relevant for interest rate expectations because stronger inflation readings usually support a more hawkish Bank of England stance and can strengthen sterling. In addition, BOE Deputy Governor Sarah Breeden’s scheduled public remarks may offer policy clues, which can create event-driven volatility for the pound if her tone is more hawkish or more cautious than expected. As a result, this EURGBP daily analysis, EURGBP H4 forecast, and EURGBP price action analysis suggest that sterling-sensitive macro expectations may keep downside pressure on the pair if UK inflation and policy guidance continue to favor GBP resilience over EUR.

Price Action:

The EURGBP H4 chart analysis shows the pair moving inside a bearish channel with a shallow downward slope, confirming that the broader short-term trend still leans negative even though the declines are not overly aggressive. Every time price has reached a local low, buyers have managed to produce a corrective rebound, but the bearish leg has repeatedly returned with stronger momentum, which is a sign of persistent selling pressure. At the moment, the candles are trading around the mid-line area of the bearish channel, reflecting hesitation and short-term consolidation rather than a confirmed reversal. From a price action EURGBP H4 perspective, the most likely scenario remains a push lower toward the channel support before another correction phase develops, unless buyers manage to invalidate the structure with a sustained move above the upper channel boundary.

Key Technical Indicators:

Parabolic SAR: The dots are currently above the candles, confirming that the short-term EURGBP H4 technical analysis remains bearish. This keeps the immediate trend biased to the downside unless price breaks higher and flips the indicator.

MACD (12,26,9): The MACD (-0.000145 / 0.000101) reflects mild negative momentum, supporting the current bearish structure in this EURGBP H4 forecast. Momentum is not strong, but it still favors sellers while price remains inside the descending channel.

Williams %R (14): The Williams %R at -96.43 shows the pair is in a deeply oversold zone on the H4 chart. That supports the bearish trend overall, while also warning that a short corrective rebound may happen before the next move lower.

Support and Resistance:

Support: Immediate support is seen around 0.8690, with stronger support near 0.8670 at the lower boundary of the bearish channel.

Resistance: Nearest resistance stands around 0.8708–0.8720, while stronger resistance is located near 0.8735 close to the upper channel boundary.

Conclusion and Consideration:

The EURGBP H4 technical and fundamental chart analysis continues to favor a cautious bearish outlook, with the pair still respecting a shallow descending channel and trading below a structure that keeps sellers in control. The Parabolic SAR confirms the negative trend bias, the MACD shows lingering bearish momentum, and Williams %R highlights that the market is oversold enough to allow temporary rebounds during the broader decline. From both a technical analysis EURGBP daily outlook and a fundamental analysis EURGBP today perspective, the pair may remain vulnerable to fresh downside pressure, especially if upcoming UK inflation-related themes reinforce GBP strength. Traders should nevertheless watch for corrective recoveries from support, as the oversold reading increases the chance of short-term bounces before the next directional move.

Disclaimer: The analysis provided for EUR/GBP is for informational purposes only and does not constitute investment advice. Traders are encouraged to perform their own analysis and research before making any trading decisions on EURGBP. Market conditions can change quickly, so staying informed with the latest data is essential.

EURGBP-H4-Technical-and-Fundamental-Analysis-for-04.22.2026

EUR/GBP Forecast — 20 March 2026

Time Zone: GMT +2

Time Frame: 4 Hours (H4)

Fundamental Analysis:

The EURGBP H4 fundamental analysis is currently shaped by the relative balance between Eurozone inflation and external-sector signals versus UK fiscal and manufacturing expectations. On the GBP side, traders will be focused on the UK public sector finances release and the CBI Industrial Trends Orders data, as softer borrowing figures and stronger manufacturing order expectations would typically be supportive for the British Pound. On the EUR side, German Producer Price Index data, Eurozone current account and trade balance figures, Italy’s trade balance, and comments from Bundesbank President Joachim Nagel could influence Euro sentiment, especially if inflation-related data surprise to the upside or ECB rhetoric turns more hawkish. For today’s EURGBP technical and fundamental chart daily analysis, stronger GBP data could add pressure on EUR/GBP and reinforce the bearish H4 setup, while supportive EUR figures or hawkish ECB commentary may temporarily slow the downside without necessarily reversing the broader bearish structure.

Price Action:

The EURGBP price action on the H4 chart shows that the pair had been moving within a well-defined bearish channel before reaching the key support area around 0.86167, where buyers managed to trigger a rebound. That bullish correction, however, remained limited and failed to produce a sustainable trend reversal, as sellers quickly regained control and pushed the candles lower again. Price has repeatedly tested the same support zone without delivering a convincing bullish continuation, which is often a sign that the floor is weakening under persistent bearish pressure. In this EURGBP H4 price action analysis, the repeated return toward 0.86167 suggests that a downside breakout remains a realistic scenario, and if that support finally gives way, the pair could resume its broader bearish trend and continue traveling lower within the prevailing channel structure.

Key Technical Indicators:

Bollinger Bands (80): The Bollinger Bands have narrowed, indicating lower volatility and a possible strong move ahead. Since price remains near the lower half, the breakout risk still favors the bearish side.

MACD (12,26,9): The MACD remains in negative territory at -0.000327 and -0.000156, reflecting ongoing bearish momentum. This suggests sellers still have the upper hand unless momentum shifts upward.

Williams %R (14): Williams %R at -68.37 shows bearish pressure is still present without the pair being deeply oversold. This leaves room for another retest of support.

Support and Resistance:

Support: The key support stands at 0.86167, a major level that has held price more than once. A break below it could open the way for further downside continuation.

Resistance: The nearest resistance is at 0.86350, followed by 0.86570. These levels may cap any short-term bullish correction.

Conclusion and Consideration:

This EURGBP H4 technical analysis points to a market that remains under bearish pressure despite its temporary defense of the 0.86167 support zone. The price action structure, repeated support testing, Bollinger Band compression, negative MACD positioning, and weak Williams %R reading all suggest that the downside risk is still elevated. From a EURGBP daily analysis and forex forecast perspective, a clean break below support would likely confirm continuation of the previous bearish channel move, while only a sustained recovery above nearby resistance could delay that scenario. Traders should also keep an eye on today’s EUR and GBP macro drivers, because any surprise in UK data or ECB-related sentiment could act as the catalyst for the next volatility expansion.

Disclaimer: The analysis provided for EUR/GBP is for informational purposes only and does not constitute investment advice. Traders are encouraged to perform their own analysis and research before making any trading decisions on EURGBP. Market conditions can change quickly, so staying informed with the latest data is essential.

EURGBP_H4_Technical_and_Fundamental_Analysis_For_03.20.2026

EUR/GBP Forecast — 15 January 2026

Time Zone: GMT +2

Time Frame: 4 Hours (H4)

Fundamental Analysis:

The EURGBP currency pair, representing the exchange rate between the Euro and the British Pound, is currently influenced by divergent economic signals from the Eurozone and the UK. Today, market participants are closely monitoring the ECB Economic Bulletin, which has highlighted concerns regarding geopolitical risks and potential trade fragmentation impacting Eurozone exports. Conversely, the British Pound is under the spotlight following the release of the RICS House Price Balance, a leading indicator of housing inflation. While the broader outlook for the Eurozone suggests a stabilization of inflation at the 2% target, the GBP remains sensitive to upcoming monthly GDP data and manufacturing production reports. This fundamental backdrop suggests a cautious market environment where traders are weighing the Euro’s resilience against the UK’s economic health indicators.

Price Action:

The EURGBP chart has experienced periods of bullish and bearish trends over its historical record, but it is currently traversing a clear bearish channel on the H4 timeframe. Over the past several weeks, the price action has been characterized by lower highs and lower lows, respecting the boundaries of the descending corridor while forming a couple of breakout failures at the lower support line. At present, the candles are in a bullish correction phase near the channel’s lower boundary, attempting to recover from a recent dip below the 0.8655 level. Despite the prevailing bearish momentum, we could expect the price to rally as high as the mid-line of the channel (near 0.8686) before encountering renewed selling pressure and continuing its primary bearish move.

Key Technical Indicators:

Parabolic SAR: The dots remain positioned above the candles, confirming a sustained bearish trend and downward pressure on the EURGBP H4 chart. While the gap is narrowing during the current correction, a reversal signal would only occur if the dots flip below the price action.

MACD (12, 26, 9): Currently reading -0.000290 with a signal line at -0.000361, the MACD shows a bullish crossover in negative territory. The rising histogram indicates decelerating bearish momentum, supporting a short-term price recovery toward the channel’s mid-line.

RSI (14): The index sits at 46.67, maintaining a neutral stance while hovering just below the 50-level pivot. This suggests that the bearish bias is still intact, though the recent upward slope confirms the pair is not yet in oversold conditions.

Support and Resistance:

Resistance: The immediate resistance level is identified at 0.8710, aligning with previous swing highs and the upper boundary of the descending channel.

Support: Primary support is established at 0.8645, which has recently acted as a floor for the price and represents a significant psychological level.

Conclusion and Consideration:

The EURGBP H4 forecast suggests that while a minor bullish correction is underway, the broader structure remains firmly bearish within the established descending channel. The MACD crossover and RSI recovery provide a short-term bullish signal for a move toward the 0.8680 region, but the Parabolic SAR maintains a long-term sell bias. Traders should remain vigilant of the upcoming UK GDP and industrial production data, as these high-impact releases could trigger significant volatility. Until a definitive breakout above the channel resistance occurs, the “sell-on-rallies” strategy appears most aligned with the current technical setup.

Disclaimer: The analysis provided for EUR/GBP is for informational purposes only and does not constitute investment advice. Traders are encouraged to perform their own analysis and research before making any trading decisions on EURGBP. Market conditions can change quickly, so staying informed with the latest data is essential.

EURGBP H4 Technical and Fundamental Analysis for 01.15.2026

1EUR = –––GBP –––%
EURGBP
Loading chart...