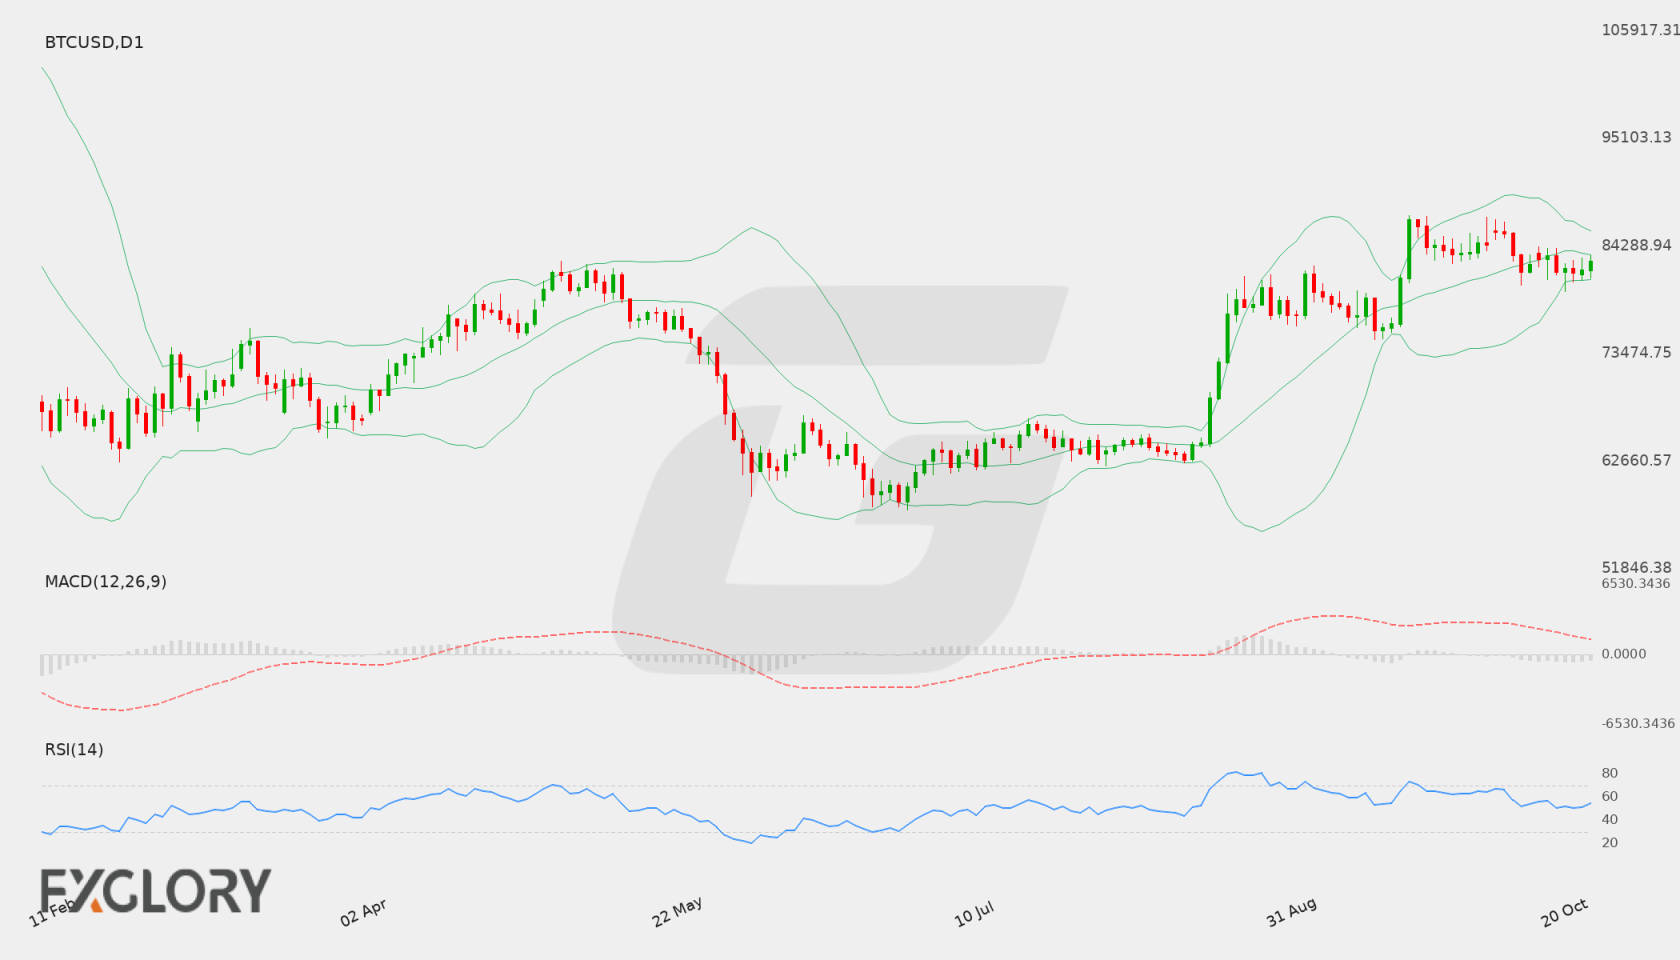
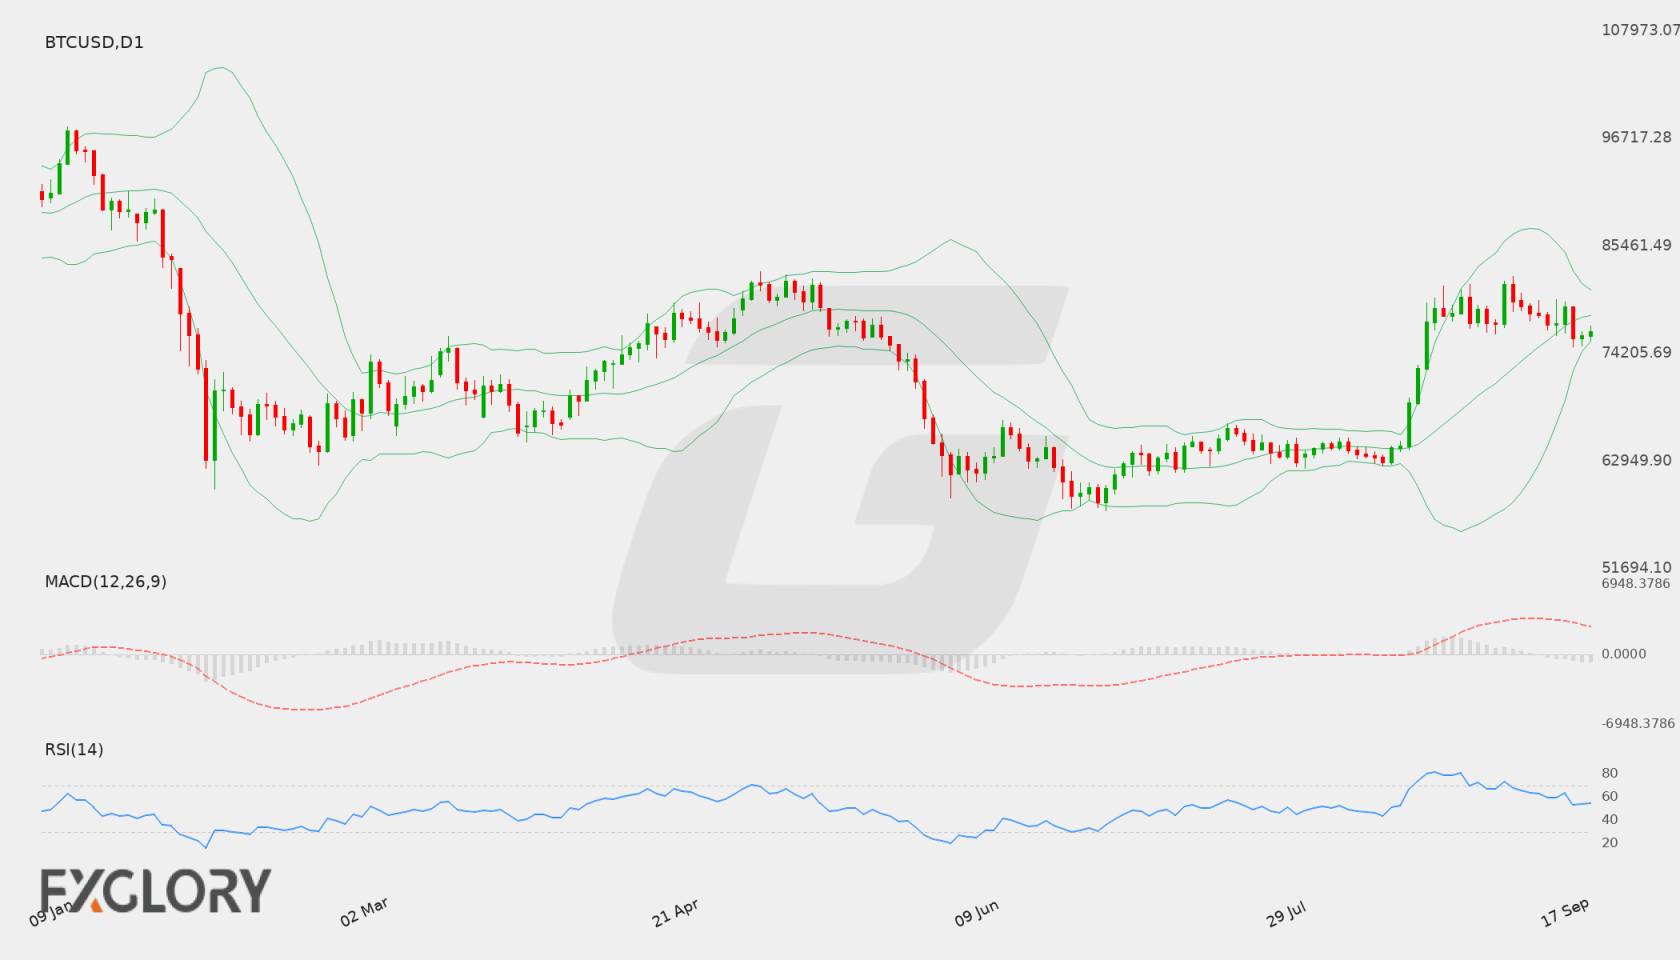
Current weekly forecast: This outlook covers 18–24 October 2026 and remains valid until 24 October 2026, unless its stated invalidation condition is triggered earlier.
Daily check — 21 October 2026: The latest completed D1 close was 82721.50000 on 20 October 2026. It remains above the lower formal invalidation level 76166.96000; the upper calibrated boundary 87356.03000 is an extension/confirmation boundary. The authored weekly thesis remains valid.
In brief
BTCUSD retains a bullish weekly bias, although mixed D1 momentum and bearish H4 conditions leave the path toward higher resistance levels conditional.
The weekly thesis is led by a bullish D1 trend state. The 81993.11 D1 close is above the EMA50 at 78555.04718 and the SMA200 at 73175.10675, while the EMA50 slope is rising. That structure supports a constructive directional framework, but the mixed D1 close sequence means the trend is not advancing with uniform price-action confirmation.
Momentum and tactical conditions temper the D1 signal. D1 MACD remains below its signal line and the histogram is negative, while H4 is bearish with a 81305.3 close below its EMA20 and EMA50. A move through 83752.501 would bring the higher resistance references at 85221.54 and 86826.38184 into focus, whereas weakness through 80299.45 would expose the lower references at 78676.51 and 76848.87.
BTC/USD D1 technical-analysis context for the weekly forecast. Chart data captured 21 October 2026.
BTC/USD has a bullish weekly bias, supported by D1 structure, but mixed momentum and bearish H4 conditions argue for conditional rather than immediate continuation.
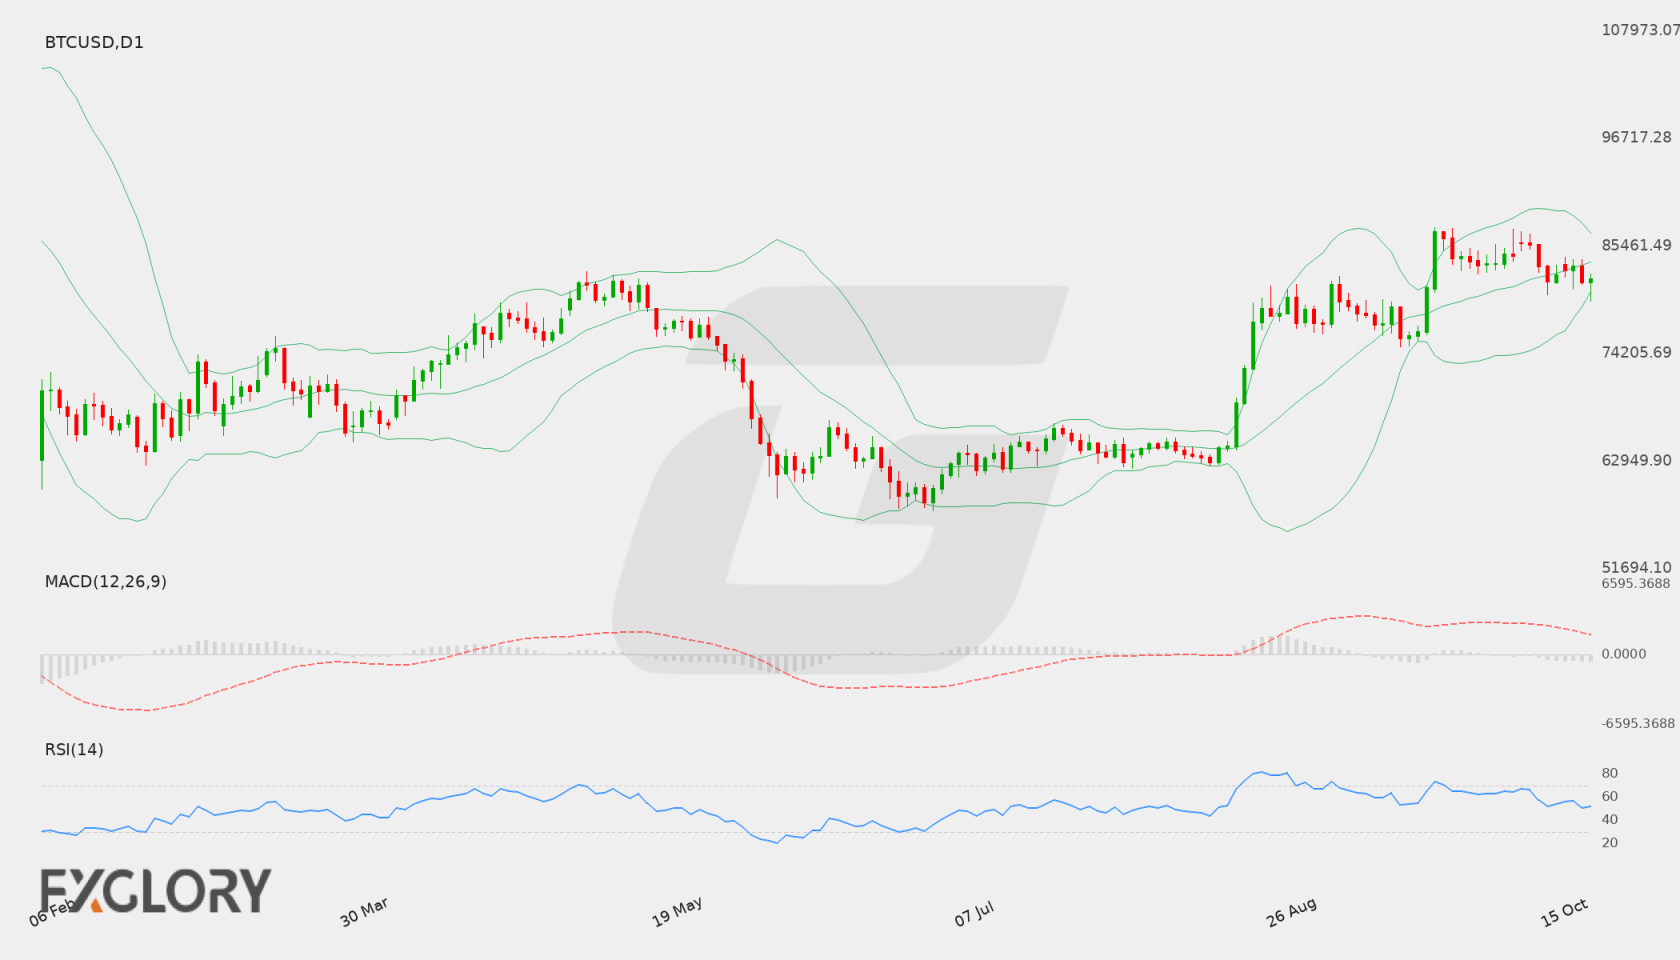
The weekly thesis remains constructive because the D1 trend state is bullish, the EMA50 slope is rising, and the reference close at 81723.11 is above the 77692.18077 EMA50 value and the 73410.5653 SMA200 value. That structural backdrop is supportive, but the D1 close sequence is mixed and the close remains below the 82291.14587 EMA20 value, so the trend is not being confirmed uniformly across the available D1 evidence.
The tactical picture is less supportive: H4 is bearish, with its 82651.48 close below the 83120.07504 EMA20 and 83661.46985 EMA50 values, while H4 momentum is negative. A move through 87356.03 would improve the upside structure toward 89260.47737; movement below 79197.05 would increase the relevance of 77692.18077 and 76200.34 as bearish alternatives.
BTC/USD D1 technical-analysis context for the weekly forecast. Chart data captured 16 October 2026.
BTC/USD (BTCUSD) continues to trade in an elevated zone following substantial upward expansion, with market participants closely monitoring liquidity and macroeconomic conditions. Upcoming economic releases from the United States, alongside central bank policy perspectives and overarching risk appetite, remain key drivers for digital asset sentiment.
Price Action:
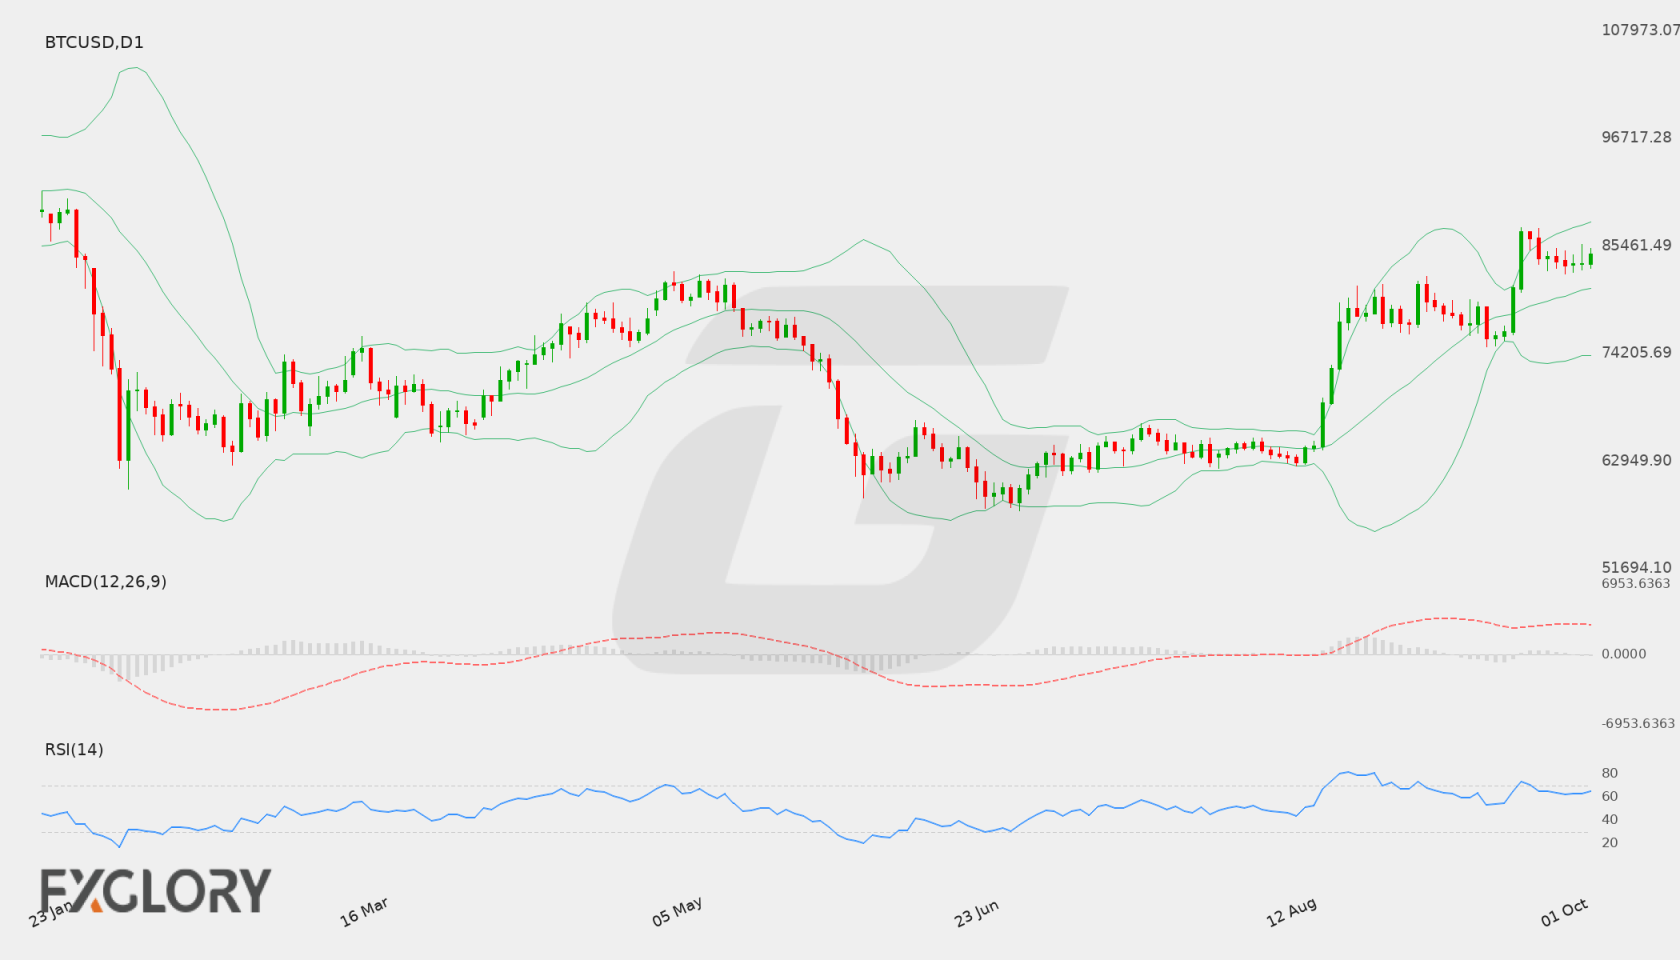
On the Daily (D1) chart, BTC/USD recently pushed to a peak near 87356.03 before settling into a consolidation range. The pair closed the latest session at 84579.26, maintaining its structure above recent swing bases while absorbing selling pressure within the 83476.51 to 85207.37 area.
Key Technical Indicators:
Bollinger Bands: BTC/USD is trading between the middle band at 80973.24 and the upper band at 87998.29, with the lower band located at 73948.20. The current price of 84579.26 reflects bullish positioning within the upper half of the Bollinger envelope as volatility remains expanded.
RSI: The 14-day RSI for BTC/USD sits at 64.72, reflecting constructive bullish momentum while remaining beneath the standard overbought threshold of 70.
MACD: The Daily MACD for BTC/USD registers a positive value of 2820.63, indicating that underlying upward momentum remains intact, though traders continue to watch for potential convergence after the recent surge.
Support and Resistance:
Technical resistance is defined at 87356.03, which marks the recent ceiling. Primary technical support is established at 61731.77.
News to Watch for BTCUSD This Week:
ISM Services PMI: Shifts in services sector performance can influence US dollar dynamics and broader risk appetite across digital assets.
FOMC Meeting Minutes: Insights into monetary policy discussions may impact liquidity expectations and market volatility.
Unemployment Claims: Data on labor market conditions can alter interest rate sentiment across dollar-denominated assets.
Prelim UoM Inflation Expectations: Gauges consumer inflation outlooks that could shape monetary policy anticipation.
Prelim UoM Consumer Sentiment: Reflects consumer confidence levels that may affect speculative market flows.
Weekly Outlook and Consideration:
BTC/USD (BTCUSD) enters the week in a technically positive posture, closing at 84579.26 above its Bollinger middle band of 80973.24. With the RSI at 64.72 and MACD at 2820.63, momentum remains supportive of buyers. A push higher would bring resistance at 87356.03 into focus, while a reversal would lead to tests of the middle band ahead of broader support at 61731.77. Price behavior will likely be influenced by key US economic updates and prevailing risk sentiment.
Disclaimer: The analysis provided for BTC/USD is for informational purposes only and does not constitute investment advice. Traders are encouraged to perform their own analysis and research before making any trading decisions. Market conditions can change quickly, so staying informed with the latest data is essential.
BTC/USD continues to be driven by shifts in global macroeconomic sentiment and broader demand for digital assets. Interest rate expectations in the United States and global liquidity conditions remain influential drivers for cryptocurrency market valuation. Traders will monitor upcoming US economic indicators to gauge overall risk sentiment.
Price Action:
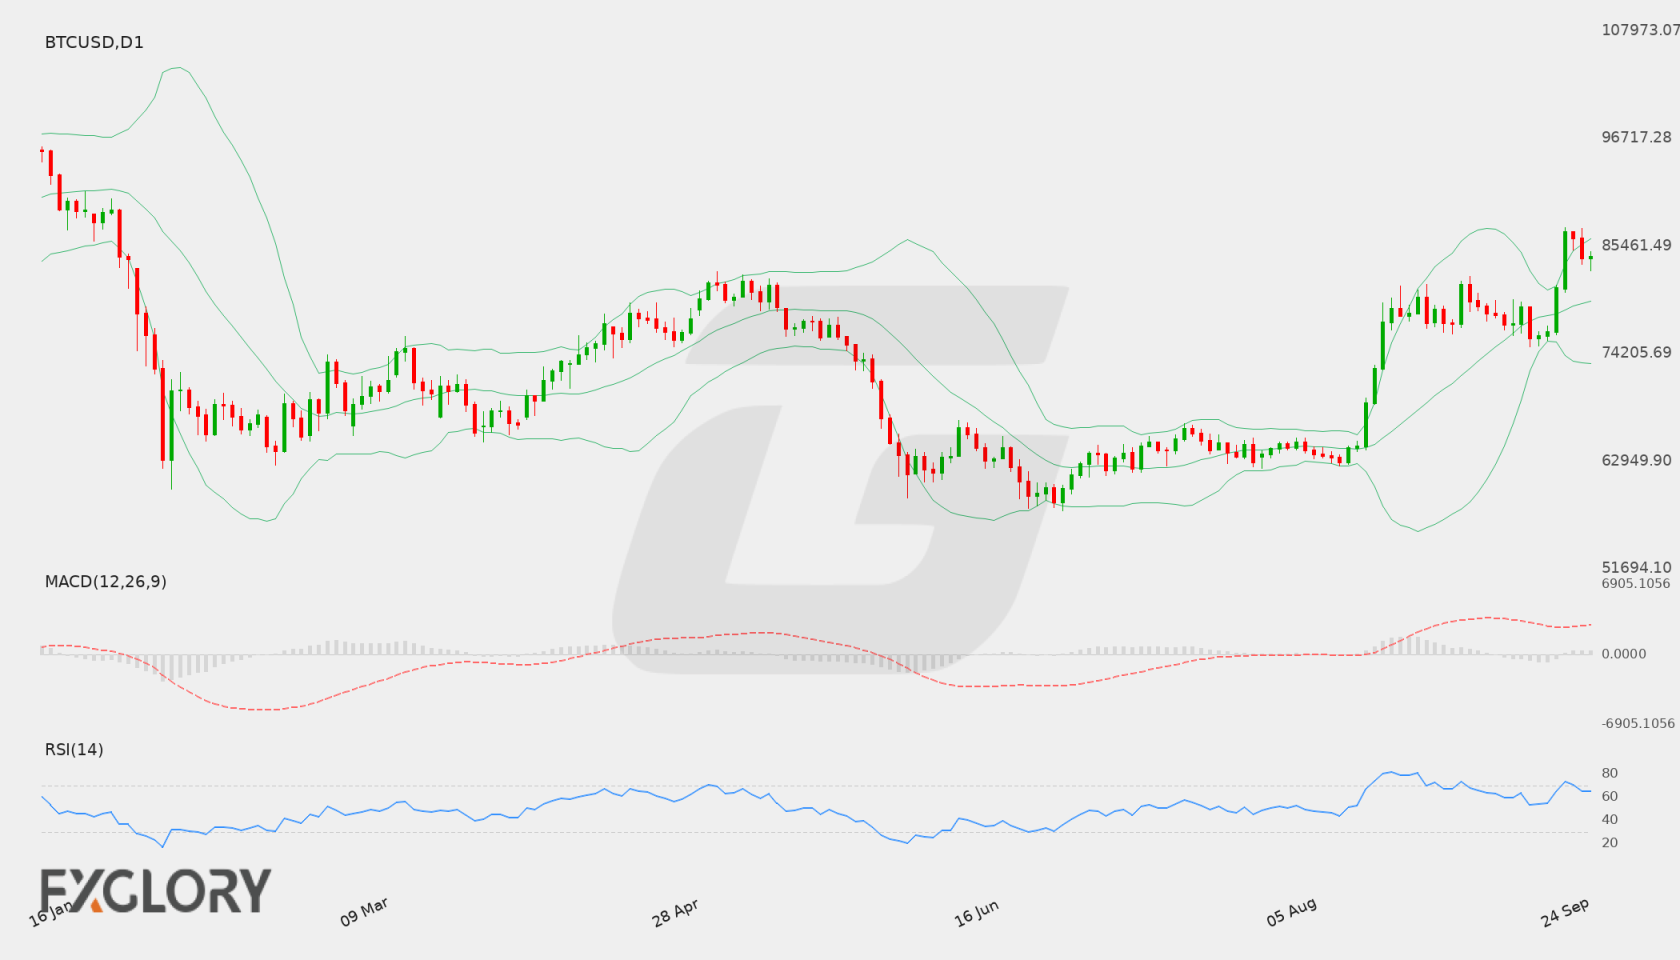
On the daily chart, BTC/USD recently pushed higher toward resistance at 87356.03 before settling around the last close of 84327.46. The pair has demonstrated strong upward momentum over recent daily sessions, keeping price action positioned firmly in positive territory.
Key Technical Indicators:
Bollinger Bands: The daily Bollinger Bands show the middle band at 79639.25, with the upper band at 86179.43 and lower band at 73099.07. Trading at 84327.46 places BTC/USD in the upper half of the band structure, reflecting heightened buying pressure.
RSI: The 14-period Relative Strength Index (RSI) is recorded at 64.97, indicating healthy bullish sentiment without crossing into deeply overbought territory above 70.
MACD: The MACD indicator stands at 3223.67, remaining in positive territory and signaling ongoing bullish momentum on the D1 timeframe.
Support and Resistance:
Key resistance is located at 87356.03, representing the recent peak. On the downside, primary technical support is identified at 61140.27.
News to Watch for BTCUSD This Week:
ISM Manufacturing PMI: This release provides insight into US economic activity and potential shifts in broader risk sentiment.
ISM Manufacturing Prices: This indicator measures inflationary pressures within the manufacturing sector that could impact market liquidity.
Weekly Outlook and Consideration:
The weekly technical setup for BTC/USD shows strong upward bias supported by a positive MACD of 3223.67 and an RSI of 64.97. With the last close at 84327.46, sustained momentum could lead to a retest of resistance near 87356.03. Conversely, if profit-taking emerges or macroeconomic conditions weigh on risk assets, price action may retreat toward the middle Bollinger Band near 79639.25 or further down toward main support at 61140.27.
Disclaimer: The analysis provided for BTC/USD is for informational purposes only and does not constitute investment advice. Traders are encouraged to perform their own analysis and research before making any trading decisions. Market conditions can change quickly, so staying informed with the latest data is essential.
The BTC/USD pair continues to be driven by broader macroeconomic trends and shifting risk sentiment. Shifts in capital flows and upcoming high-impact economic data releases, including key employment and inflation metrics, may influence liquidity and risk appetite across digital asset markets.
Price Action:
On the D1 timeframe, BTC/USD recently closed at 76,473.90 after reflecting moderate fluctuations between recent high levels near 82,247.41 and lower support zones. Price action demonstrates consolidated behavior as market participants evaluate direction near current trading levels.
Key Technical Indicators:
Bollinger Bands: The D1 Bollinger Bands indicate a middle band at 78,150.09, an upper band at 80,847.79, and a lower band at 75,452.38. With the latest close at 76,473.90 positioned between the middle and lower bands, the indicator reflects mild short-term consolidation.
RSI: The 14-day Relative Strength Index (RSI) is recorded at 54.61. Remaining slightly above the neutral 50 line, the RSI suggests balanced market momentum without entering overbought or oversold territory.
MACD: The D1 MACD indicator currently stands at 1,977.32, remaining in positive territory. This reading indicates ongoing bullish baseline momentum, though the indicator reflects signs of potential market consolidation.
Support and Resistance:
Based on recent daily price data, primary technical levels for BTC/USD include key support at 57,702.72 and resistance at 82,247.41.
News to Watch for BTCUSD This Week:
CB Consumer Confidence: Measures consumer sentiment which can influence overall market risk appetite.
JOLTS Job Openings: Indicates labor market demand and potential shifts in broad economic conditions.
Unemployment Rate: Measures labor force status impacting overall market confidence.
Weekly Outlook and Consideration:
BTC/USD enters the week trading around 76,473.90, constrained by D1 support at 57,702.72 and resistance at 82,247.41. Indicator readings remain moderate, with an RSI of 54.61 and a MACD value of 1,977.32, while price sits close to the D1 Bollinger middle band of 78,150.09. Market dynamics will depend heavily on upcoming macroeconomic data releases and evolving risk sentiment, which may determine whether price tests upper technical boundaries or consolidates near lower support zones.
Disclaimer: The analysis provided for BTC/USD is for informational purposes only and does not constitute investment advice. Traders are encouraged to perform their own analysis and research before making any trading decisions. Market conditions can change quickly, so staying informed with the latest data is essential.