
ETHUSD Forecast

ETH/USD Live Price

2436.86000
+5.00%

ETH/USD Forecast — 22 August 2026

Time Zone: GMT +3

Time Frame: Daily (D1) / Weekly Outlook

Weekly Fundamental Overview:

ETH/USD (ETHUSD) remains sensitive to broader market liquidity conditions, investor risk appetite, and macroeconomic trends originating from the United States. Key economic data releases can influence shift in sentiment across traditional financial markets and digital asset markets alike.

Price Action:

On the daily (D1) chart, ETH/USD (ETHUSD) has demonstrated significant upward momentum, advancing from recent low consolidation zones to close at 2315.9. The recent price expansion pushed the pair toward a high near the resistance level at 2356.51.

Key Technical Indicators:

Bollinger Bands: The Bollinger Bands reflect high market volatility on the daily timeframe. With the middle band positioned at 1928.90, the upper band at 2159.93, and the lower band at 1697.86, ETH/USD is currently trading above the upper band at 2315.9, signaling strong short-term bullish momentum.

RSI: The 14-period Relative Strength Index (RSI) stands at 80.57. This places ETH/USD (ETHUSD) in overbought territory, pointing to intense buying pressure while also warning of potential short-term exhaustion or consolidation.

MACD: The MACD indicator is currently reading 68.67, residing well above the zero line. This positive value highlights sustained bullish momentum and ongoing buyer dominance in recent daily trading sessions.

Support and Resistance:

Technical analysis places immediate resistance for ETH/USD at 2356.51. On the downside, critical long-term support is identified at 1508.09, with additional technical reference zones located near the Bollinger middle band at 1928.90.

News to Watch for ETHUSD This Week:

  • CB Consumer Confidence: Shifts in consumer sentiment can impact overall market risk appetite and speculative demand.
  • Core PCE Price Index m/m: As a key inflation metric for monetary policy, this release can alter market liquidity expectations.
  • Prelim GDP q/q: Updated economic growth data provides insight into macroeconomic health and general market sentiment.
  • Prelim GDP Price Index q/q: Inflationary measures within GDP reports influence expectations around monetary policy and asset pricing.
  • Unemployment Claims: Weekly jobless numbers offer a real-time check on economic labor stability and risk appetite.
  • Prelim Benchmark Payrolls Revision: Major employment benchmark revisions can trigger broader market adjustments across risk assets.

Weekly Outlook and Consideration:

ETH/USD (ETHUSD) enters the week in a strong technical posture after reaching a close of 2315.9. However, with the RSI elevated at 80.57 and the price holding above the upper Bollinger Band of 2159.93, the pair faces overbought conditions that could lead to price consolidation or a pull-back. Key resistance at 2356.51 will remain a critical pivot, while incoming US macroeconomic data could significantly affect risk sentiment across the market.

Disclaimer: The analysis provided for ETH/USD is for informational purposes only and does not constitute investment advice. Traders are encouraged to perform their own analysis and research before making any trading decisions. Market conditions can change quickly, so staying informed with the latest data is essential.
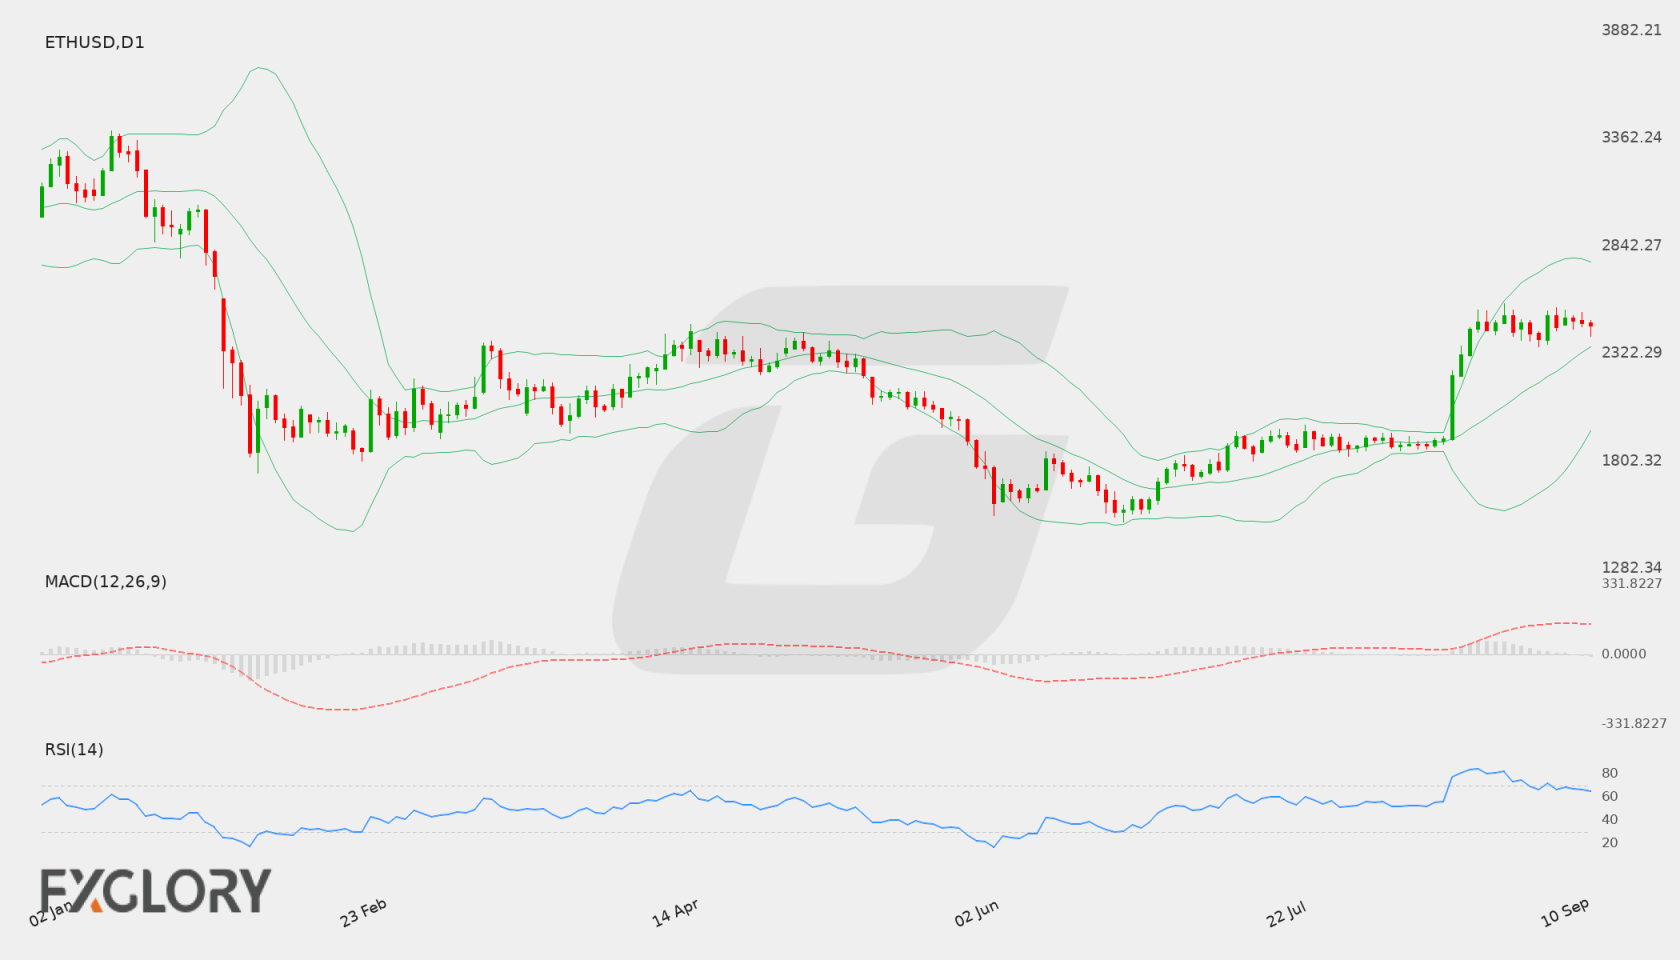
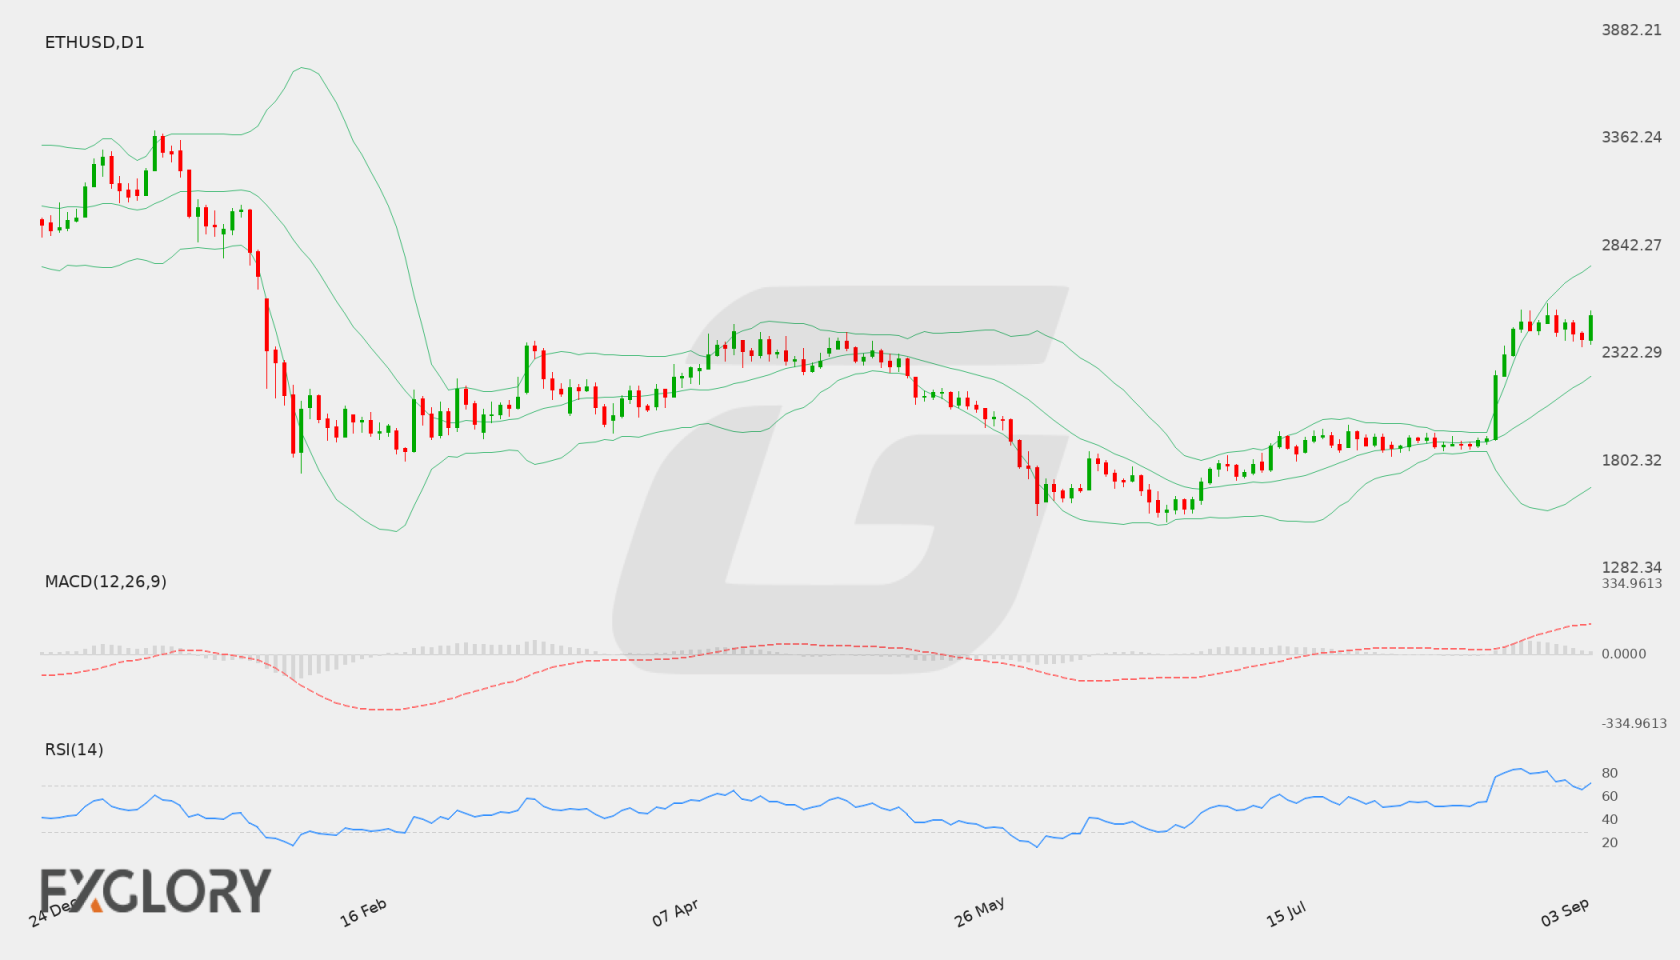
ETH/USD D1 technical analysis chart
ETH/USD D1 Technical Analysis for 08.22.2026

ETH/USD Forecast — 15 August 2026

Time Zone: GMT +3

Time Frame: Daily (D1) / Weekly Outlook

Weekly Fundamental Overview:

ETH/USD market dynamics remain tied to general market risk sentiment and broader macroeconomic trends driven by incoming U.S. economic data. Major economic updates and central bank publications could influence market volatility, dollar momentum, and risk appetite across digital assets like ETHUSD.

Price Action:

On the daily (D1) chart, ETH/USD recorded a recent close at 1882.42. Price action shows trading within a defined range following recent fluctuations between high points near 1942.87 and lows near 1824.93, reflecting a period of consolidation.

Key Technical Indicators:

Bollinger Bands: ETH/USD is currently positioned near the middle Bollinger Band at 1891.24. The upper Bollinger Band is situated at 1943.41, while the lower Bollinger Band sits at 1839.06, pointing to a compressed volatility environment across daily sessions.

RSI: The 14-day RSI is currently at 52.29, positioning ETHUSD in neutral territory above the 50 mark. This indicates a balanced market without immediate overbought or oversold extremes.

MACD: The MACD indicator for ETH/USD currently stands at 18.04. This positive value reflects underlying bullish momentum, although traders continue to observe signal line movements for indications of potential momentum shifts.

Support and Resistance:

Key technical levels for ETH/USD highlight primary daily resistance at 2137.87 and main support at 1508.09.

News to Watch for ETHUSD This Week:

  • Prelim Benchmark Payrolls Revision: Revisions to historical labor data can alter expectations regarding broad economic strength and interest rate paths.
  • FOMC Meeting Minutes: Insights into central bank discussions provide clarity on future monetary policy direction and broad market liquidity.
  • Unemployment Claims: Weekly jobless data offers an updated view on labor market conditions that can influence risk appetite.
  • Philly Fed Manufacturing Index: Regional business conditions serve as a measure of economic health and inflationary pressures.
  • Flash Manufacturing PMI: Preliminary purchasing managers data offers early signals regarding broader economic growth trends.

Weekly Outlook and Consideration:

ETH/USD enters the week with neutral technical indicators, as price remains bounded near the middle Bollinger Band at 1891.24 and the RSI stands at 52.29. Main support at 1508.09 and upper resistance at 2137.87 mark the key boundaries for potential directional expansion. Market participants will monitor incoming economic reports closely, as shift in broader risk appetite could drive price tests toward upper or lower technical boundaries.

Disclaimer: The analysis provided for ETH/USD is for informational purposes only and does not constitute investment advice. Traders are encouraged to perform their own analysis and research before making any trading decisions. Market conditions can change quickly, so staying informed with the latest data is essential.
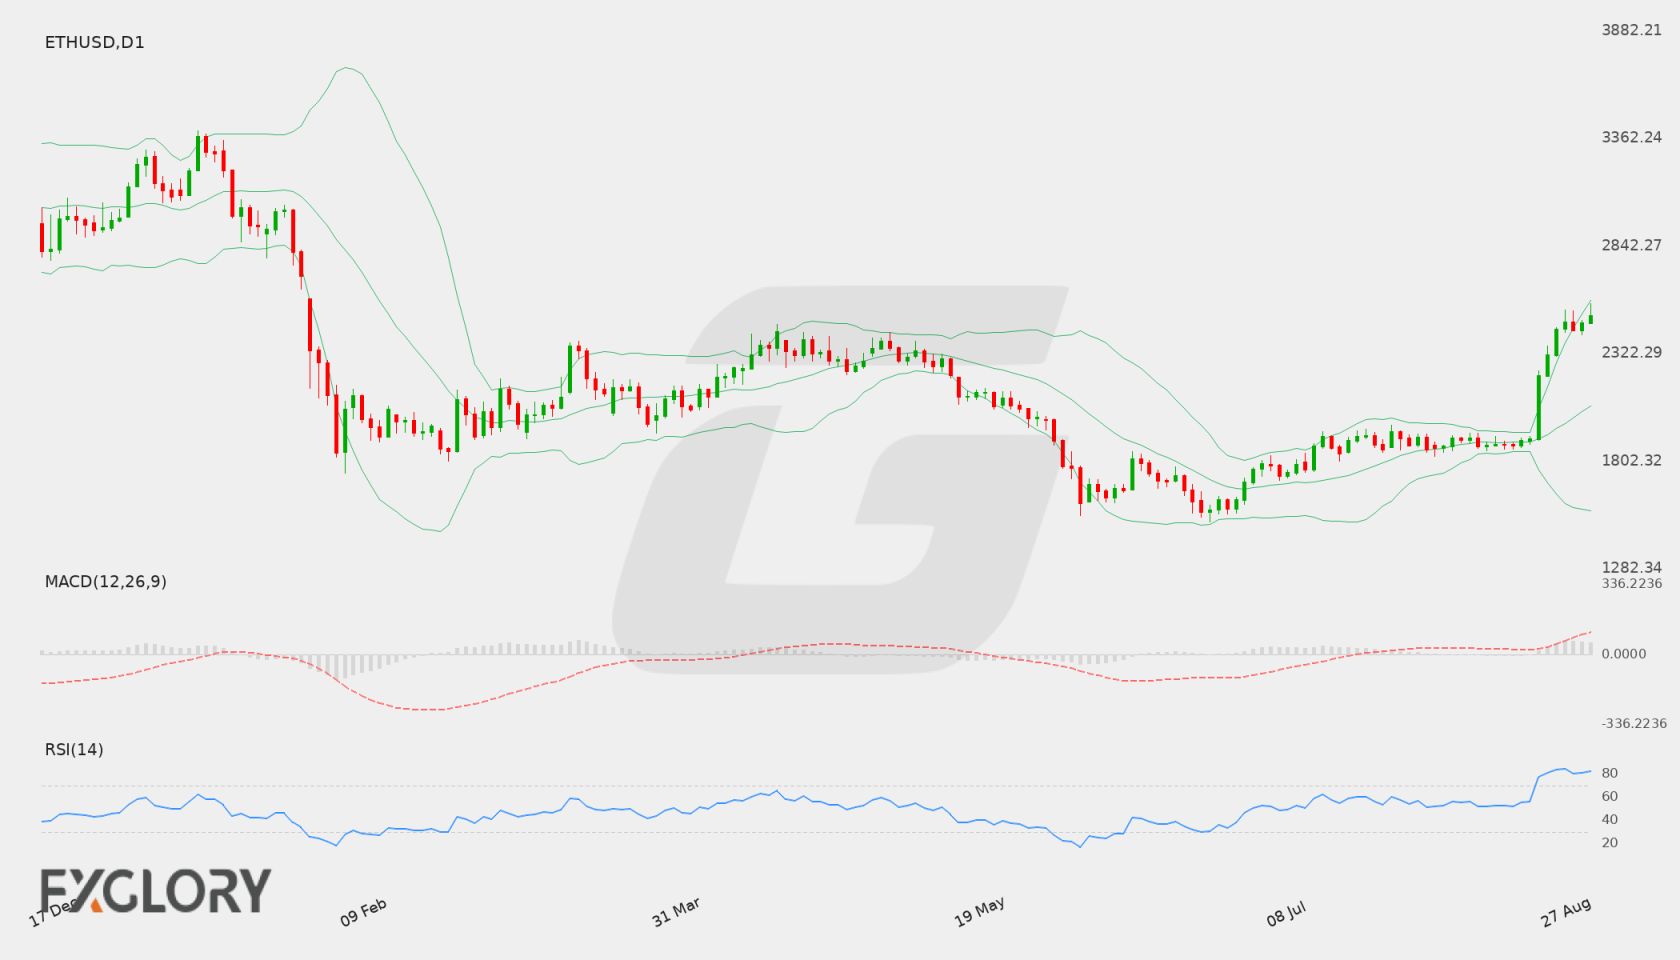
ETH/USD D1 technical analysis chart
ETH/USD D1 Technical Analysis for 08.15.2026

ETH/USD Forecast — 9 August 2026

Time Zone: GMT +3

Time Frame: Daily (D1) / Weekly Outlook

Weekly Fundamental Overview:

ETH/USD remains sensitive to scheduled market events and broader risk sentiment. Traders should watch high-impact calendar releases and USD movement where relevant before forming a directional view.

Price Action:

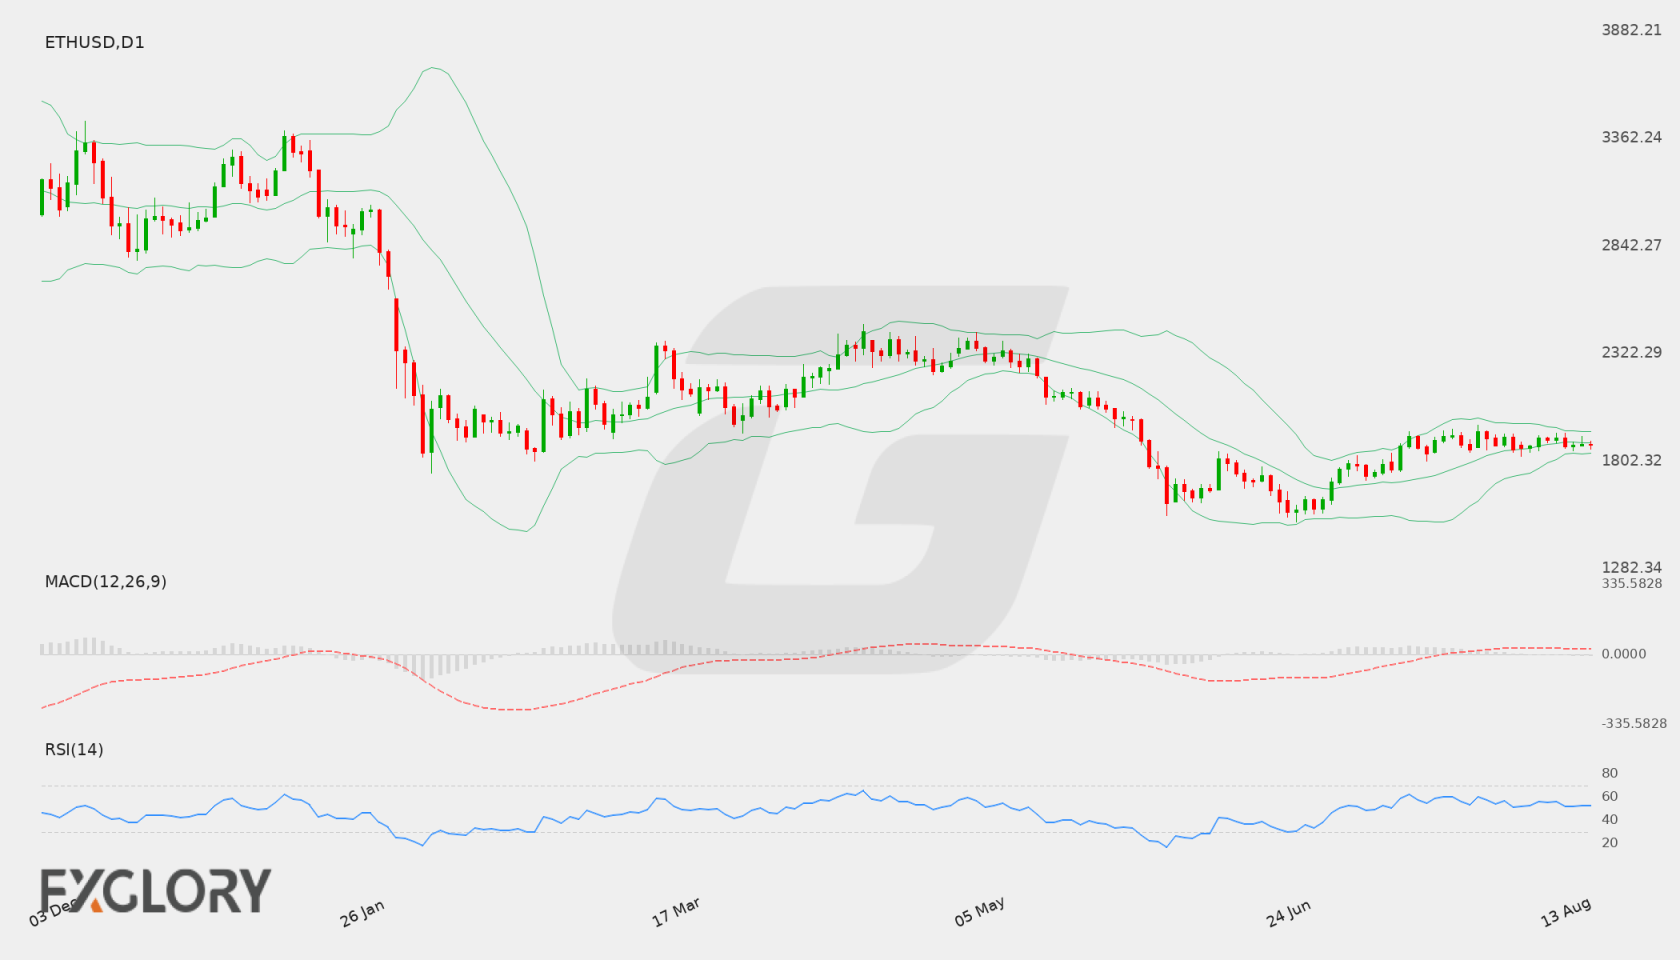
ETHUSD is trading near 1903.55, with current daily movement framed by nearby support and resistance.

Key Technical Indicators:

Bollinger Bands: Price is being assessed against the 20-period Bollinger Bands, with middle band near 1880.2595, upper band near 1968.7598628185, and lower band near 1791.7591371815.

RSI: RSI(14) is near 54.944449919149, suggesting traders should watch whether momentum holds, reaches overbought pressure, or weakens toward oversold territory.

MACD: MACD is near 26.84337448921, so momentum should be watched for continuation or loss of strength on the daily chart.

Support and Resistance:

Key support is near 1508.09, while key resistance is near 2298.83.

News to Watch for ETHUSD This Week:

  • Watch scheduled high-impact releases, central bank comments, and broader risk sentiment this week; no specific calendar events are available in current plugin data.

Weekly Outlook and Consideration:

ETH/USD may remain guided by daily price action, support and resistance reactions, momentum indicators, and supplied calendar events. Traders should wait for confirmation around key levels and avoid assuming that current conditions guarantee the next move.

Disclaimer: The analysis provided for ETH/USD is for informational purposes only and does not constitute investment advice. Traders are encouraged to perform their own analysis and research before making any trading decisions. Market conditions can change quickly, so staying informed with the latest data is essential.
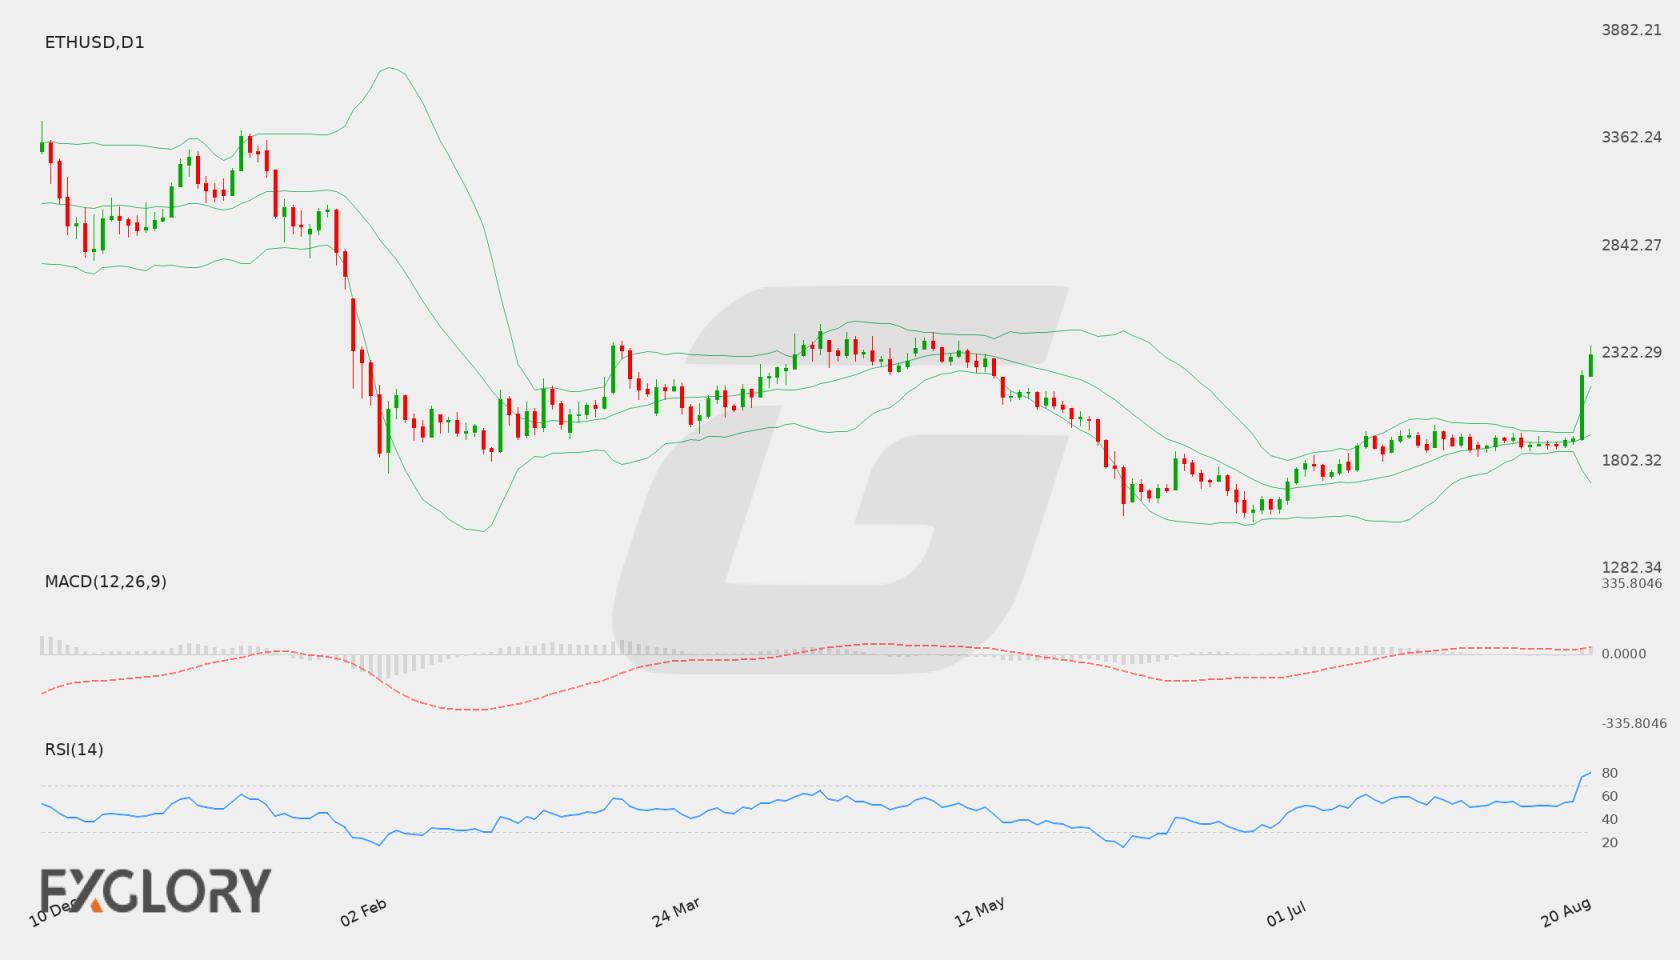
ETH/USD D1 technical analysis chart
ETH/USD D1 Technical Analysis for 08.09.2026

ETH/USD Forecast — 2 August 2026

Time Zone: GMT +4

Time Frame: 4 Hours (H4)

Fundamental Analysis:

With no scheduled macroeconomic events present in the provided calendar data, trading momentum for ETH/USD (ETHUSD) is primarily guided by technical chart developments.

Price Action:

The H4 chart shows ETH/USD (ETHUSD) extending a recent pull-back, moving down from levels near 1917.70 and 1901.90 to 1878.54 before closing at 1860.71, with a period low hitting 1843.97.

Key Technical Indicators:

Bollinger Bands(20,2.000): The Bollinger Bands establish a middle line at 1900.86, an upper boundary at 1932.68, and a lower boundary at 1869.04. The last close of 1860.71 resides below the lower band, reflecting strong recent downside motion.

MACD(12,26,9): The MACD indicator is currently recorded at -4.96, reflecting ongoing negative momentum in the H4 time frame.

RSI(14): The 14-period RSI is reading at 37.36, indicating a bearish sentiment that approaches oversold territory while staying above 30.

Support and Resistance:

Identified technical boundaries display primary support at 1831.93 and overhead resistance at 1975.46.

Conclusion and Consideration:

ETH/USD (ETHUSD) exhibits short-term bearish pressure on the H4 chart, with price settling at 1860.71. Key technical references to monitor include support at 1831.93 and resistance at 1975.46.

Disclaimer: The analysis provided for ETH/USD is for informational purposes only and does not constitute investment advice. Traders are encouraged to perform their own analysis and research before making any trading decisions. Market conditions can change quickly, so staying informed with the latest data is essential.
ETH/USD H4 technical and fundamental analysis
ETH/USD H4 Technical and Fundamental Analysis for 08.02.2026

ETH/USD Forecast — 26 February 2026

Time Zone: GMT +2

Time Frame: 4 Hours (H4)

Fundamental Analysis:

The ETHUSD pair (Ethereum against the US Dollar) is currently trading within a mixed market sentiment environment influenced by delayed economic data releases from the US due to the recent government shutdown. Upcoming releases include the Core Producer Price Index (Core PPI), general PPI, Chicago PMI, and Construction Spending, all essential indicators that could heavily impact USD valuation. Positive surprises in these metrics typically strengthen the USD and could lead to bearish pressure on Ethereum prices, while weaker-than-expected data might provide support for ETH-USD, fueling bullish sentiments.

Price Action:

The ETHUSD H4 technical and fundamental chart daily analysis highlights a ranging market where Ethereum price action is consolidating around the 2,000 USD psychological level within approximately ±300 USD. Neither bulls nor bears currently dominate the market. Ethereum’s price recently touched the upper half of the Bollinger Band, retracing toward the middle band positioned near the 50.0% Fibonacci level. However, the recent candle turned green close to the Fibonacci retracement region, signaling indecision yet mild bullish resilience within the current consolidation phase.

Key Technical Indicators:

Bollinger Bands: Analyzing ETHUSD H4 using Bollinger Bands indicates the price is moving in the upper half but retreating towards the midline (50.0% Fibonacci retracement area). Such movement typically signifies a temporary pause or consolidation, with potential ranging behavior continuing until a decisive breakout occurs.

MACD(12,26,9):The MACD indicator currently registers a MACD line value of 34.511 and a signal line at 23.755, suggesting mild bullish momentum. However, given the close proximity of these lines, traders should monitor closely for potential bearish crossovers, indicating a momentum shift to the downside.

RSI(14): The RSI indicator stands at 56.72, reflecting moderate bullish strength without entering the overbought territory. This level confirms neutrality with a slightly bullish bias, suggesting room for price movements in both directions and supporting the current range-bound scenario.

Support and Resistance:

Support: The immediate technical support for ETHUSD is found near the 1,700 price area, aligning with recent lows and the lower Bollinger Band boundary.

Resistance: Primary resistance resides at the 2,200 level, aligning with recent swing highs and the upper end of the current trading range.

Conclusion and Consideration:

The ETHUSD H4 technical analysis indicates a ranging market condition, confirmed by neutral signals from Bollinger Bands, MACD, and RSI indicators. Traders should closely monitor the upcoming economic data releases affecting the USD for potential breakouts. Until ETHUSD clearly surpasses the key resistance level at 2,200 or breaks below the 1,700 support, price action is likely to remain range-bound. Caution is advised as market conditions may quickly shift with significant economic data announcements.

Disclaimer: The analysis provided for ETH/USD is for informational purposes only and does not constitute investment advice. Traders are encouraged to perform their own analysis and research before making any trading decisions on ETHUSD. Market conditions can change quickly, so staying informed with the latest data is essential.

ETHUSDH4_Technical-and-Fundamental-analysis-for-02.27.2026

1ETH = –––USD –––%
ETHUSD
Loading chart...