
GBPUSD Forecast

GBP iconUSD icon
GBP/USD

British Pound vs US Dollar

GBP/USD Live Price

1.33528
-0.17%

GBP/USD Forecast — 1 September 2026

Time Zone: GMT +3

Time Frame: Daily (D1) / Weekly Outlook

Weekly Fundamental Overview:

The GBP/USD currency pair is moving through a market environment shaped by expectations surrounding interest rate paths and macroeconomic data from both the United Kingdom and the United States. Future movement depends heavily on central bank communication and upcoming economic activity indicators.

Price Action:

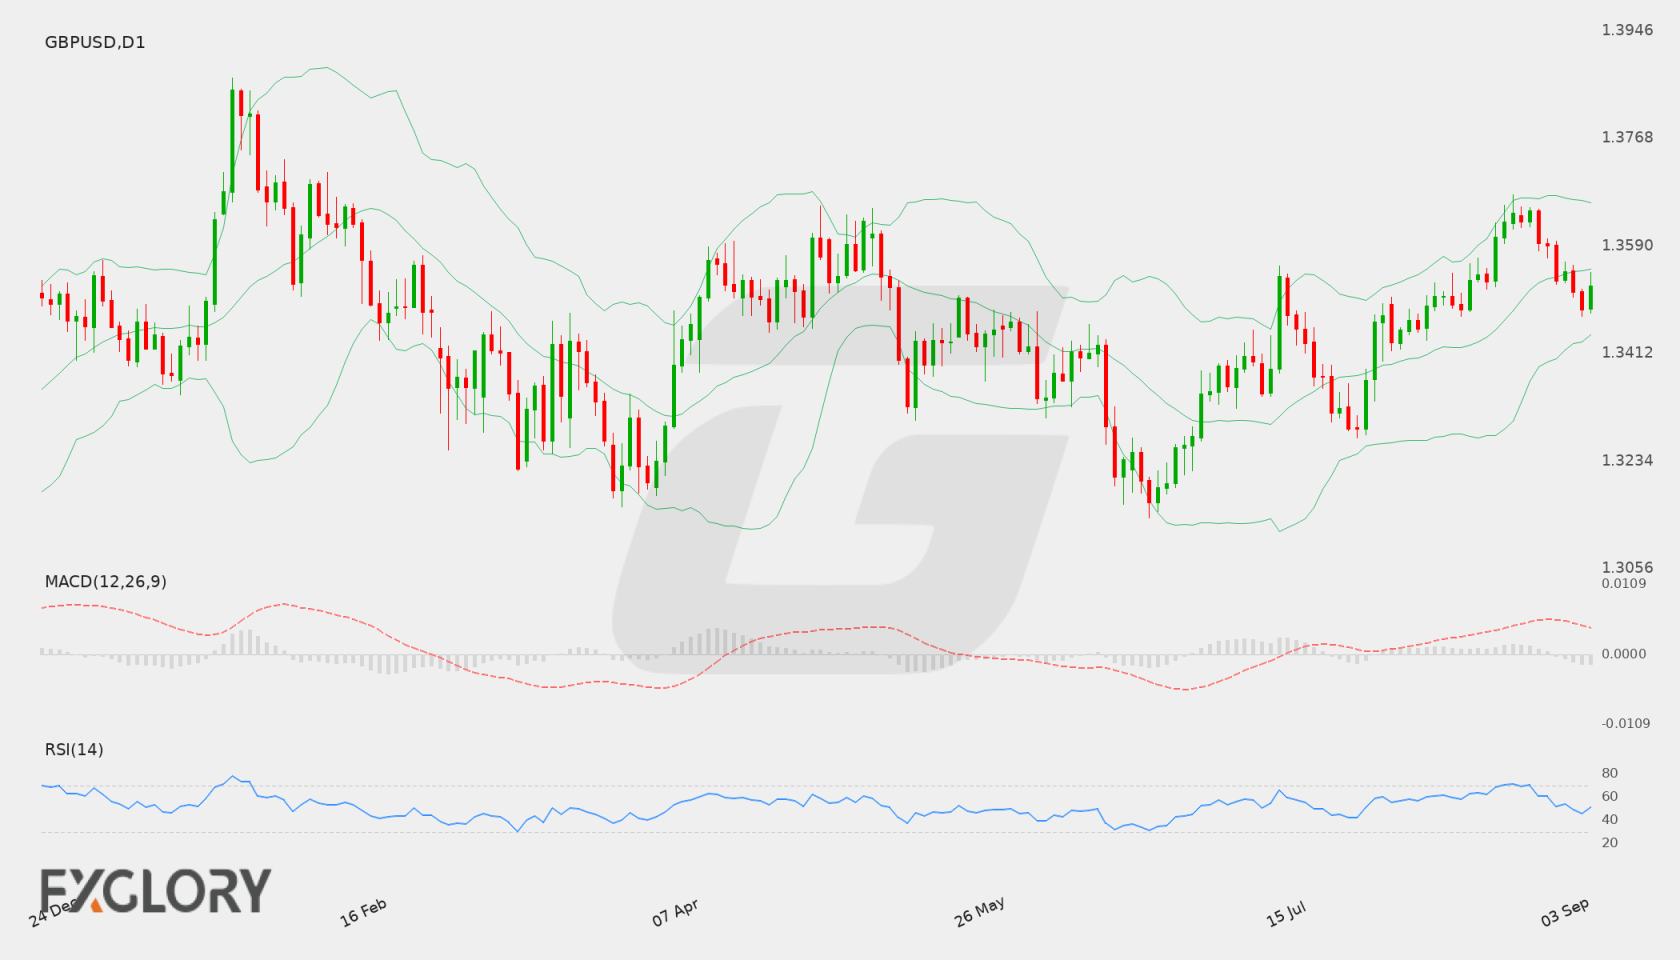
On the daily D1 chart, GBP/USD recently pulled back from a peak near 1.36742, settling around the 1.35475 level. The price action reflects a period of consolidation following a test of overhead resistance, maintaining a broad trading range.

Key Technical Indicators:

Bollinger Bands: The daily Bollinger Bands place the middle line at 1.35438, with GBP/USD currently trading near this central axis. The upper band at 1.36695 marks potential upside resistance, while the lower band at 1.34181 offers downside support within the current volatility range.

RSI: The 14-day Relative Strength Index (RSI) is recorded at 53.73, positioning the indicator in neutral territory above the 50 midpoint. This suggests balanced market conditions without immediate overbought or oversold pressure on GBPUSD.

MACD: The MACD indicator registers at 0.004438, continuing to hold above the zero line. This indicates that underlying bullish momentum remains intact, though the trajectory suggests a moderate pace of movement rather than strong acceleration.

Support and Resistance:

Key technical levels for GBP/USD feature primary daily resistance at 1.36742, reinforced by the upper Bollinger Band at 1.36695. Key support is identified further below at 1.31392, with intermediate lower band support near 1.34181.

News to Watch for GBPUSD This Week:

  • Monetary Policy Report Hearings: This event offers insight into central bank views on economic performance and potential future interest rate adjustments.
  • ISM Services PMI: This report reflects economic activity in the service sector and serves as a key measure of broader economic strength.

Weekly Outlook and Consideration:

The D1 technical setup for GBP/USD reflects a balanced market currently hovering near the 1.35438 middle Bollinger Band. Holding above this median level keeps the possibility of a retest toward 1.36742 open. However, if selling pressure increases and pushes price action beneath the middle band, GBPUSD could move down to test intermediate support near 1.34181 or ultimate support at 1.31392.

Disclaimer: The analysis provided for GBP/USD is for informational purposes only and does not constitute investment advice. Traders are encouraged to perform their own analysis and research before making any trading decisions. Market conditions can change quickly, so staying informed with the latest data is essential.
GBP/USD Forecast — 5 September 2026

Time Zone: GMT +3

Time Frame: Daily (D1) / Weekly Outlook

Weekly Fundamental Overview:

Market sentiment for GBP/USD is balanced as traders evaluate upcoming macroeconomic indicators including UK growth figures and US inflation metrics. Economic signals from both regions are providing clues regarding future monetary policy expectations.

Price Action:

On the daily chart, GBP/USD recently pulled back from recent highs above 1.3640 toward 1.3485 before recovering slightly to close at 1.35238. Price action displays consolidation around the 1.3520 region as market participants seek directional clarity.

Key Technical Indicators:

Bollinger Bands: The daily Bollinger Bands present a middle line at 1.35515, with an upper band at 1.36607 and a lower band at 1.34422. Price currently trades near the middle band, reflecting a balanced volatility profile and neutral short-term structure.

RSI: The 14-period Relative Strength Index (RSI) stands at 50.82, positioned right around the neutral 50 threshold. This signals an even balance between buying and selling pressure.

MACD: The daily MACD main value sits at 0.00242. This modest positive reading indicates mild underlying bullish momentum, though it reflects the recent corrective consolidation phase.

Support and Resistance:

Primary technical resistance for GBP/USD is identified at 1.36742, while key downside support rests at 1.31392.

News to Watch for GBPUSD This Week:

  • PPI m/m: This wholesale inflation reading can influence expectations regarding underlying price pressures in the economy.
  • Core PPI m/m: Excluding volatile food and energy costs, this release provides insights into broader producer price trends.
  • Unemployment Claims: Weekly labor market data offers a fresh look at employment conditions and economic momentum.
  • GDP m/m: Monthly economic output figures serve as a critical gauge of overall growth.
  • Core CPI m/m: Tracking underlying consumer prices gives clues on persistent price momentum that could impact interest rate decisions.
  • CPI y/y: The headline annual inflation figure remains a major focal point for assessing purchasing power trends.
  • Core CPI y/y: Year-over-year core inflation highlights underlying price stability across consumer spending categories.
  • CPI m/m: Monthly shifts in consumer prices offer an immediate view of short-term inflationary trends.
  • Prelim UoM Inflation Expectations: Consumer projections on future price behavior help measure long-term inflation outlooks.
  • Prelim UoM Consumer Sentiment: Surveyed consumer confidence reflects sentiment regarding current and future economic health.

Weekly Outlook and Consideration:

GBP/USD remains in a consolidated posture around 1.35238, held between key support at 1.31392 and resistance at 1.36742. With technical indicators like the RSI near neutral at 50.82 and price trading close to the middle Bollinger Band at 1.35515, upcoming economic releases will likely determine whether the pair tests resistance overhead or retreats toward lower support levels.

Disclaimer: The analysis provided for GBP/USD is for informational purposes only and does not constitute investment advice. Traders are encouraged to perform their own analysis and research before making any trading decisions. Market conditions can change quickly, so staying informed with the latest data is essential.
GBP/USD D1 technical analysis chart
GBP/USD D1 Technical Analysis for 09.05.2026

GBP/USD Forecast — 12 September 2026

Time Zone: GMT +3

Time Frame: Daily (D1) / Weekly Outlook

Weekly Fundamental Overview:

The GBP/USD pair enters the week in a cautious stance ahead of critical central bank developments from both the Federal Reserve and the Bank of England. Market participants are monitoring underlying economic data from the UK and US to gauge future interest rate trajectories, which remain the primary macro driver for the currency pair.

Price Action:

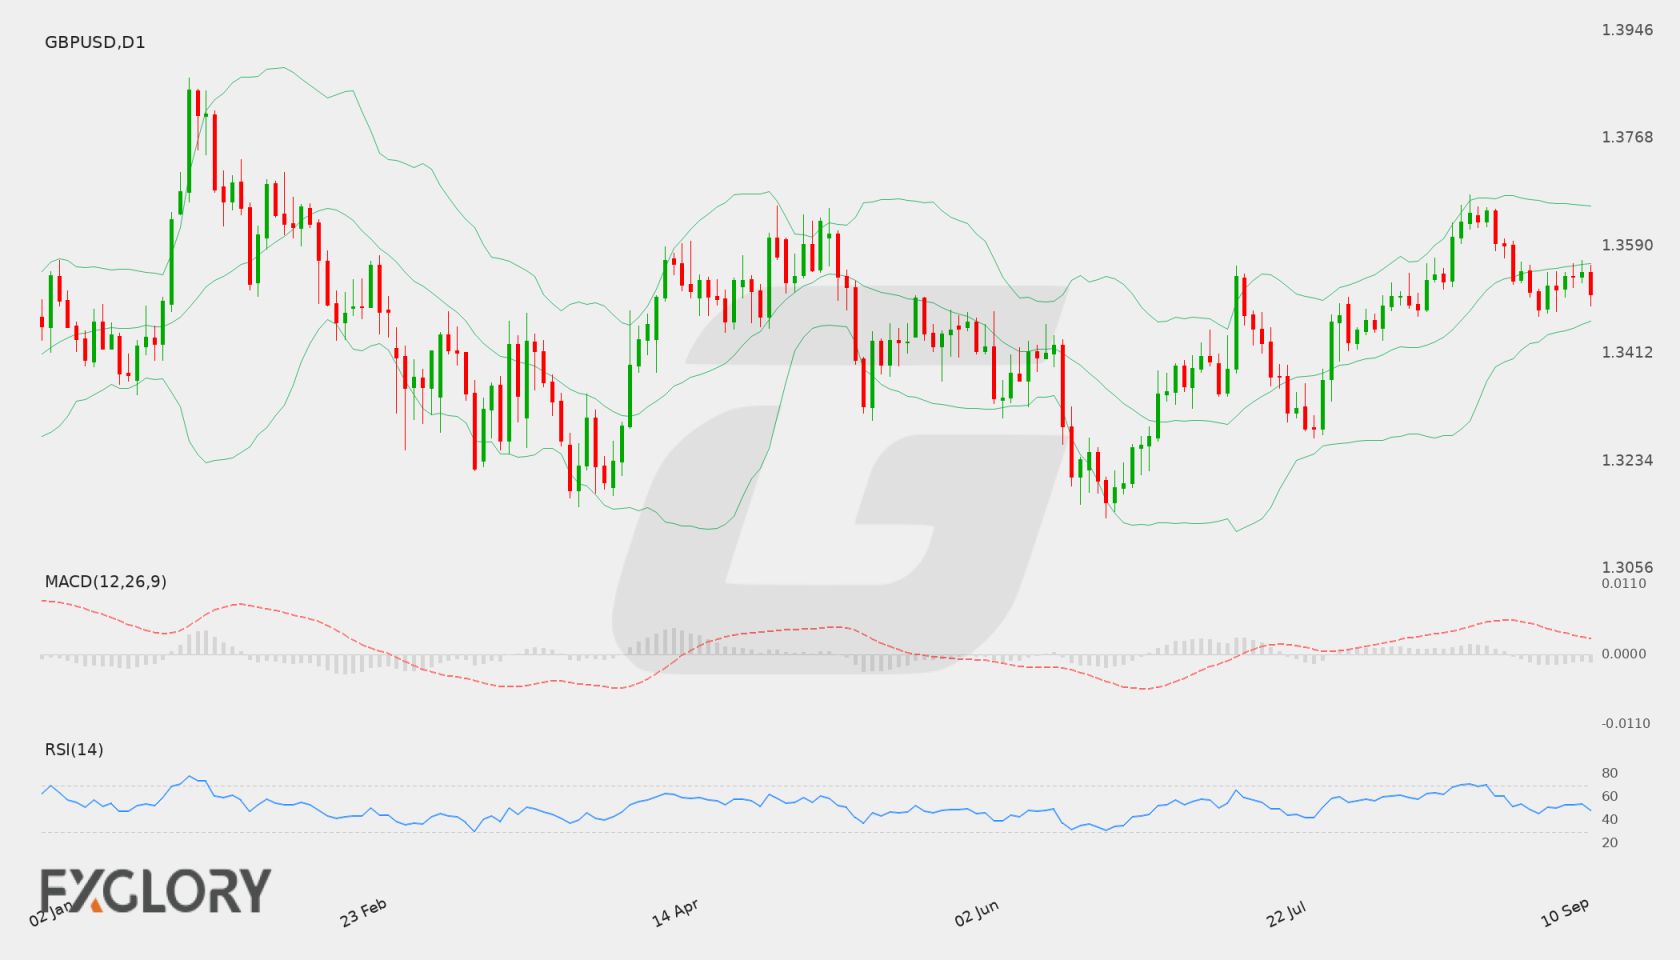
On the Daily (D1) chart, GBP/USD recently pulled back from higher levels toward 1.36476, closing at 1.35105. Recent candles show short-term consolidation as price action moves slightly below the mid-range of recent fluctuations.

Key Technical Indicators:

Bollinger Bands: The D1 Bollinger Bands depict a middle band at 1.35601, an upper band at 1.36555, and a lower band at 1.34647. With the last close at 1.35105, GBPUSD trades just under the middle line, suggesting a slightly soft intraday bias within a defined volatility envelope.

RSI: The 14-period Daily RSI is currently reading 48.30. Positioned near the neutral 50 threshold, the indicator reflects a balanced market state without immediate overbought or oversold signals.

MACD: The D1 MACD indicator currently stands at 0.00129. While remaining in positive territory, the value is relatively flat, signaling limited bullish momentum and indicating potential range-bound movement in the near term.

Support and Resistance:

Key technical references for GBPUSD show major daily support at 1.31392 and major daily resistance at 1.36742. Additional short-term reference points align near the Bollinger upper band at 1.36555 and lower band at 1.34647.

News to Watch for GBPUSD This Week:

  • Claimant Count Change: Tracks shifts in UK unemployment figures that influence domestic economic sentiment.
  • Average Earnings Index 3m/y: Measures UK wage growth trends that directly impact domestic inflation pressures.
  • CPI y/y: Highlights UK headline annual consumer inflation rates affecting monetary policy expectations.
  • Core Retail Sales m/m: Reflects US underlying consumer spending momentum excluding volatile categories.
  • Retail Sales m/m: Measures broad US retail spending to evaluate overall economic strength.
  • FOMC Economic Projections: Details Federal Reserve growth and interest rate projections over coming quarters.
  • FOMC Statement: Communicates official Federal Reserve monetary policy decisions and views.
  • Federal Funds Rate: Discloses the targeted short-term interest rate setting for the US economy.
  • FOMC Press Conference: Provides leadership commentary on Federal Reserve rate decisions and policy outlook.
  • Official Bank Rate: Establishes the benchmark UK policy interest rate.
  • MPC Official Bank Rate Votes: Reveals internal Bank of England voting distribution regarding rate policy.
  • Monetary Policy Summary: Explains the rationale behind the Bank of England rate stance and economic guidance.

Weekly Outlook and Consideration:

The weekly outlook for GBP/USD (GBPUSD) indicates a neutral to consolidating market structure around the 1.35105 mark. Indicators such as the D1 RSI at 48.30 and MACD at 0.00129 show balanced momentum. Price action remains bounded between support at 1.31392 and resistance at 1.36742, with central bank releases likely serving as key volatility triggers.

Disclaimer: The analysis provided for GBP/USD is for informational purposes only and does not constitute investment advice. Traders are encouraged to perform their own analysis and research before making any trading decisions. Market conditions can change quickly, so staying informed with the latest data is essential.

GBP/USD D1 technical analysis chart
GBP/USD D1 Technical Analysis for 09.12.2026

GBP/USD Forecast — 22 August 2026

Time Zone: GMT +3

Time Frame: Daily (D1) / Weekly Outlook

Weekly Fundamental Overview:

The GBP/USD currency pair faces an event-heavy week centered around significant US economic indicators. Key releases including consumer confidence, inflation metrics, quarterly growth data, and labor benchmark revisions may dictate sentiment for GBPUSD. Market participants will monitor these prints to gauge whether the greenback will find support or yield further gains to the British pound.

Price Action:

On the daily (D1) chart, GBP/USD has maintained an upward trajectory, closing at 1.36289 after steadily advancing from earlier lows around 1.3450. The pair is approaching its critical high-water mark, displaying consistent higher daily closes over recent sessions.

Key Technical Indicators:

Bollinger Bands: The price is currently trading near the upper Bollinger Band at 1.36457, reflecting strong bullish pressure. The middle band sits at 1.34662, acting as a potential mean-reversion level, while the lower band remains situated down at 1.32866.

RSI: The 14-day Relative Strength Index (RSI) stands at 70.16. Moving into overbought territory, this reading signals strong buying momentum but also highlights the possibility of a temporary pause or corrective pullbacks.

MACD: The daily MACD histogram and signal lines remain in positive territory with a value of 0.00536. This indicates ongoing bullish momentum, though traders will watch for any signs of momentum loss as price approaches major resistance.

Support and Resistance:

Key technical resistance for GBP/USD is positioned at 1.36573, near the upper Bollinger Band. On the downside, primary technical support is established at 1.31392, with intermediate dynamic support located around the middle Bollinger Band near 1.34662.

News to Watch for GBPUSD This Week:

  • CB Consumer Confidence: Shifts in consumer sentiment provide valuable clues about domestic spending trends and broader economic trajectory.
  • Core PCE Price Index m/m: Updates on this key inflation gauge significantly influence monetary policy expectations.
  • Prelim GDP q/q: Revised economic growth figures help clarify the overall strength and momentum of the economy.
  • Prelim GDP Price Index q/q: Broader inflation components within GDP report help measure aggregate price trends.
  • Unemployment Claims: Weekly jobless figures provide timely insights into current labor market conditions.
  • Prelim Benchmark Payrolls Revision: Revisions to historical employment figures offer a clearer picture of underlying labor strength.

Weekly Outlook and Consideration:

The GBP/USD pair enters the week displaying strong upside momentum, closing at 1.36289 and testing resistance at 1.36573. Technical indicators reflect solid bullish control, evidenced by a positive MACD of 0.00536 and price hugging the upper Bollinger Band at 1.36457. However, with the RSI at 70.16 indicating overbought conditions, a consolidation phase or pullback toward the 1.34662 middle band could develop if resistance holds firmly during upcoming data releases.

Disclaimer: The analysis provided for GBP/USD is for informational purposes only and does not constitute investment advice. Traders are encouraged to perform their own analysis and research before making any trading decisions. Market conditions can change quickly, so staying informed with the latest data is essential.

GBP/USD Forecast — 15 August 2026

Time Zone: GMT +3

Time Frame: Daily (D1) / Weekly Outlook

Weekly Fundamental Overview:

GBP/USD faces a pivotal week with critical macroeconomic updates scheduled from both the UK and the US economy. Traders are watching UK employment indicators alongside key inflation metrics to assess potential policy shifts from the Bank of England. Simultaneously, US economic data, including Federal Reserve meeting notes and labor conditions, will provide clearer direction on broader USD risk sentiment and rate expectations.

Price Action:

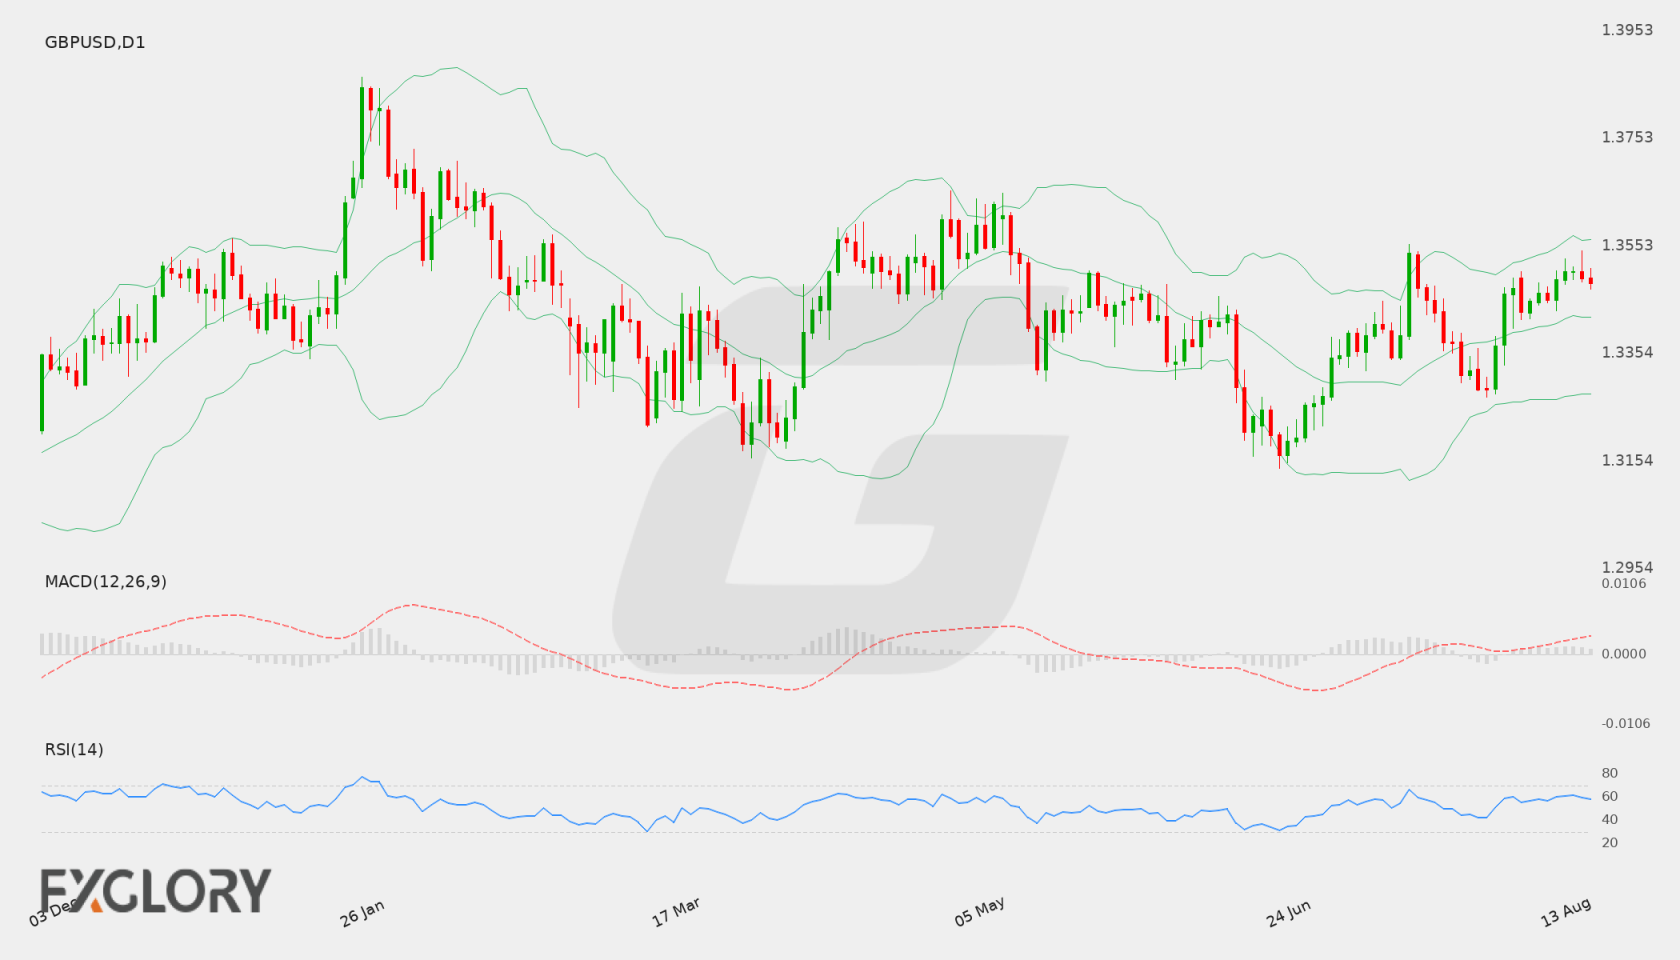
On the Daily (D1) timeframe, GBP/USD (GBPUSD) recently closed at 1.3485 after consolidating in a tight range between 1.3450 and 1.3506. The price structure shows sustained buying interest over recent daily sessions, staying comfortably above key moving averages while attempting to build bullish momentum toward upper resistance zones.

Key Technical Indicators:

Bollinger Bands: The Bollinger Bands indicator highlights a middle band reading at 1.34214, with the upper band situated at 1.35648 and the lower band at 1.32780. Trading at 1.3485 places GBP/USD in the upper half of the band channel, pointing to mild bullish continuation, though remaining below the upper volatility threshold.

RSI: The 14-period Relative Strength Index (RSI) currently sits at 58.01. Remaining above the neutral 50 level, the RSI indicates steady underlying buying sentiment without dipping into overbought conditions above 70.

MACD: The Moving Average Convergence Divergence (MACD) indicator records a main line reading of 0.00348. Positioned above the zero mark, the signal supports current bullish momentum on the daily chart, though traders will monitor signal lines for potential deceleration.

Support and Resistance:

Key technical levels for GBP/USD feature immediate overhead daily resistance at 1.35565. On the downside, primary daily support is identified at 1.31392, with intermediate support offered around the middle Bollinger band at 1.34214.

News to Watch for GBPUSD This Week:

  • Claimant Count Change: Measures shifts in UK jobless claims to evaluate labor market stability.
  • Average Earnings Index 3m/y: Tracks UK wage pressure trends to gauge potential domestic inflation.
  • CPI y/y: Reports overall UK consumer price inflation that heavily influences Bank of England monetary policy.
  • Prelim Benchmark Payrolls Revision: Re-evaluates historical US job growth metrics to clarify past labor dynamics.
  • FOMC Meeting Minutes: Provides detailed insight into Federal Reserve discussions regarding future policy rate decisions.
  • Unemployment Claims: Tracks weekly US initial jobless filings to assess real-time labor market strength.
  • Philly Fed Manufacturing Index: Measures business health across the US regional manufacturing sector.

Weekly Outlook and Consideration:

The weekly outlook for GBP/USD (GBPUSD) leans moderately constructive following a close at 1.3485. With RSI at 58.01 and MACD positive at 0.00348, technical indicators favor potential upside testing toward daily resistance at 1.35565. However, if sellers push price below the middle Bollinger band of 1.34214, a corrective move toward major daily support at 1.31392 could emerge depending on market reactions to upcoming UK CPI and US FOMC minutes.

Disclaimer: The analysis provided for GBP/USD is for informational purposes only and does not constitute investment advice. Traders are encouraged to perform their own analysis and research before making any trading decisions. Market conditions can change quickly, so staying informed with the latest data is essential.

GBP/USD D1 technical analysis chart
GBP/USD D1 Technical Analysis for 08.15.2026
1GBP = –––USD –––%
GBPUSD
Loading chart...