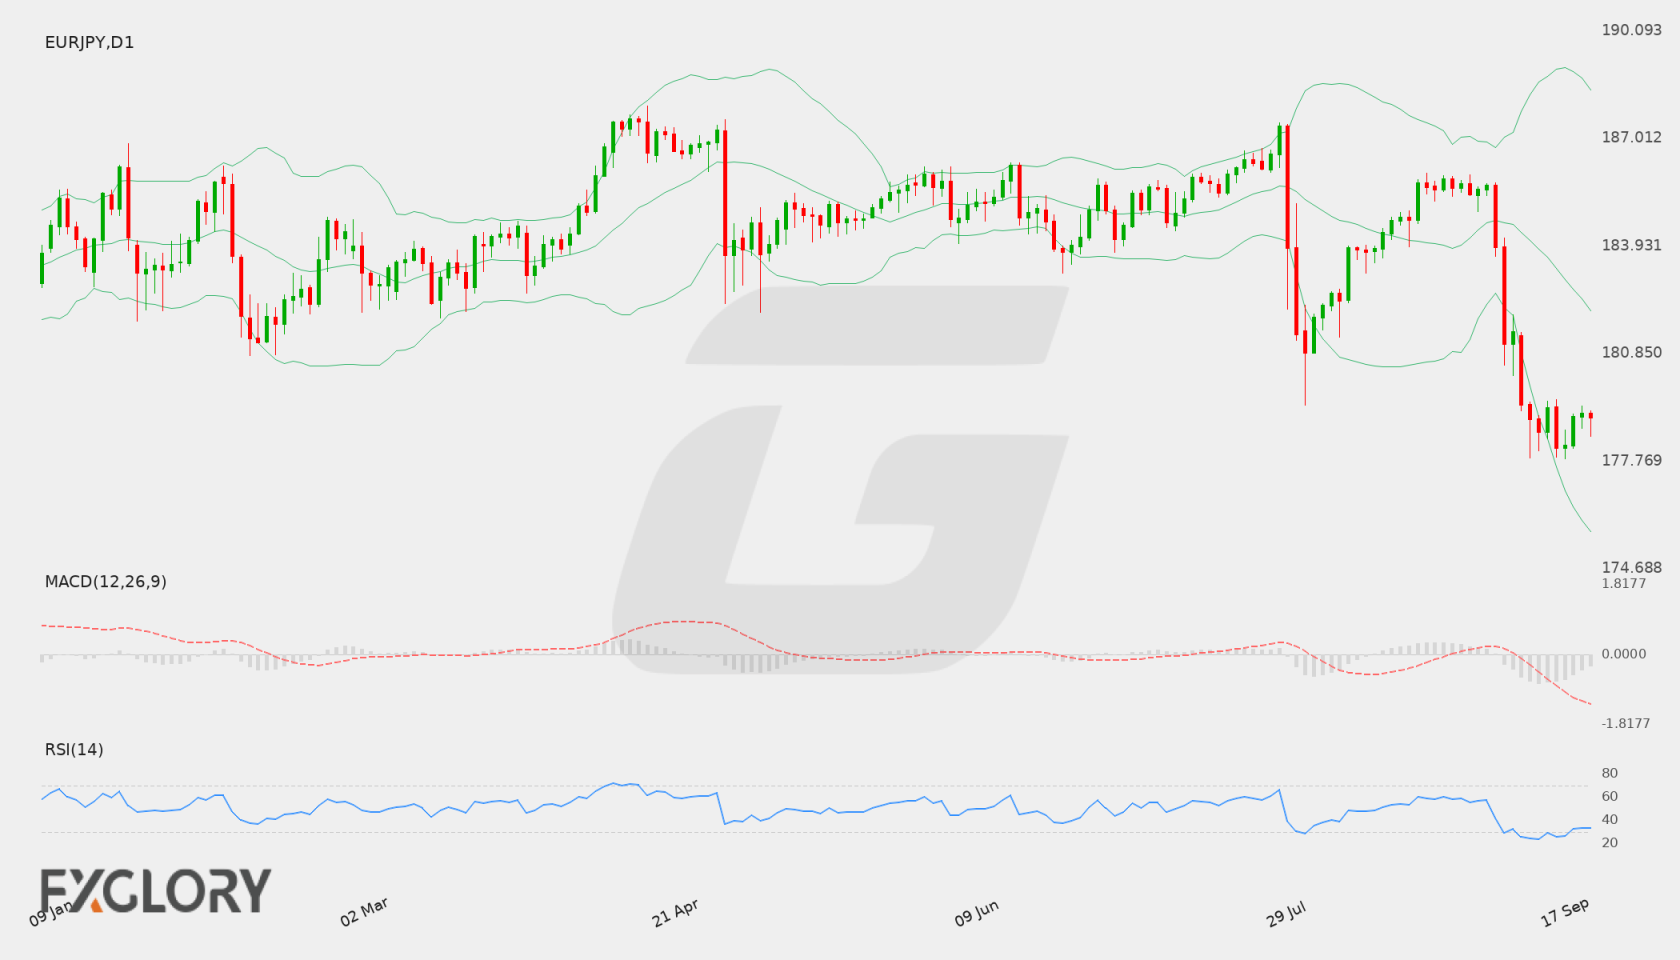
Current weekly forecast: This outlook covers 17–24 October 2026 and remains valid until 24 October 2026, unless its stated invalidation condition is triggered earlier.
In brief
EUR/JPY has a bearish weekly bias, although bullish H4 momentum and mixed D1 evidence leave room for consolidation or a recovery toward resistance.
The D1 timeframe controls the weekly view: the trend state is bearish, the close sequence is mixed, and the 177.246 close is below the D1 EMA20 at 178.16008, EMA50 at 180.1997 and SMA200 at 183.68479. Falling EMA50 and SMA200 slopes reinforce the broader downside structure, but the mixed close sequence prevents the setup from being treated as one-directional.
H4 currently pushes against the D1 thesis, with a bullish tactical state, RSI at 56.9 and positive MACD histogram conditions. That pressure places 177.855 resistance between the current close and the higher reference levels at 179.299 and 180.1997. Conversely, renewed D1 weakness through 176.516 would keep the bearish path relevant toward 175.65596, subject to the stated conditional framework.
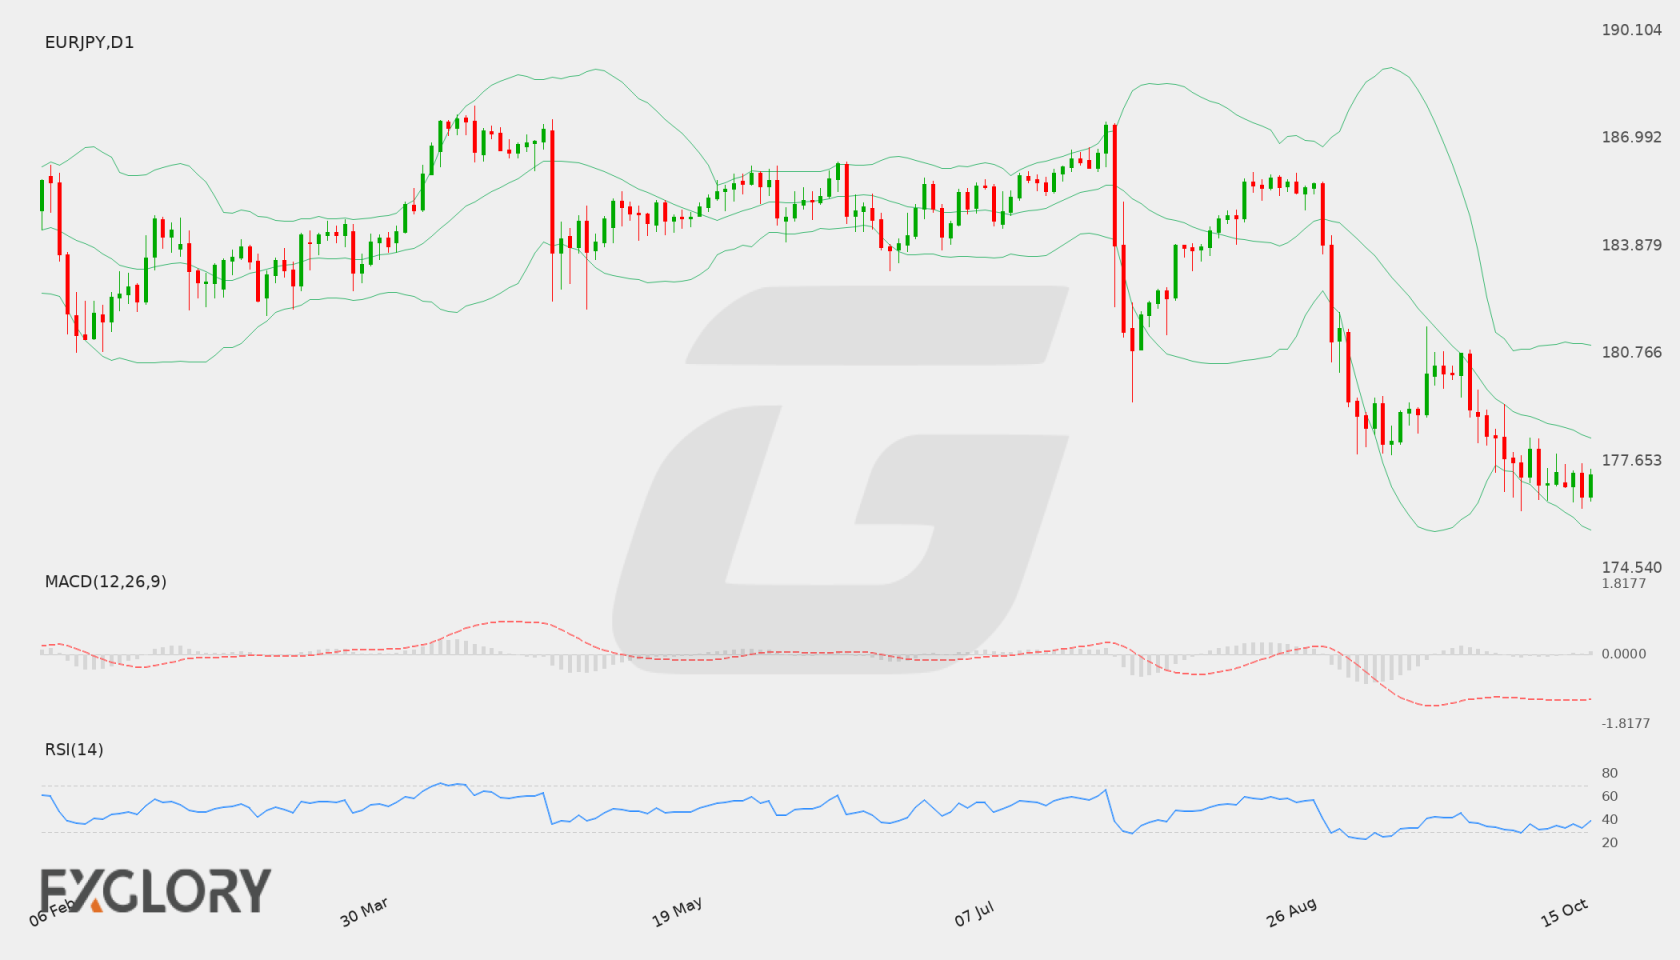
EUR/JPY D1 technical-analysis context for the weekly forecast. Chart data captured 17 October 2026.
EUR/JPY retains a bearish weekly bias as D1 structure and negative momentum align, although mixed closes and improving H4 momentum leave consolidation risk.
The weekly thesis is controlled by a bearish D1 trend state, with the 176.988 close below the 178.7317 Bollinger middle band, the 178.86592 EMA20 and the 180.891 EMA50. Negative MACD momentum and falling EMA50 and SMA200 slopes reinforce the broader downside structure.
The setup is not one-directional in its timing: the D1 close sequence is mixed, while H4 remains tactically bearish but shows a positive MACD histogram and an RSI of 46.4. This combination leaves room for consolidation or a corrective test before the weekly structure becomes clearer around 176.208 support and 178.324 resistance.
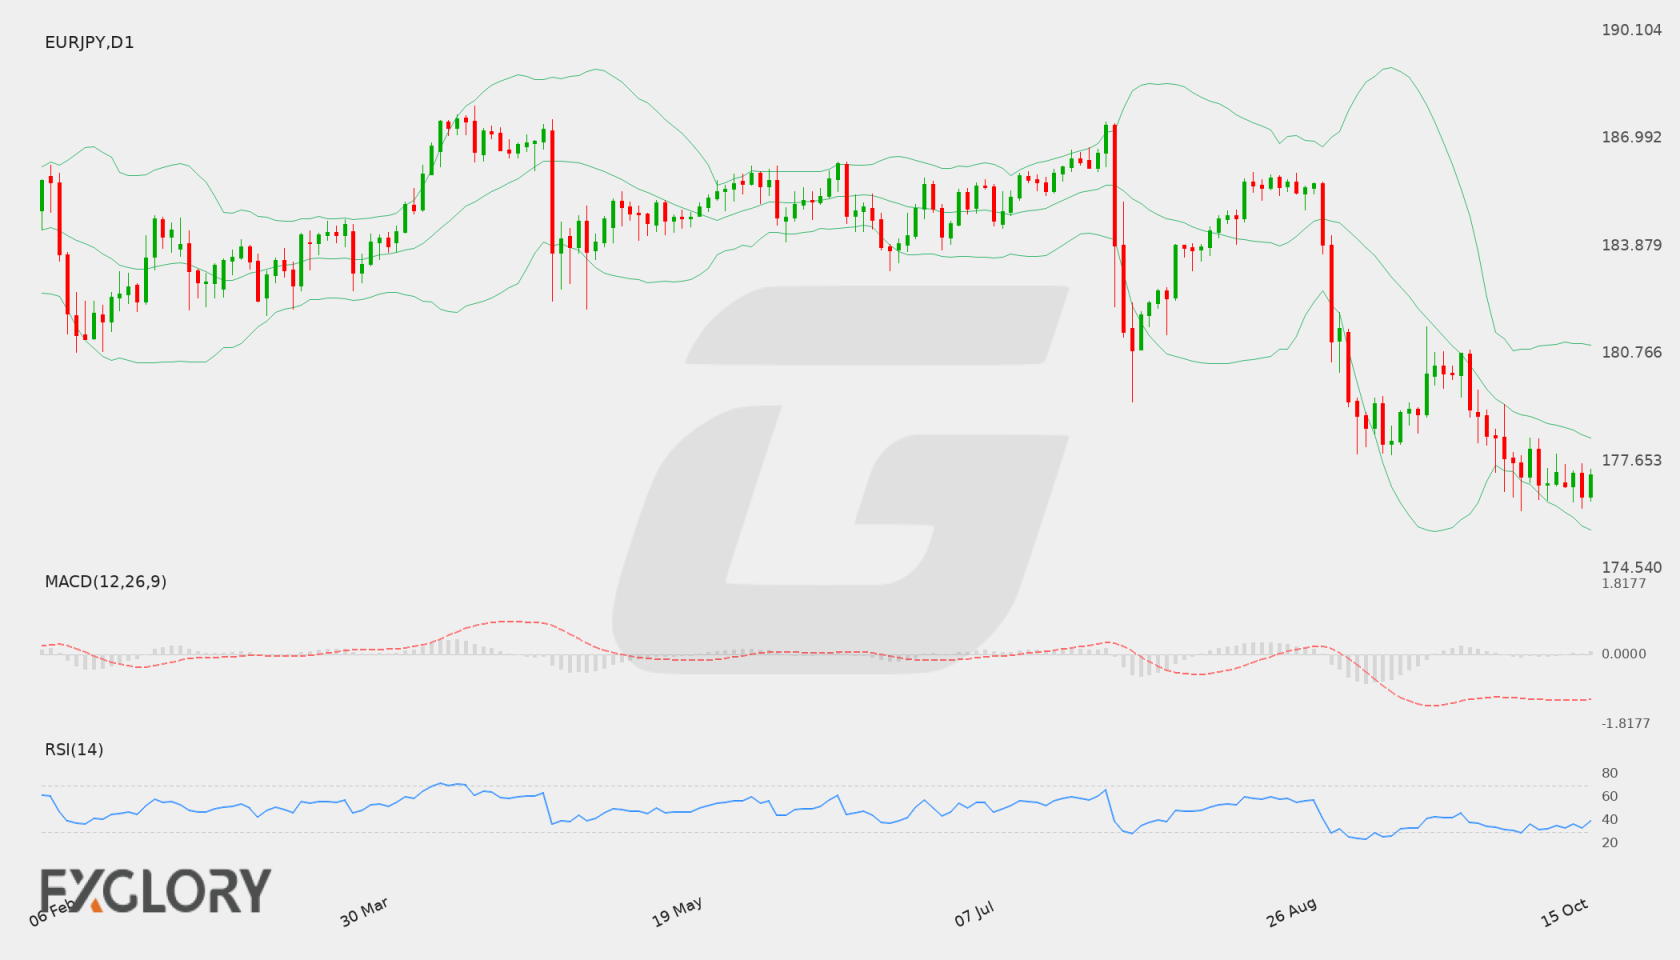
EUR/JPY D1 technical-analysis context for the weekly forecast. Chart data captured 16 October 2026.
EUR/JPY continues to be influenced by macroeconomic conditions in the Eurozone and Japan, alongside evolving interest rate expectations and sovereign yield differentials. Risk sentiment across global financial markets also remains an essential driver for the Japanese Yen, dictating capital flows across major crosses like EUR/JPY.
Price Action:
On the daily chart, EUR/JPY has displayed sustained selling pressure after declining from previous peaks near 187.457. The pair recorded a sequence of lower daily closes across recent sessions, reaching a low of 176.759 before closing at 177.729. Price action reflects continued bearish control as the market tests lower technical boundaries.
Key Technical Indicators:
Bollinger Bands: The Bollinger Bands show the middle band positioned at 179.280, with the upper band at 181.183 and the lower band at 177.377. With the last close at 177.729, EUR/JPY is trading near the lower band, reflecting strong downside momentum and an expansion in daily volatility.
RSI: The 14-day RSI is currently recorded at 31.49, hovering just above the oversold boundary. While this indicates dominant selling interest in EUR/JPY, it also approaches levels where downward momentum may face exhaustion or consolidation.
MACD: The daily MACD reading stands in negative territory at -1.147. This negative value indicates persistent downward momentum and reflects a continuation of bearish strength across recent daily trading sessions.
Support and Resistance:
Technical support for EUR/JPY is identified at 176.759, which aligns with the recent daily low. Major resistance is positioned at 187.457, with the 20-day middle Bollinger band at 179.280 serving as an intermediate barrier to any upward recovery.
News to Watch for EURJPY This Week:
No specific events are available; traders should monitor generic high-impact releases, central bank comments, and broader risk sentiment.
Weekly Outlook and Consideration:
EUR/JPY heads into the week under clear daily downward pressure, having closed at 177.729 close to the lower Bollinger band at 177.377. The MACD value of -1.147 and RSI at 31.49 confirm that bears remain in control. A sustained violation below support at 176.759 could open the door for deeper weakness, whereas any corrective rebound would need to overcome the middle Bollinger band at 179.280 to neutralize immediate selling pressure ahead of the major resistance at 187.457.
Disclaimer: The analysis provided for EUR/JPY is for informational purposes only and does not constitute investment advice. Traders are encouraged to perform their own analysis and research before making any trading decisions. Market conditions can change quickly, so staying informed with the latest data is essential.
The EUR/JPY currency pair reflects ongoing shifts between Eurozone inflation metrics and broader market risk sentiment influencing the Japanese Yen. Traded around 180.775, EURJPY reacts to regional economic indicators as well as monetary policy expectations. Traders continue to monitor incoming macroeconomic data to gauge potential momentum.
Price Action:
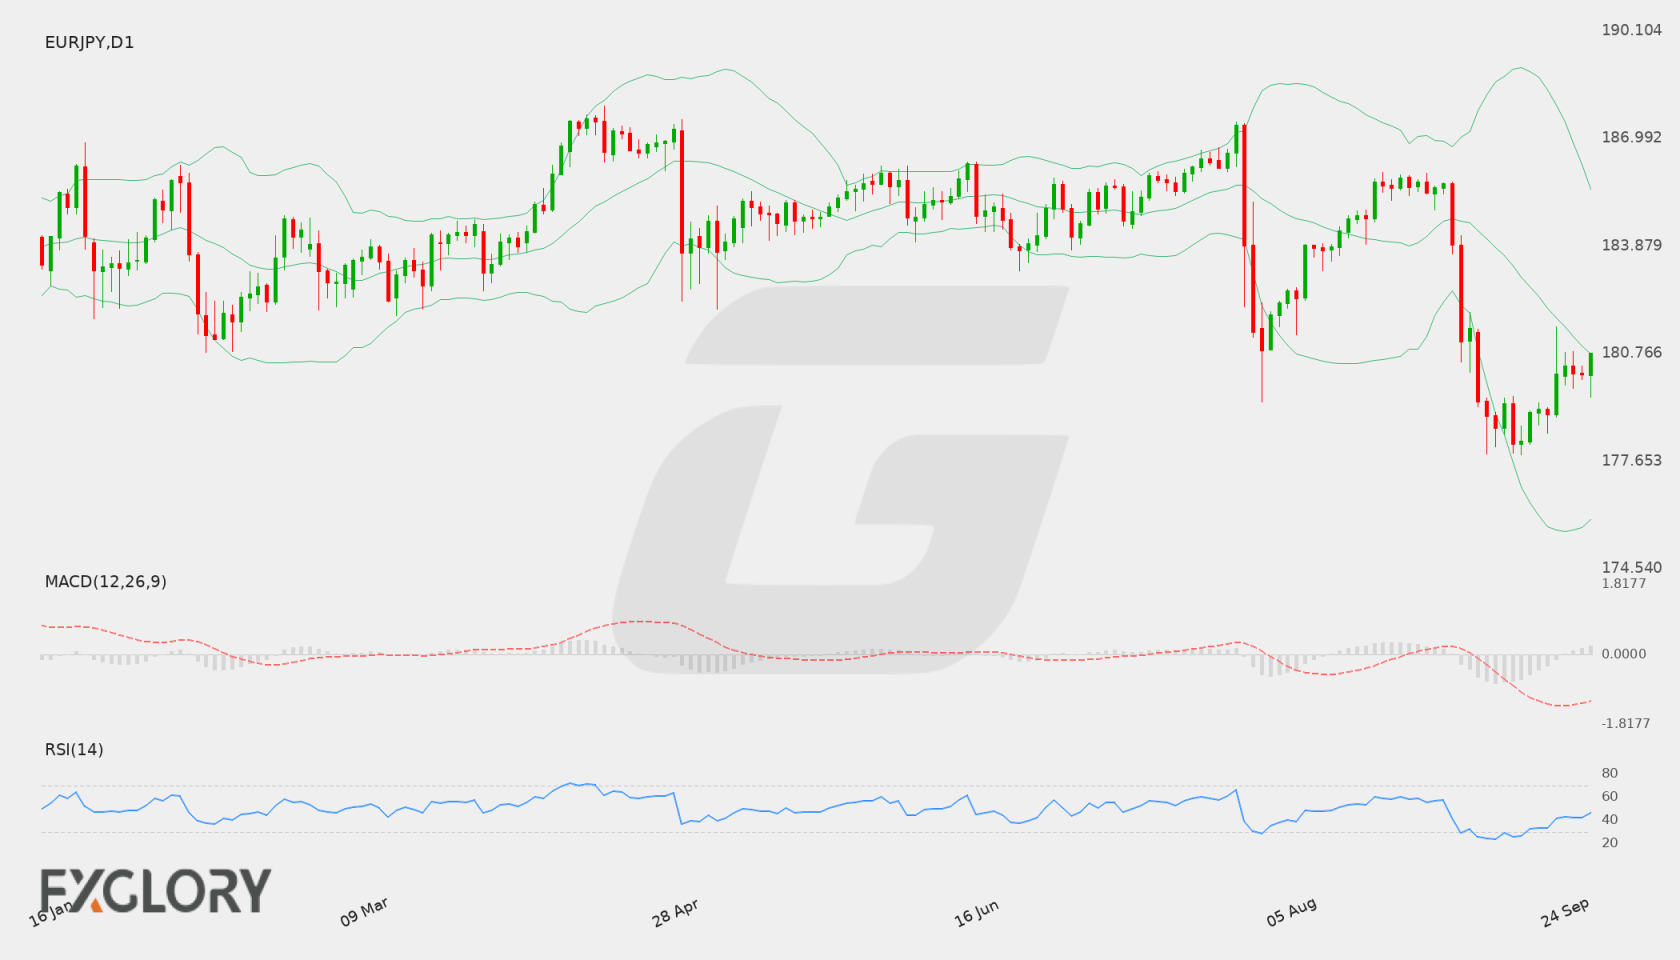
On the Daily (D1) chart, EUR/JPY recently recovered from multi-session lows around the 177.835 region to achieve a close of 180.775. After declining from resistance near 187.457, recent candles indicate a stabilization phase near the midpoint of the recent swing.
Key Technical Indicators:
Bollinger Bands: The Daily Bollinger Bands display a middle band at 180.736, an upper band at 185.518, and a lower band at 175.954. With EURJPY closing at 180.775, price sits virtually on top of the middle band, reflecting a balanced, consolidation stance.
RSI: The 14-period Relative Strength Index (RSI) is currently reading 46.45. Situated in neutral territory below 50, the index reflects an absence of extreme overbought or oversold pressure.
MACD: The Daily MACD indicator stands at -0.995. The negative value indicates residual bearish momentum from the earlier sell-off, although flat price action near 180.775 suggests diminishing downward impulse.
Support and Resistance:
Key technical support for EUR/JPY is established at 177.835, which effectively contained recent downside attempts. Overhead resistance is identified at 187.457, defining the upper bound of the major daily price structure.
News to Watch for EURJPY This Week:
German Prelim CPI m/m: Inflation figures from Germany offer critical guidance on broader European price stability and can impact Euro sentiment.
Weekly Outlook and Consideration:
EUR/JPY displays a consolidating weekly outlook following a bounce from support at 177.835 toward 180.775. Positioned close to the Bollinger middle band of 180.736 with an RSI of 46.45, the pair may remain bound within the broader range capped by resistance at 187.457 until a breakout occurs.
Disclaimer: The analysis provided for EUR/JPY is for informational purposes only and does not constitute investment advice. Traders are encouraged to perform their own analysis and research before making any trading decisions. Market conditions can change quickly, so staying informed with the latest data is essential.
The EUR/JPY currency pair reflects ongoing interplay between Eurozone economic performance and Japanese monetary dynamics. Recent market conditions have highlighted shifting rate expectations and inflation trajectory, keeping market participants focused on key upcoming inflation data releases across Europe and Japan. General risk sentiment across global markets continues to play a significant role in dictating the direction of this cross rate.
Price Action:
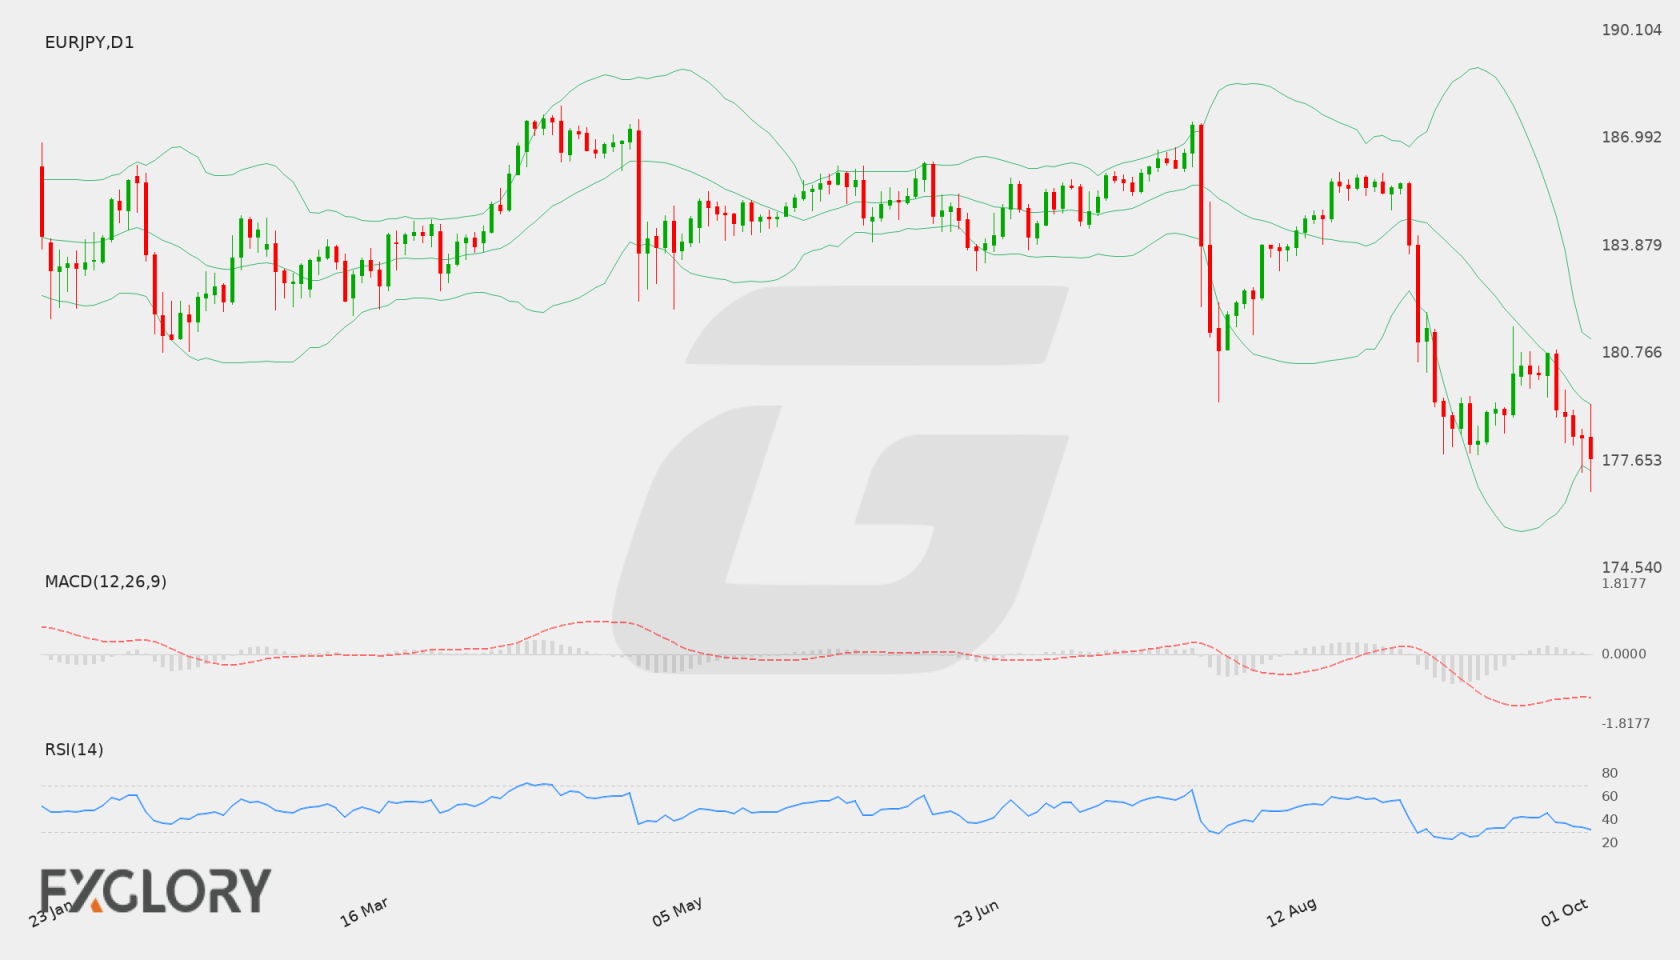
On the Daily (D1) chart, EUR/JPY has displayed a clear corrective trajectory, pushing down from recent swing highs to record a last close of 179.012. The series of lower daily closes demonstrates sustained selling pressure over recent sessions, though price action has shown signs of short-term stabilization just above key downside technical levels.
Key Technical Indicators:
Bollinger Bands: The D1 Bollinger Bands show a middle band at 182.069, an upper band at 188.387, and a lower band at 175.751. Trading at 179.012, EUR/JPY remains positioned in the lower half of the band structure below the 182.069 moving average, indicating persistent bearish pressure relative to its recent volatility range.
RSI: The 14-period RSI currently stands at 32.86. Operating close to the oversold boundary of 30, this reading reflects strong downward momentum while also warning that the selling wave may be approaching stretched technical territory.
MACD: The Daily MACD indicator prints a reading of -1.6026. This negative value beneath the signal line confirms that short-term momentum remains firmly under bearish control, with no clear bullish crossover established on the daily timeframe.
Support and Resistance:
Key technical reference points on the D1 chart feature immediate support around 177.835, which served as a recent floor. On the upside, main resistance is identified at 187.457, with the Bollinger middle band near 182.069 acting as an intermediate resistance level during any counter-trend recovery.
News to Watch for EURJPY This Week:
German Prelim CPI m/m: Tracks preliminary inflation shifts in Germany, offering early indications of wider Eurozone price pressures.
Tokyo Core CPI y/y: Evaluates underlying consumer price inflation in Tokyo, influencing expectations regarding Japanese monetary policy.
CPI Flash Estimate y/y: Reflects overall Eurozone consumer inflation figures, potentially driving price volatility for the Euro.
Weekly Outlook and Consideration:
EUR/JPY enters the upcoming trading week with a predominantly bearish stance on the daily chart, holding at 179.012. Technical indicators remain subdued, with MACD deep in negative territory at -1.6026 and RSI depressed at 32.86. Should price weakness persist, testing support at 177.835 remains a possibility. Conversely, any short-term retracement will likely encounter resistance near the 182.069 middle band before challenging upper resistance at 187.457. Market participants should monitor incoming European and Japanese inflation data for potential volatility catalysts.
Disclaimer: The analysis provided for EUR/JPY is for informational purposes only and does not constitute investment advice. Traders are encouraged to perform their own analysis and research before making any trading decisions. Market conditions can change quickly, so staying informed with the latest data is essential.