EURJPY Forecast

EUR/JPY Live Price

185.81600
-0.10%

EUR/JPY Forecast — 28 November 2025

Time Zone: GMT +2

Time Frame: 4 Hours (H4)

Fundamental Analysis:

Today’s EURJPY fundamental outlook is shaped by several critical economic data releases across both the Eurozone and Japan. The EUR side is under scrutiny as the market awaits multiple CPI reports from German states, French CPI, and retail sales figures, all of which are strong indicators of inflation and consumer spending—key drivers for ECB monetary policy decisions. Any surprises to the upside in inflation may support EUR strength. Additionally, a speech by Bundesbank President Nagel could provide hints regarding future ECB tightening, further adding to potential EUR volatility. On the JPY front, traders are watching closely for Tokyo CPI, unemployment rate, and industrial production—all scheduled today. These high-impact releases will gauge Japan’s inflationary pressures and economic momentum, potentially influencing BOJ policy expectations. Overall, volatility is expected due to the economic calendar being packed with price-sensitive data on both ends of the EUR/JPY pair.

Price Action:

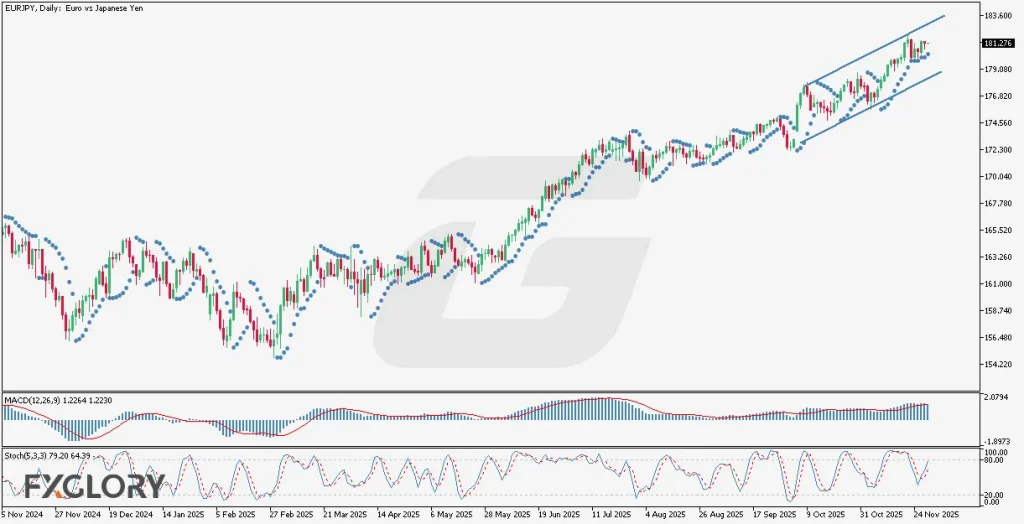
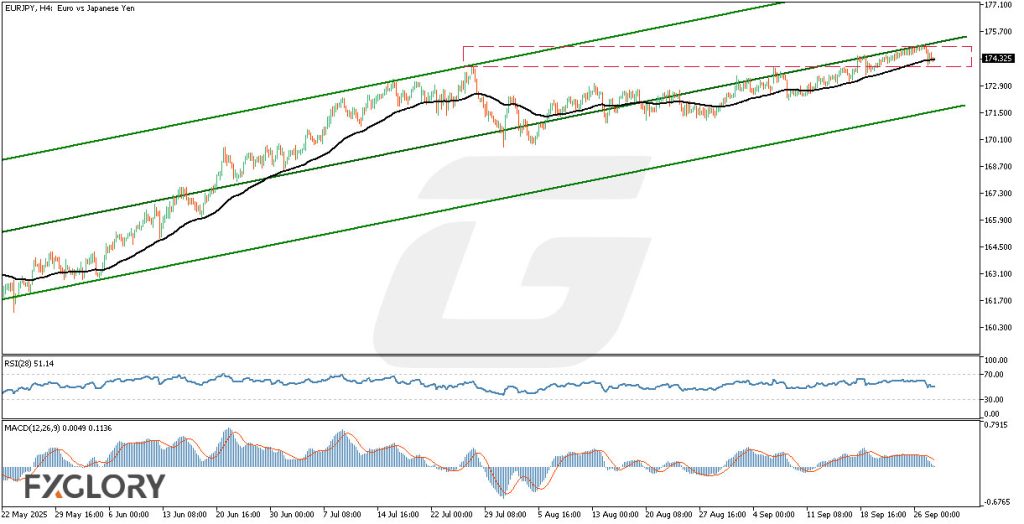
From a price action perspective on the EURJPY H4 chart, the pair is clearly trading in a strong bullish trend. Price has been advancing steadily within an upward-sloping parallel channel, respecting higher highs and higher lows. The candles remain positioned near the upper boundary of this channel, with no significant bearish rejections yet, signaling continued bullish momentum. Notably, the price is hovering around all-time highs (ATH), indicating strong buyer dominance and the potential for further breakout continuation if no reversal signals form. Minor consolidation may occur near resistance, but the trend structure remains firmly bullish unless support levels are breached decisively.

Key Technical Indicators:

Parabolic SAR (Step 0.05, Max 0.2): The Parabolic SAR dots are consistently below the candles, confirming the bullish trend. Their spacing reflects continued upward momentum with no immediate sign of reversal.

MACD (12,26,9): The MACD line at 1.2264 is above the signal line at 1.2230, maintaining a bullish crossover. The positive histogram bars suggest ongoing buying strength, though momentum is steady rather than accelerating.

Stochastic Oscillator (55,3,3): Currently reading 79.20 and 64.39, the Stochastic is approaching overbought territory. This implies possible short-term consolidation, but overall trend momentum remains intact above the midline.

Support and Resistance:

Support: The first strong support lies near 179.00, aligning with the lower boundary of the ascending channel and a recent consolidation zone.

Resistance: Immediate resistance is found near 183.50, representing the top of the ascending channel and current ATH pressure zone.

Conclusion and Consideration:

The EURJPY H4 chart continues to show a bullish technical and fundamental outlook. With price action maintaining a steep upward trajectory within a well-respected bullish channel, supported by confirming indicators like MACD and Parabolic SAR, the bias remains upward. The Stochastic Oscillator’s near-overbought reading signals caution, but it does not yet invalidate the trend. Traders should monitor upcoming high-impact news releases from both the Eurozone and Japan, particularly CPI and employment data, which could introduce volatility and shift sentiment. Breakouts above resistance may offer continuation setups, while a breakdown of channel support could trigger a correction., while a breakdown of channel support could trigger a correction.

Disclaimer: The analysis provided for EUR/JPY is for informational purposes only and does not constitute investment advice. Traders are encouraged to perform their own analysis and research before making any trading decisions on EURJPY. Market conditions can change quickly, so staying informed with the latest data is essential.

Analysis-Image-Watermark-Final-EURJPY-H4-Technical-and-Fundamental-Analysis-for-11.28.2025-

EUR/JPY Forecast — 29 September 2025

Time Zone: GMT +3

Time Frame: 4 Hours (H4)

Fundamental Analysis:

Today, EUR-JPY traders should be attentive to several key economic indicators and events affecting the Euro and the Japanese Yen. For the Euro (EUR), Destatis and INSEE releases, including the Import Price Index, Real Retail Sales, and Consumer Price Index (CPI), will significantly influence market sentiment. Additionally, ECB President Christine Lagarde and Deutsche Bundesbank President Joachim Nagel are due to speak, with traders closely monitoring their speeches for hints on future monetary policy direction. On the Japanese Yen (JPY) side, upcoming releases from METI regarding Industrial Production and Retail Trade, alongside MLIT’s data on Housing Starts, will provide essential indicators of Japan’s economic health, potentially influencing the Yen’s valuation.

Price Action:

The EUR/JPY pair demonstrates a bullish bias in the H4 timeframe. Price action shows an upward trend within a clearly defined ascending channel. Currently, EURJPY has reached the midline of the channel, and momentum appears moderate, suggesting a potential phase of consolidation or correction before resuming the uptrend towards the channel’s upper boundary.

Key Technical Indicators:

EMA (55): The 55-period Exponential Moving Average is positioned below the current price, acting as dynamic support, reinforcing the bullish sentiment. A break below the EMA would signal a possible reversal or deeper correction.

RSI (28): The RSI indicator currently stands at 51.14, indicating a neutral momentum state. There’s ample room for price movements in either direction, supporting the potential for short-term consolidation or mild retracement before a further directional decision.

MACD (12,26,9): The MACD histogram is slightly positive, showing reduced bullish momentum. The MACD line is very close to the signal line, implying the market could enter a period of sideways trading or mild downward correction if momentum continues to weaken.

Support and Resistance:

Support: Immediate support is located at approximately 173.00, aligning with recent consolidation zones and the EMA (55). Below this level, additional support is at 171.50.

Resistance: Immediate resistance stands at around 175.50, corresponding with recent swing highs. Further resistance is near the upper channel boundary at approximately 177.00.

Conclusion and Consideration:

EURJPY’s technical analysis on the H4 chart indicates sustained bullish sentiment but also highlights a potential temporary consolidation or correction. While technical indicators like EMA (55) and the ascending channel favor the bulls, RSI neutrality and weakening MACD momentum signal caution. Given significant upcoming economic news and speeches affecting both EUR and JPY, traders should prepare for possible volatility spikes. Attention should be paid to key support and resistance levels to guide trading decisions effectively.

Disclaimer: The analysis provided for EUR/JPY is for informational purposes only and does not constitute investment advice. Traders are encouraged to perform their own analysis and research before making any trading decisions on EURJPY. Market conditions can change quickly, so staying informed with the latest data is essential.

EURJPYH4_Technical_and_Fundamental_Analysis_For_2025-09-30-M

EUR/JPY Forecast — 7 September 2025

Time Zone: GMT +3

Time Frame: 4 Hours (H4)


Fundamental Analysis:

Today, key economic indicators from both Europe and Japan are scheduled for release, potentially influencing the EURJPY pair significantly. From Europe, Industrial Output and Foreign Trade Balance figures from Destatis are awaited, alongside the Sentix Investor Confidence index. Positive results here, exceeding forecasts, could bolster the Euro (EUR). Conversely, Japan’s financial calendar highlights changes in bank loans, current account balance, and consumer sentiment through the Eco Watchers Index. Stronger-than-expected Japanese data could strengthen the Japanese Yen (JPY), applying downward pressure on the EUR-JPY pair.

Price Action:

EUR/JPY is currently exhibiting clear bullish price action on the H4 chart. Following a prolonged consolidation phase within a symmetrical triangle pattern, the pair has broken decisively upwards. A robust bullish Marubozu candle confirms bullish momentum resurgence, implying that the correctional sideways phase has ended. Price is now targeting a retest of the recent high between 174.5 – 175.5, affirming a continuation of the established bullish trend.

Key Technical Indicators:

EMA (55): The Exponential Moving Average (55-period) is trending below the current price, acting as dynamic support. The EMA line provided recent support, further reinforcing bullish sentiment on the EURJPY H4 chart.

RSI (14): The Relative Strength Index currently stands at 66.6, suggesting the pair is approaching, but not yet at, overbought levels. This provides scope for further upside momentum before cautioning against potential exhaustion.

Stochastic Oscillator (5,3,3): The Stochastic indicator is at 59.43 and 43.05, indicating a neutral stance but with room for further bullish advancement. Traders should watch closely for upward crossovers to confirm continued bullish sentiment.

Support and Resistance:

Support: Immediate support is established at 172.50, aligning with the recent breakout point and the EMA (55). Further downside support can be found at the lower boundary of the previous consolidation pattern around 171.20.

Resistance: The near-term resistance lies between 174.5 and 175.5, coinciding with recent historical highs. Breaking through these levels could pave the way for significant bullish extensions.

Conclusion and Consideration:

The EUR-JPY H4 chart clearly supports a continuation of the bullish trend, underpinned by strong price action, EMA dynamics, and supportive RSI and Stochastic readings. However, traders must stay vigilant to fundamental economic news from Europe and Japan today, which could induce volatility. A sustained move above 174.5-175.5 would solidify the bullish outlook.

Disclaimer: The analysis provided for EUR/JPY is for informational purposes only and does not constitute investment advice. Traders are encouraged to perform their own analysis and research before making any trading decisions on EURJPY. Market conditions can change quickly, so staying informed with the latest data is essential.

EURJPYH4_Technical_and_Fundamental_Analysis_For_2025-09-08

EUR/JPY Forecast — 2 September 2025

Time Zone: GMT +3

Time Frame: 4 Hours (H4)


Fundamental Analysis:

Fundamental Analysis: The EUR-JPY currency pair represents the valuation between the Euro (EUR) and the Japanese Yen (JPY). Today, Eurozone data highlights include the release of key inflation indicators (CPI and Core CPI) by Eurostat, potentially causing significant volatility in EUR pairs. Traders will closely monitor remarks from Deutsche Bundesbank President Joachim Nagel for insights on future ECB monetary policy directions. Concurrently, JPY traders await updates on the Bank of Japan’s monetary base and the Japanese Government Bond auction, essential indicators that may impact the Yen significantly.

Price Action:

The EUR/JPY H4 chart illustrates a clear bullish momentum, recently breaking above a horizontal consolidation channel. Despite the consistent bullish price action, traders should prepare for potential corrective moves towards Fibonacci retracement levels of 23.6%, 38.2%, or even 50.0%. Immediate bullish targets are set around the previous high at 172.826 or the subsequent resistance at 173.592. Traders are advised to confirm a sustained breakout for further bullish continuation.

Key Technical Indicators:

MACD (Moving Average Convergence Divergence): The MACD indicator shows bullish momentum, with a signal line currently at 0.0996 and the histogram positively positioned at 0.2028. This indicates ongoing buyer dominance but suggests vigilance for signs of momentum exhaustion or reversal signals.

RSI (Relative Strength Index): The RSI level is currently at 66.53, approaching the overbought threshold. Although bullish momentum persists, RSI readings near overbought conditions highlight the possibility of a short-term retracement or consolidation phase.

Support and Resistance:

Support: Immediate support levels lie at Fibonacci retracement levels, notably at 172.130 (23.6%) and further down at 171.685 (38.2%).

Resistance: Primary resistance targets include the recent high at 172.826 and the more significant resistance level at 173.592.

Conclusion and Consideration:

The EURJPY pair maintains bullish momentum on the H4 timeframe, supported by favorable MACD and RSI indications. However, price actions near resistance zones and potential overbought signals suggest caution. Upcoming economic news from both the Eurozone and Japan could introduce substantial volatility, emphasizing the importance of risk management and close monitoring of key technical levels.

Disclaimer: The analysis provided for EUR/JPY is for informational purposes only and does not constitute investment advice. Traders are encouraged to perform their own analysis and research before making any trading decisions on EURJPY. Market conditions can change quickly, so staying informed with the latest data is essential.

EURJPYH4_Technical_and_Fundamental_Analysis_For_2025-09-02

EUR/JPY Forecast — 4 November 2024

Time Zone: GMT +2

Time Frame: 4 Hours (H4)

Fundamental Analysis:

The EURJPY pair faces a fundamental backdrop characterized by key economic data releases. For the Euro, today’s focus will be on several Purchasing Managers’ Index (PMI) reports. These PMIs are leading indicators of economic health and can drive volatility if the data significantly diverges from expectations. The higher-than-expected PMI readings would indicate economic expansion, potentially bolstering the Euro, while weaker-than-expected numbers could depress it. In contrast, the Japanese Yen is likely to experience lower liquidity and irregular market activity as Japanese banks remain closed for Culture Day. This could lead to increased market volatility as traders respond to economic data from the Eurozone.

Price Action:

In the H4 timeframe, EURJPY has been trading within an ascending channel, showing steady bullish momentum over the past few weeks. The recent candles display consolidation near the upper boundary of this channel, indicating a potential struggle between buyers and sellers. The price is hovering in the lower half of the Bollinger Bands, suggesting a correction phase. Despite this, the bullish trendline has held, providing dynamic support. The Parabolic SAR’s placement above the candles signals bearish pressure, warranting caution for a potential trend reversal.

Key Technical Indicators:

Bollinger Bands: The price is currently in the lower half of the Bollinger Bands, suggesting a bearish sentiment or a potential bounce from oversold levels. A move to the middle or lower band could confirm the direction.

MACD (Moving Average Convergence Divergence): The MACD shows a weakening bullish trend as the histogram shrinks, signaling fading buying pressure. A bearish crossover could indicate a shift in momentum.

RVI (Relative Volatility Index): The RVI lines are close, indicating market indecision and a lack of strong directional movement. This supports the current consolidation in price action.

Parabolic SAR: The Parabolic SAR’s last two dots above the candles indicate emerging bearish pressure. A continuation below could signal further downside risk.

%R (Williams %R): The %R at -80.16 shows the pair is in oversold territory, hinting at a potential rebound. However, extended oversold conditions may sustain bearish momentum.

Support and Resistance Levels:

Support: Immediate support is seen at 164.880, aligning with the 61.8% Fibonacci retracement level. A break below this level could drive the price towards the 50.0% Fibonacci retracement at 163.320.

Resistance: The nearest resistance level stands at 166.440, marked by the upper boundary of the ascending channel. A breach above this level could open the path to the next resistance near 167.220.

Conclusion and Consideration:

The EURJPY pair on the H4 chart exhibits a mixed outlook. While the overall trend has been bullish within the ascending channel, key indicators like the Parabolic SAR and MACD suggest that momentum is fading, with bearish signals emerging. The upcoming economic data for the Euro and low liquidity for the Yen due to the Japanese holiday add an element of unpredictability. Traders should be prepared for potential breakouts and consider setting stop losses carefully. Monitoring economic indicators and news events will be crucial in navigating the current market environment.

Disclaimer: The analysis provided for EUR/JPY is for informational purposes only and does not constitute investment advice. Traders are encouraged to perform their own analysis and research before making any trading decisions on EURJPY. Market conditions can change quickly, so staying informed with the latest data is essential.

FXGlory

11.04.2024

EURJPY_H4_analysis for 11/04

1EUR = –––JPY –––%
EURJPY
Loading chart...