
GOLD Forecast

GOLD iconUSD icon
Gold

SPOT Gold Ounce vs US Dollar

Gold Live Price

4158.82000
-0.42%

Gold Forecast — 3 October 2026

Time Zone: GMT +3

Time Frame: Daily (D1) / Weekly Outlook

Weekly Fundamental Overview:

Gold (GOLD) trading dynamics continue to be shaped by broader economic conditions, monetary policy expectations, and safe-haven flows. Market participants remain focused on incoming macroeconomic reports and central bank policy sentiment to assess future price direction.

Price Action:

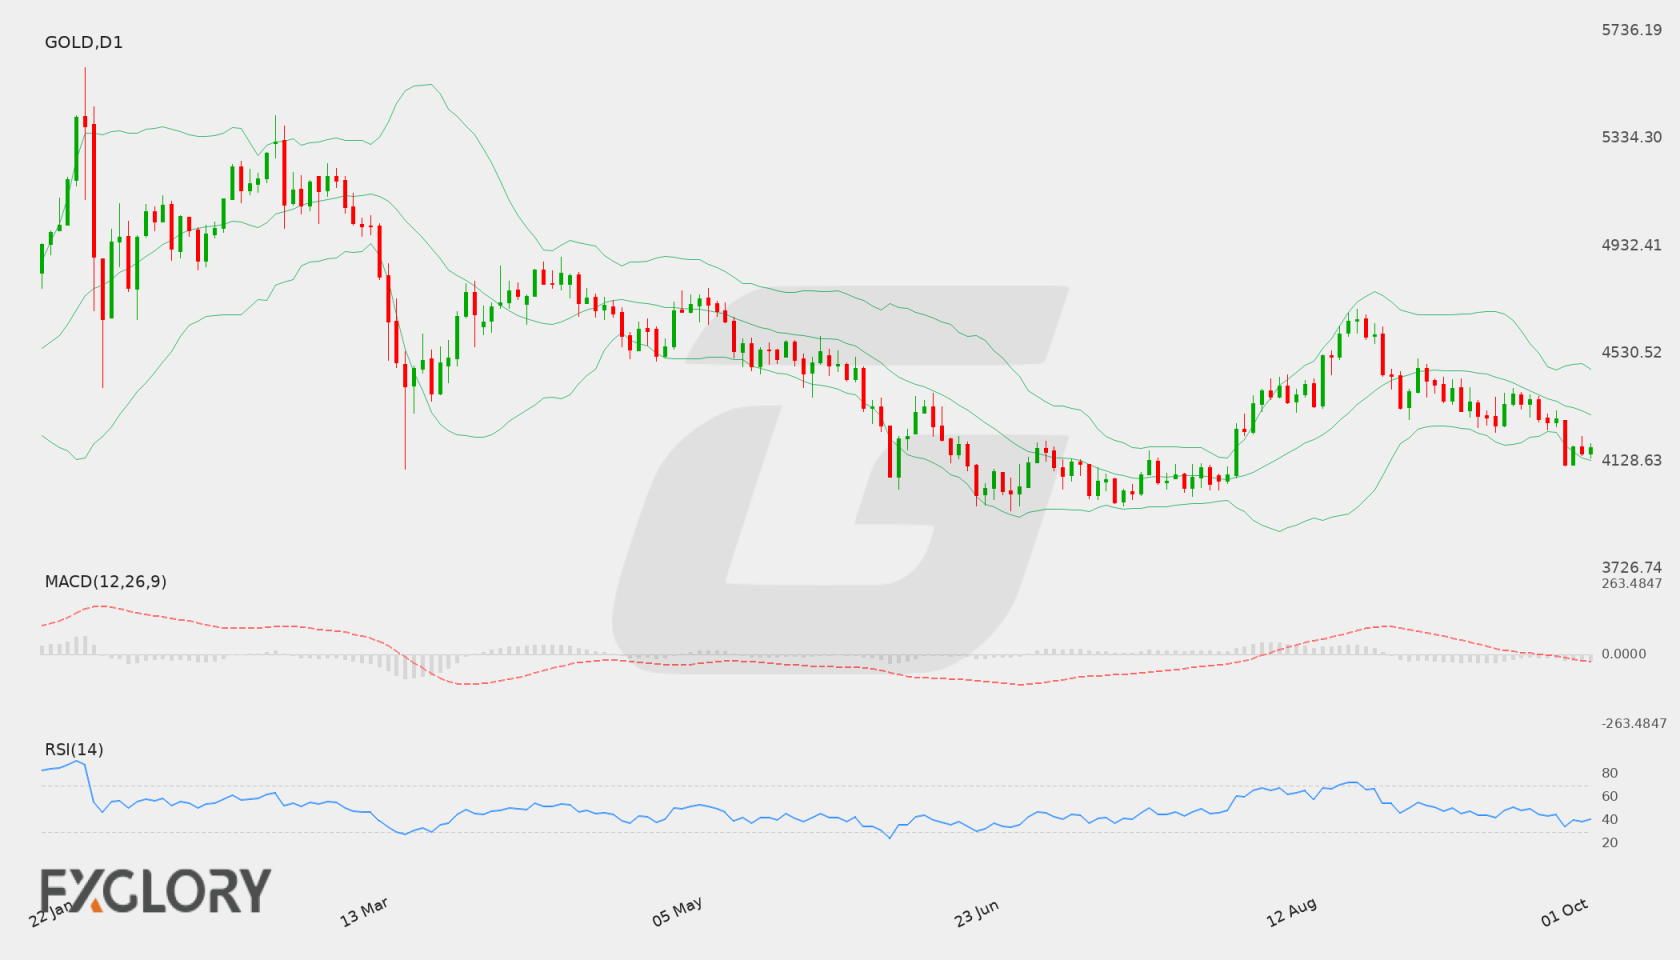
Gold (GOLD) recently rebounded from a daily low of 4110.73 to finish at a last close of 4177.45. The price action demonstrates short-term stabilization following an extended decline from higher levels recorded earlier in the chart series.

Key Technical Indicators:

Bollinger Bands: On the daily chart, the Bollinger Bands middle line sits at 4301.00, with the upper band at 4471.29 and the lower band at 4130.71. With Gold (GOLD) closing at 4177.45, price is trading in the lower half of the band structure just above the lower band boundary.

RSI: The 14-day Relative Strength Index (RSI) is positioned at 40.61, indicating a subdued momentum environment below the midpoint while staying outside of oversold territory.

MACD: The MACD indicator is currently recorded at -51.07, remaining below the zero threshold and reflecting lingering negative momentum across the daily timeframe.

Support and Resistance:

Key technical reference points for Gold (GOLD) include daily support at 3959.49 and daily resistance at 4696.65.

News to Watch for GOLD This Week:

  • ISM Services PMI: This release measures business conditions in the services sector and can drive volatility in Gold.
  • FOMC Meeting Minutes: Insights from monetary policymakers could influence interest rate outlooks and valuation for Gold.
  • Unemployment Claims: Weekly jobless figures provide insight into economic resilience and safe-haven flows for Gold.
  • Prelim UoM Inflation Expectations: Changing inflation views can shape sentiment around Gold demand.
  • Prelim UoM Consumer Sentiment: Household confidence metrics may alter market risk appetite and precious metal positioning.

Weekly Outlook and Consideration:

The weekly outlook for Gold (GOLD) remains guarded as the daily MACD at -51.07 and RSI at 40.61 signal ongoing downside pressure. Price closed at 4177.45, maintaining a position below the Bollinger middle band of 4301.00 yet holding above the lower band at 4130.71. If buyers maintain traction above the lower band, price could attempt a consolidation move toward the 4301.00 middle boundary. Conversely, prolonged weakness could lead to tests of deeper technical support at 3959.49. To shift the broader technical picture, price would need to regain substantial ground toward the primary resistance level of 4696.65. High-impact economic releases this week may provide further catalysts for price behavior.

Disclaimer: The analysis provided for Gold is for informational purposes only and does not constitute investment advice. Traders are encouraged to perform their own analysis and research before making any trading decisions. Market conditions can change quickly, so staying informed with the latest data is essential.
Gold D1 technical analysis chart
Gold D1 Technical Analysis for 10.03.2026

Gold Forecast — 27 September 2026

Time Zone: GMT +3

Time Frame: Daily (D1) / Weekly Outlook

Weekly Fundamental Overview:

Broader macroeconomic conditions and market sentiment continue to influence Gold (GOLD). Shifting economic forecasts and inflation expectations may impact investor appetite for precious metals in the coming trading sessions.

Price Action:

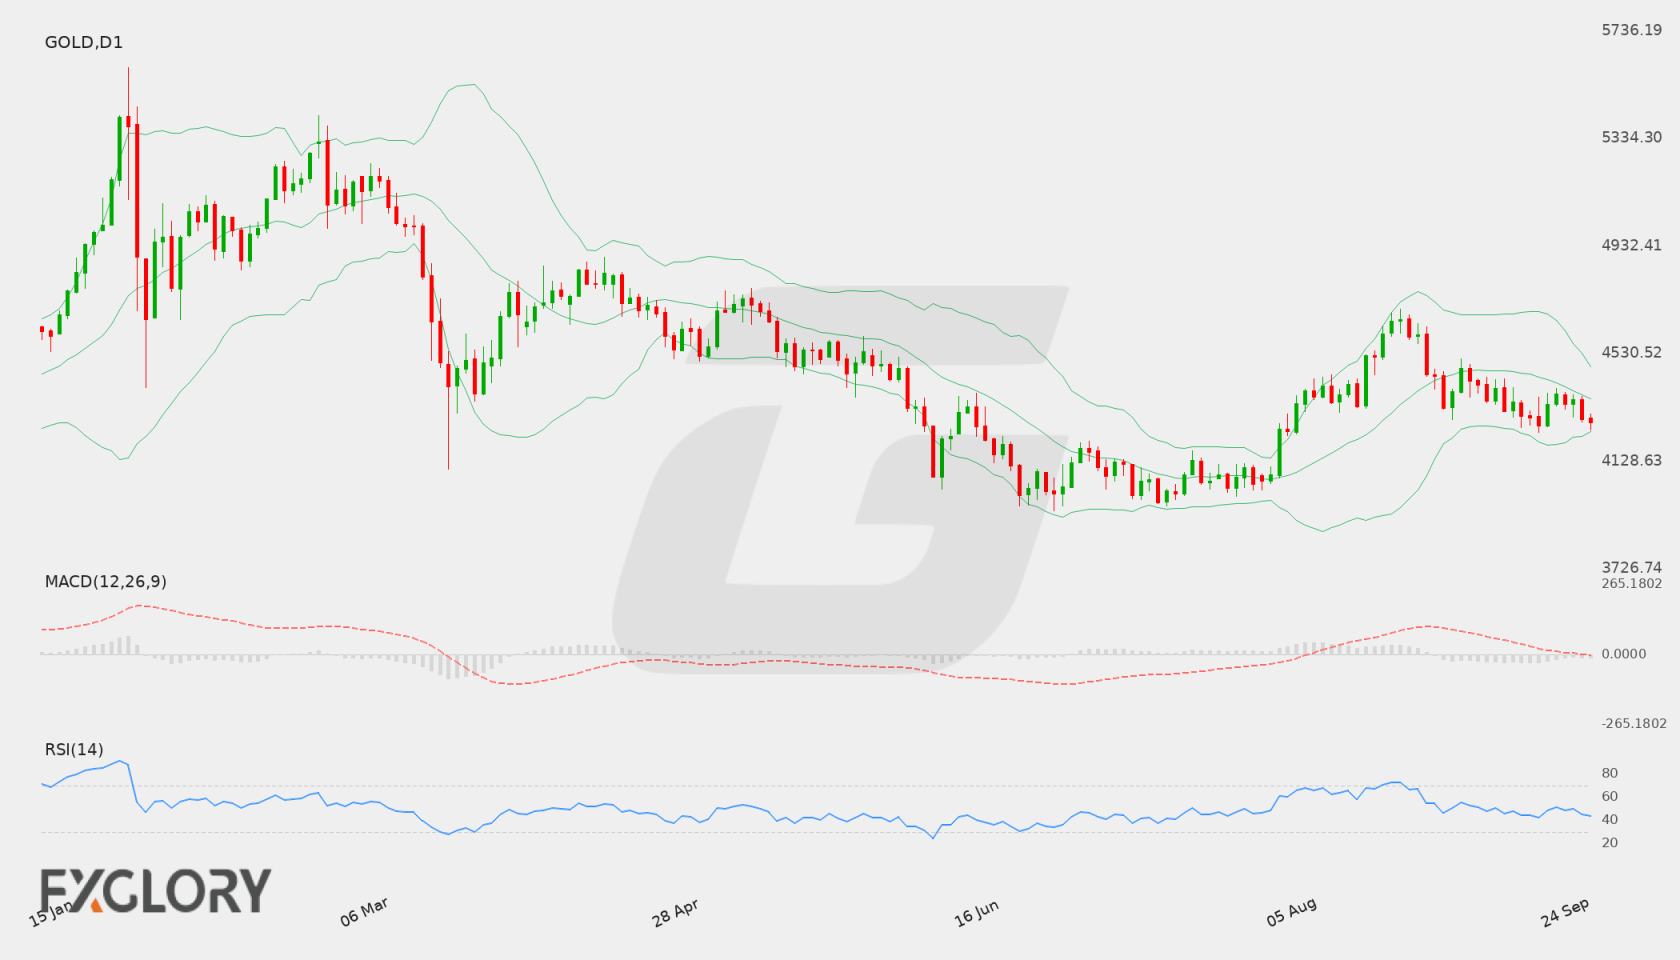
On the daily (D1) chart, Gold (GOLD) closed at 4274.89, following a gradual decline from recent highs near 4377.75. The recent daily candlesticks demonstrate persistent selling pressure as the asset trades closer to its lower boundary.

Key Technical Indicators:

Bollinger Bands: The D1 Bollinger Bands show the middle band at 4359.71, the upper band at 4481.26, and the lower band at 4238.17. Gold (GOLD) is trading below the middle band and approaching the lower band at its last close of 4274.89, reflecting downside momentum within the current volatility range.

RSI: The 14-day Relative Strength Index (RSI) stands at 43.71. Being below the 50 mark, this indicator signals moderate bearish sentiment without crossing into oversold conditions.

MACD: The D1 MACD indicator is currently reading -17.48. Remaining below zero, the negative value indicates ongoing bearish momentum across recent daily periods.

Support and Resistance:

Key technical levels on the daily chart show main support at 3959.49 and primary resistance at 4696.65. Price movement near these thresholds could determine the next significant trend direction.

News to Watch for GOLD This Week:

  • ISM Manufacturing PMI: This indicator assesses manufacturing sector health and may influence market sentiment regarding economic growth.
  • ISM Manufacturing Prices: This metric reflects cost pressures in manufacturing which can impact inflation outlooks and precious metal valuation.

Weekly Outlook and Consideration:

Gold (GOLD) approaches the new trading week under moderate bearish pressure, closing at 4274.89 below its daily Bollinger middle band of 4359.71. Technical indicators support a cautious outlook, with the RSI at 43.71 and MACD at -17.48. If downward momentum persists, price may move toward the primary support level at 3959.49. Alternatively, a move above the middle band could see price testing resistance toward 4696.65.

Disclaimer: The analysis provided for Gold is for informational purposes only and does not constitute investment advice. Traders are encouraged to perform their own analysis and research before making any trading decisions. Market conditions can change quickly, so staying informed with the latest data is essential.
Gold D1 technical analysis chart
Gold D1 Technical Analysis for 09.27.2026

Gold Forecast — 20 September 2026

Time Zone: GMT +3

Time Frame: Daily (D1) / Weekly Outlook

Weekly Fundamental Overview:

Gold (GOLD) traders face a pivotal week dominated by significant economic indicators. Broader market interest rate expectations and economic sentiment remain primary drivers, as market participants closely monitor upcoming data releases for potential shifts in valuation.

Price Action:

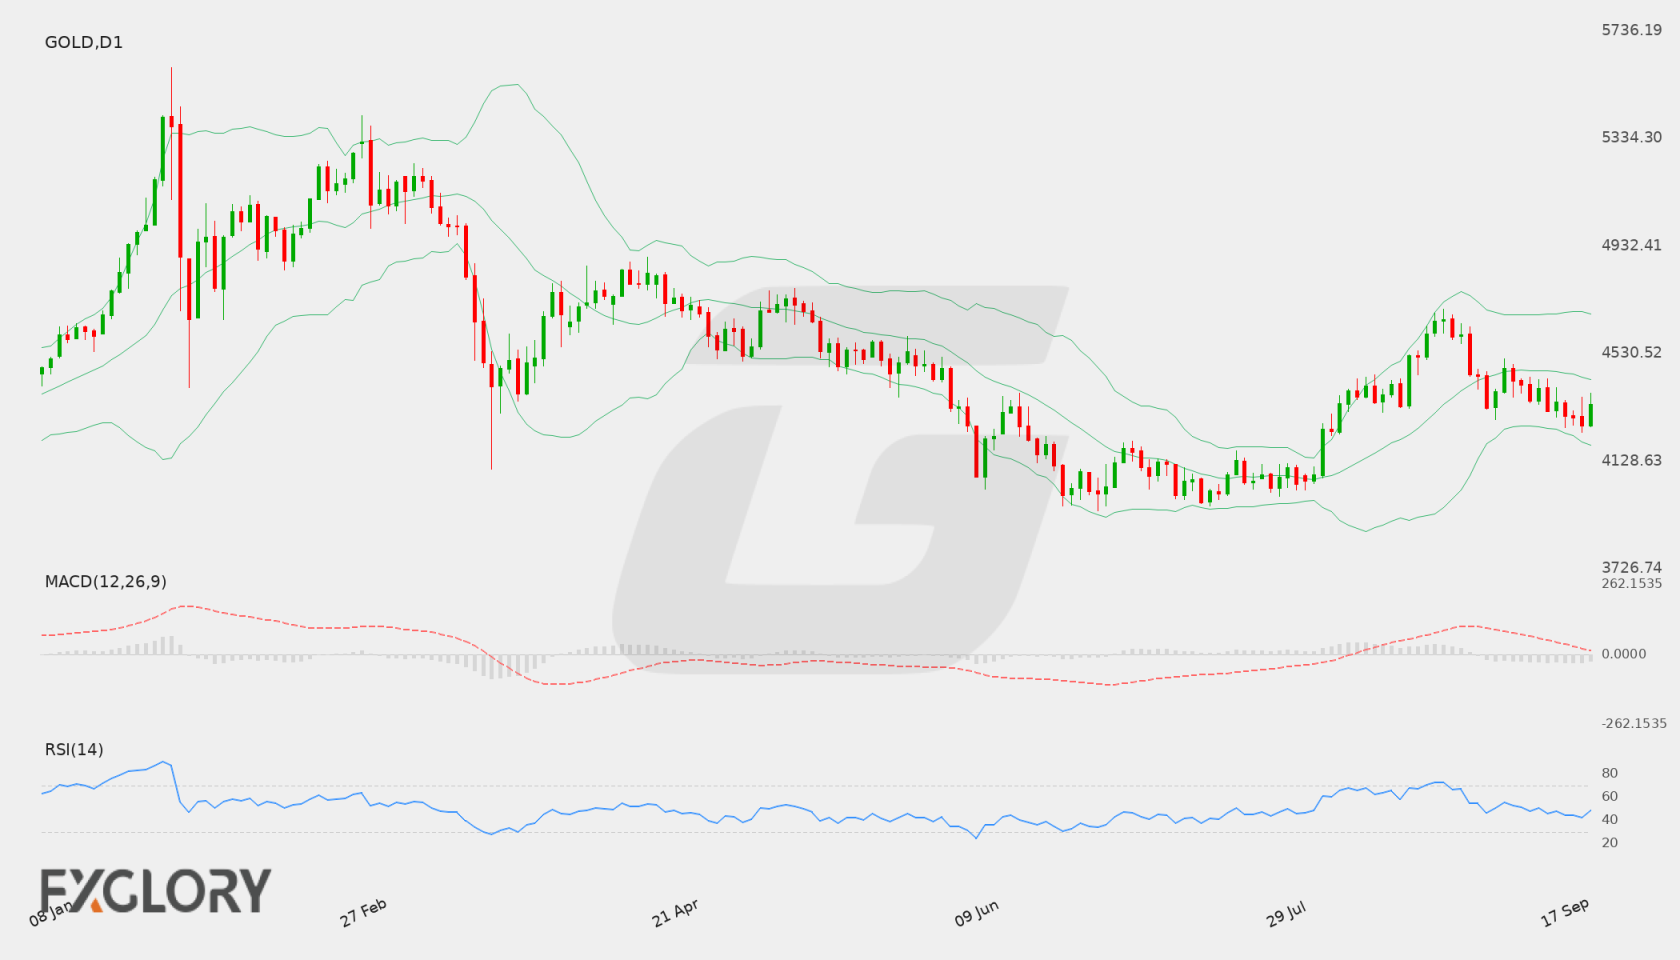
Gold (GOLD) closed its recent daily trading session at 4341.16, moving higher from a daily low of 4257.39 and peaking at 4381.06. Price action shows a modest recovery after declining from prior highs above 4650, indicating a period of stabilization around the 4300 to 4340 level.

Key Technical Indicators:

Bollinger Bands: On the daily chart, the Bollinger Bands display a middle band at 4433.01, an upper band at 4677.70, and a lower band at 4188.31. Gold (GOLD) is trading below the middle band, reflecting persistent mild downward pressure within the channel.

RSI: The 14-day Relative Strength Index (RSI) stands at 48.39, holding in neutral territory and indicating a balance between buying and selling pressure without entering overbought or oversold zones.

MACD: The Daily MACD indicator for Gold (GOLD) is at -11.39, remaining beneath the zero threshold and indicating active bearish momentum despite the recent upward day.

Support and Resistance:

Primary technical levels for Gold (GOLD) feature major support at 3943.33 and major resistance at 4696.65. Dynamic levels are anchored by the lower Bollinger band at 4188.31 and the middle band at 4433.01.

News to Watch for GOLD This Week:

  • CB Consumer Confidence: Tracks consumer economic sentiment which can influence US Dollar strength and precious metals pricing.
  • JOLTS Job Openings: Measures labor market demand and shifts general market risk preference.
  • ADP Non-Farm Employment Change: Provides key private sector employment insights that sway market expectations ahead of official labor data.
  • Core PCE Price Index m/m: Serves as a vital inflation metric that impacts monetary policy expectations for non-yielding assets.
  • Final GDP q/q: Indicates overall economic growth and reflects broader economic stability.
  • ISM Manufacturing PMI: Assesses manufacturing sector activity to gauge macroeconomic strength.
  • Average Hourly Earnings m/m: Reflects wage inflation trends that influence future central bank interest rate decisions.
  • Non-Farm Employment Change: Details net employment shifts that drive substantial volatility across asset classes.
  • Unemployment Rate: Highlights overall labor market health and guides broad market sentiment.

Weekly Outlook and Consideration:

The weekly outlook for Gold (GOLD) remains neutral to cautious while price holds below the daily Bollinger middle band of 4433.01. With the MACD in negative territory at -11.39 and RSI balanced at 48.39, a sustained move above 4433.01 could open the path toward resistance at 4696.65. Conversely, renewed selling pressure could drive price back down toward the lower Bollinger band at 4188.31 and key support at 3943.33.

Disclaimer: The analysis provided for Gold is for informational purposes only and does not constitute investment advice. Traders are encouraged to perform their own analysis and research before making any trading decisions. Market conditions can change quickly, so staying informed with the latest data is essential.
Gold D1 technical analysis chart
Gold D1 Technical Analysis for 09.20.2026

Gold Forecast — 12 September 2026

Time Zone: GMT +3

Time Frame: Daily (D1) / Weekly Outlook

Weekly Fundamental Overview:

Gold (GOLD) is navigating key macroeconomic catalysts, with upcoming U.S. economic data releases and central bank announcements driving market sentiment. Investors are paying close attention to consumer spending indicators, monetary policy shifts, and labor market trends that could influence non-yielding bullion demand.

Price Action:

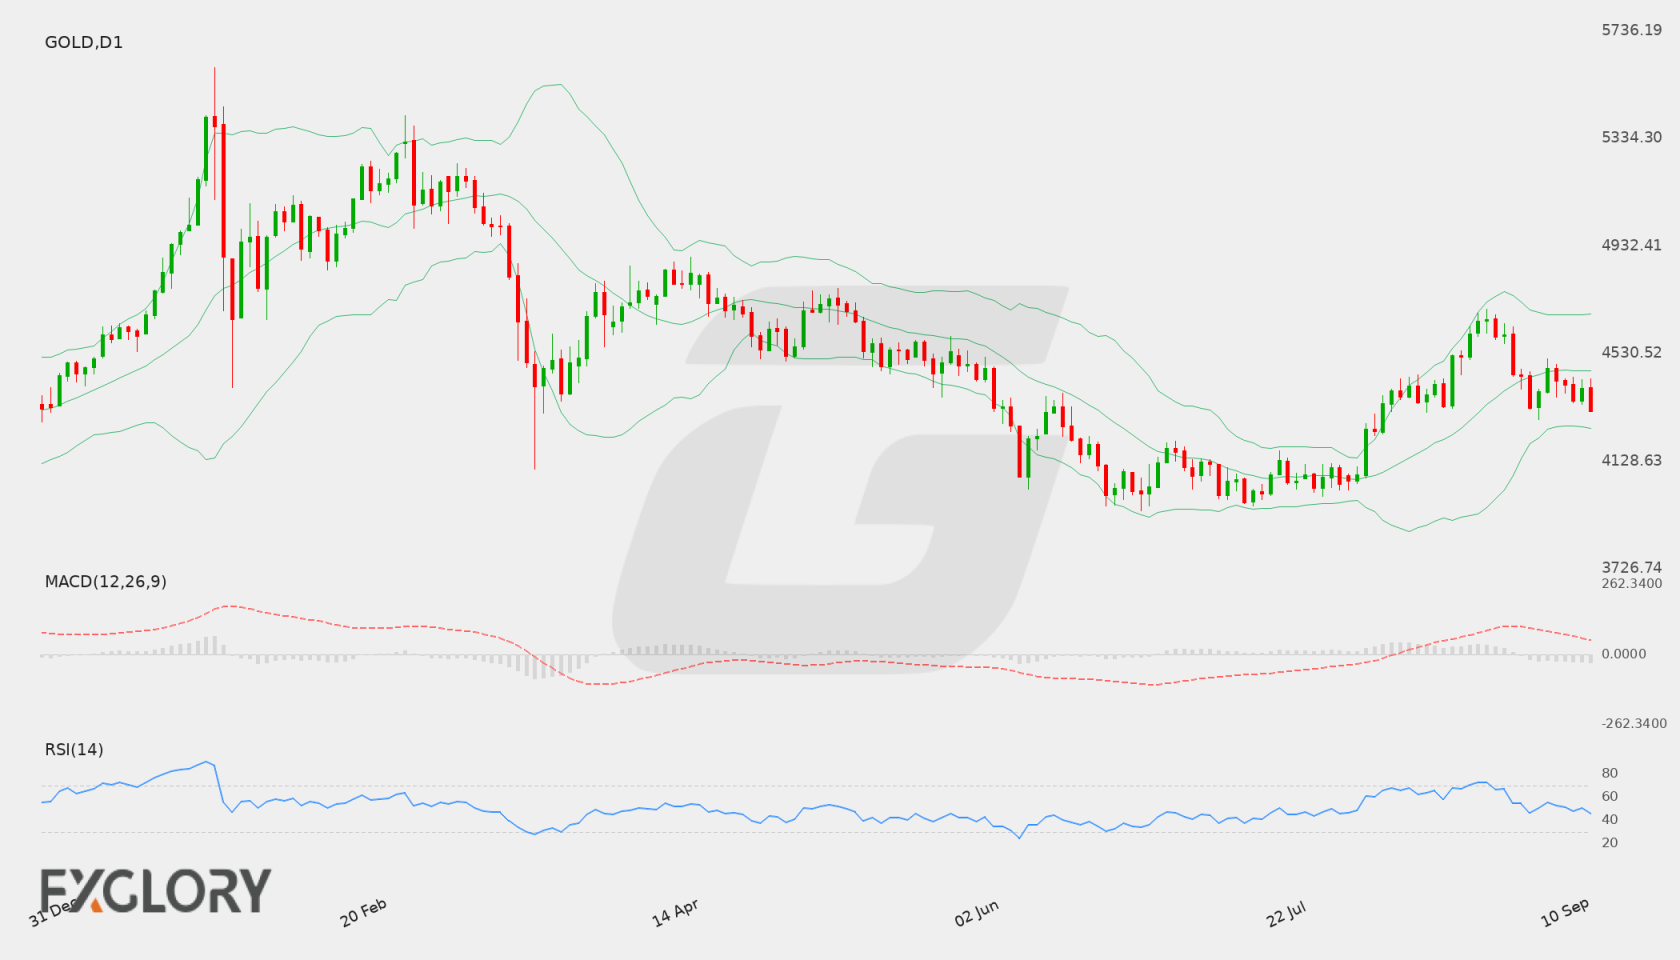
On the Daily (D1) chart, Gold (GOLD) settled at 4317.16 after pulling back from recent swing highs near 4696.65. The asset has shown increased downside pressure, testing lower boundaries after fluctuating between the 4300 and 4470 levels over recent trading sessions.

Key Technical Indicators:

Bollinger Bands: The Bollinger Bands indicator shows the middle band at 4464.21, with the upper band at 4676.92 and the lower band at 4251.50. With Gold trading at 4317.16 below the middle band, price action is drifting toward the lower envelope, indicating a moderate bearish tilt within the wider channel.

RSI: The 14-day Relative Strength Index (RSI) is recorded at 45.31. Operating in neutral territory below the 50 level, it highlights a slight bearish tilt without signaling oversold conditions.

MACD: The MACD line stands at 20.98. While remaining above the zero line, momentum has weakened compared to previous upward swings, reflecting diminishing bullish pressure as price consolidates downwards.

Support and Resistance:

Immediate technical resistance for Gold (GOLD) is located at 4696.65, while primary technical support is established at 3943.33.

News to Watch for GOLD This Week:

  • Core Retail Sales m/m: Measures core consumer spending trends which can shift market sentiment and impact precious metals demand.
  • Retail Sales m/m: Tracks broader consumer spending activity that influences economic outlooks and currency valuations.
  • FOMC Economic Projections: Provides central bank forecasts on growth and inflation, affecting rate expectations.
  • FOMC Statement: Offers insights into monetary policy stance and future rate decision trajectory.
  • Federal Funds Rate: Details official policy interest rate decision which directly influences Gold non-yielding appeal.
  • FOMC Press Conference: Features central bank commentary explaining monetary policy shifts and economic risks.
  • Unemployment Claims: Indicates labor market strength and broader economic conditions impacting safe-haven appetite.

Weekly Outlook and Consideration:

Gold (GOLD) enters the week under mild downside pressure, trading at 4317.16 below its Daily middle Bollinger Band of 4464.21. Neutral RSI at 45.31 and an easing MACD at 20.98 suggest consolidation with potential for further testing toward the lower Bollinger Band around 4251.50 or key support at 3943.33. Conversely, a reversal back above 4464.21 could reopen momentum toward key resistance at 4696.65. Upcoming Federal Reserve announcements and retail sales figures will likely dictate short-term directional bias.

Disclaimer: The analysis provided for Gold is for informational purposes only and does not constitute investment advice. Traders are encouraged to perform their own analysis and research before making any trading decisions. Market conditions can change quickly, so staying informed with the latest data is essential.
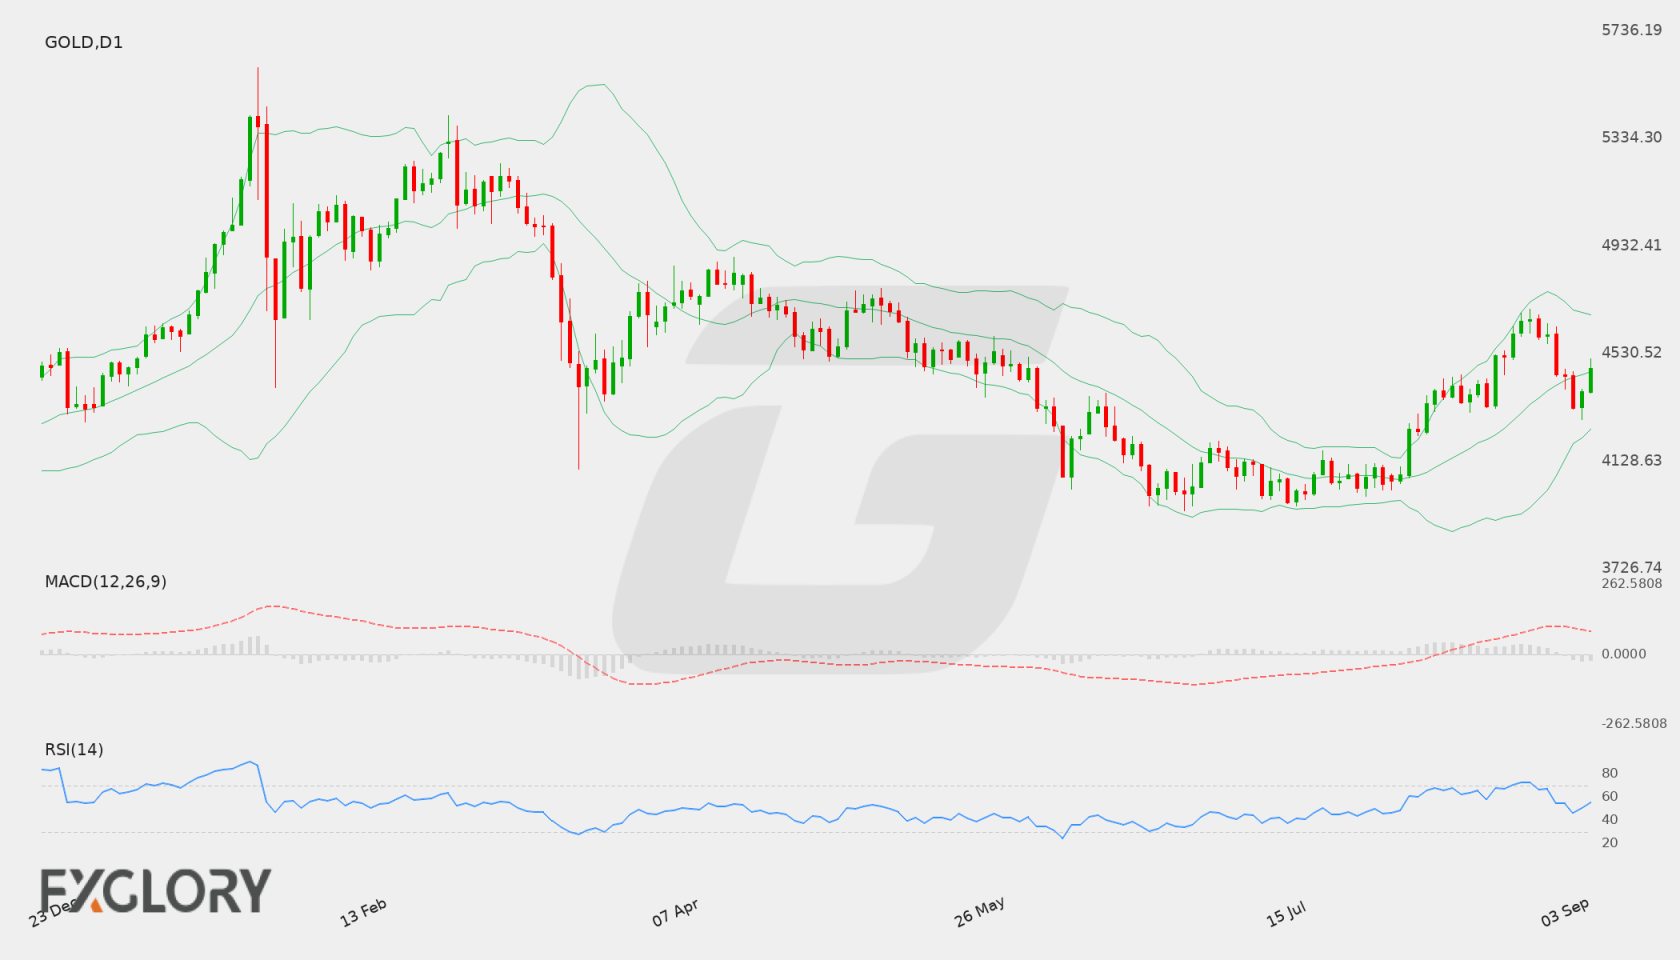
Gold D1 technical analysis chart
Gold D1 Technical Analysis for 09.12.2026

Gold Forecast — 5 September 2026

Time Zone: GMT +3

Time Frame: Daily (D1) / Weekly Outlook

Weekly Fundamental Overview:

Gold (GOLD) performance continues to be influenced by macroeconomic indicators and broader economic market data releases. Incoming US inflation metrics, labor market statistics, and economic sentiment indicators play a central role in guiding trader sentiment and driving price fluctuations across precious metals.

Price Action:

On the daily timeframe, Gold (GOLD) recorded a close at 4472.91 after pulling back from a recent swing high near 4696.65. Recent price action demonstrates stabilization above key short-term levels as price consolidates around the middle section of the recent overall trading range.

Key Technical Indicators:

Bollinger Bands: The daily Bollinger Bands reveal a middle band at 4461.25, an upper band at 4676.01, and a lower band at 4246.49. With the latest close at 4472.91 positioned slightly above the middle band, Gold exhibits a balanced-to-slightly-bullish positioning within the technical bands.

RSI: The 14-day Relative Strength Index (RSI) stands at 55.18. Situated near the mid-range above 50, this indicator reflects mild upward bias without signaling overbought or oversold extreme conditions.

MACD: The MACD indicator is currently situated at 62.62, holding a positive value above the zero signal baseline. This confirms that positive momentum remains active on the daily chart, though price action requires monitoring for any deceleration or signal crossovers.

Support and Resistance:

Key daily chart levels for Gold (GOLD) feature primary support at 3943.33 and major resistance at 4696.65. Dynamic boundary zones are highlighted by the upper Bollinger Band at 4676.01 and lower Bollinger Band at 4246.49.

News to Watch for GOLD This Week:

  • PPI m/m: Measures changes in wholesale inflation pressures that can impact broader price trends.
  • Core PPI m/m: Tracks wholesale price changes excluding volatile sectors to gauge core inflation trends.
  • Unemployment Claims: Evaluates weekly labor market health and broad economic momentum.
  • Core CPI m/m: Assesses core consumer price changes that directly influence monetary policy outlooks.
  • CPI y/y: Highlights annual consumer inflation trends to gauge overall cost-of-living adjustments.
  • Core CPI y/y: Measures long-term core consumer price inflation excluding food and energy.
  • CPI m/m: Tracks monthly shifts in consumer prices that can drive immediate market volatility.
  • Prelim UoM Inflation Expectations: Reflects consumer expectations for future inflation rate paths.
  • Prelim UoM Consumer Sentiment: Indicates broad household economic confidence and future spending prospects.

Weekly Outlook and Consideration:

Gold (GOLD) carries a moderately constructive daily outlook while price trades above the middle Bollinger Band of 4461.25, ending the session at 4472.91. An RSI of 55.18 and MACD at 62.62 align with ongoing underlying stability. Continued trading above 4461.25 may encourage further retests toward resistance at 4696.65 near the 4676.01 upper band. If sellers regain control and push price below 4461.25, attention may turn toward lower Bollinger support at 4246.49, with deeper support located at 3943.33.

Disclaimer: The analysis provided for Gold is for informational purposes only and does not constitute investment advice. Traders are encouraged to perform their own analysis and research before making any trading decisions. Market conditions can change quickly, so staying informed with the latest data is essential.

Gold D1 technical analysis chart
Gold D1 Technical Analysis for 09.05.2026
1GOLD = –––USD –––% ▼
GOLD
Loading chart...