
AUDNZD Forecast

AUD iconNZD icon
AUD/NZD

Australian Dollar vs New Zealand Dollar

AUD/NZD Live Price

1.23413
+0.07%

AUD/NZD Forecast — 5 September 2026

Time Zone: GMT +3

Time Frame: Daily (D1) / Weekly Outlook

Weekly Fundamental Overview:

The AUD/NZD currency pair reflects shifting economic momentum and rate differentials between Australia and New Zealand. Relative economic performance and policy directions from both central banks remain primary macro drivers influencing market sentiment.

Price Action:

On the Daily (D1) timeframe, AUD/NZD has staged a significant upward move, advancing from recent consolidation levels near 1.19803 up to a recent peak of 1.22464 before closing at 1.22397. This sharp gain brings price action close to major overhead resistance.

Key Technical Indicators:

Bollinger Bands: The 20-day Bollinger Bands display a middle line at 1.20557, a lower band at 1.19010, and an upper band at 1.22105. Trading at 1.22397 places the price above the upper band, highlighting strong upside volatility and momentum.

RSI: The 14-day Relative Strength Index (RSI) reads 71.23, entering overbought territory above the 70 threshold, which underscores powerful buying interest while signaling potential vulnerability to a short-term pause or pullback.

MACD: The MACD value is positive at 0.004019, indicating an established bullish trajectory on the daily chart as the histogram and signal lines maintain positive momentum.

Support and Resistance:

Key technical levels for AUD/NZD highlight key structural support at 1.19102 and overhead resistance at 1.22826 on the daily chart.

News to Watch for AUDNZD This Week:

  • GDP q/q: Quarterly economic growth data for New Zealand could influence central bank monetary policy expectations and impact regional currency momentum.

Weekly Outlook and Consideration:

AUD/NZD carries firm bullish momentum into the week, driven by strong daily gains and price action pushing beyond the upper Bollinger Band of 1.22105. Should buyers clear immediate resistance at 1.22826, the pair could extend its upward trajectory. However, with RSI in overbought territory at 71.23, traders should watch for potential retracements toward the middle Bollinger Band at 1.20557 or key support near 1.19102.

Disclaimer: The analysis provided for AUD/NZD is for informational purposes only and does not constitute investment advice. Traders are encouraged to perform their own analysis and research before making any trading decisions. Market conditions can change quickly, so staying informed with the latest data is essential.
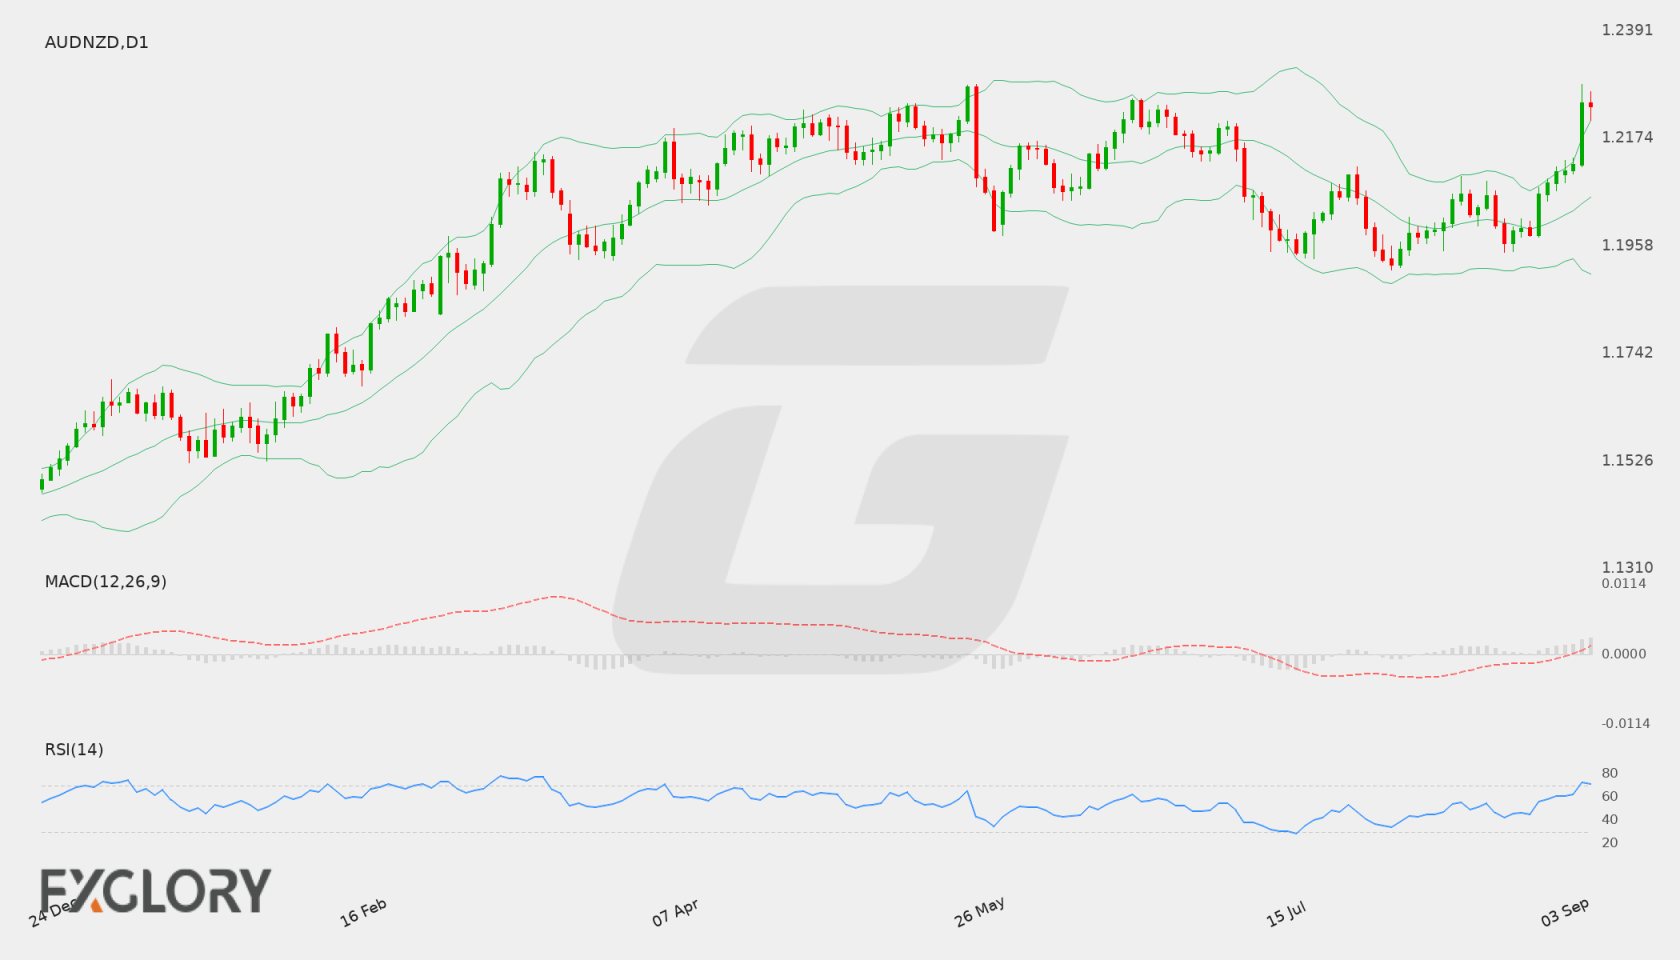
AUD/NZD D1 technical analysis chart
AUD/NZD D1 Technical Analysis for 09.05.2026

AUD/NZD Forecast — 29 August 2026

Time Zone: GMT +3

Time Frame: Daily (D1) / Weekly Outlook

Weekly Fundamental Overview:

The fundamental background for AUD/NZD is driven by key domestic releases and central bank actions. Upcoming data includes Australian GDP q/q along with major monetary policy decisions from New Zealand, such as the Official Cash Rate, RBNZ Rate Statement, RBNZ Monetary Policy Statement, and the RBNZ Press Conference, which could influence interest rate expectations and currency valuation.

Price Action:

On the daily D1 timeframe, AUD/NZD recently advanced from a low around 1.19803 to close at 1.20855. Recent price candles demonstrate upward movement from recent consolidation near the 1.19600-1.20000 region toward higher daily price levels.

Key Technical Indicators:

Bollinger Bands: The daily Bollinger Bands reveal a middle line at 1.20026, an upper band at 1.20911, and a lower band at 1.19140. The current price of 1.20855 is trading near the upper Bollinger Band, reflecting active upside price pressure relative to the middle band.

RSI: The 14-period Relative Strength Index (RSI) stands at 58.14. Positioned above the 50 level, it signals moderate positive momentum while remaining below overbought territory.

MACD: The daily MACD indicator reads at -0.00011. This sits close to the zero line, indicating a largely neutral momentum balance following recent price recovery.

Support and Resistance:

Key technical levels for AUD/NZD feature immediate technical support at 1.19102 and primary overhead resistance at 1.22547. The middle Bollinger Band around 1.20026 serves as an intermediate dynamic reference level.

News to Watch for AUDNZD This Week:

  • GDP q/q: Reflects quarterly economic growth performance and overall activity in Australia.
  • RBNZ Rate Statement: Provides insights into the central bank's view on inflation and interest rate policy.
  • Official Cash Rate: Indicates the benchmark interest rate decision by the central bank.
  • RBNZ Monetary Policy Statement: Details economic forecasts and policy rationale.
  • RBNZ Press Conference: Delivers live commentary regarding monetary policy decisions.

Weekly Outlook and Consideration:

AUD/NZD enters the week trading around 1.20855, pushing near the upper Bollinger Band of 1.20911. Technical indicators show an RSI of 58.14 and a MACD of -0.00011, maintaining a neutral-to-bullish stance between key support at 1.19102 and resistance at 1.22547. Key events such as the Australian GDP release and RBNZ policy announcements may drive price action across the pair throughout the week.

Disclaimer: The analysis provided for AUD/NZD is for informational purposes only and does not constitute investment advice. Traders are encouraged to perform their own analysis and research before making any trading decisions. Market conditions can change quickly, so staying informed with the latest data is essential.
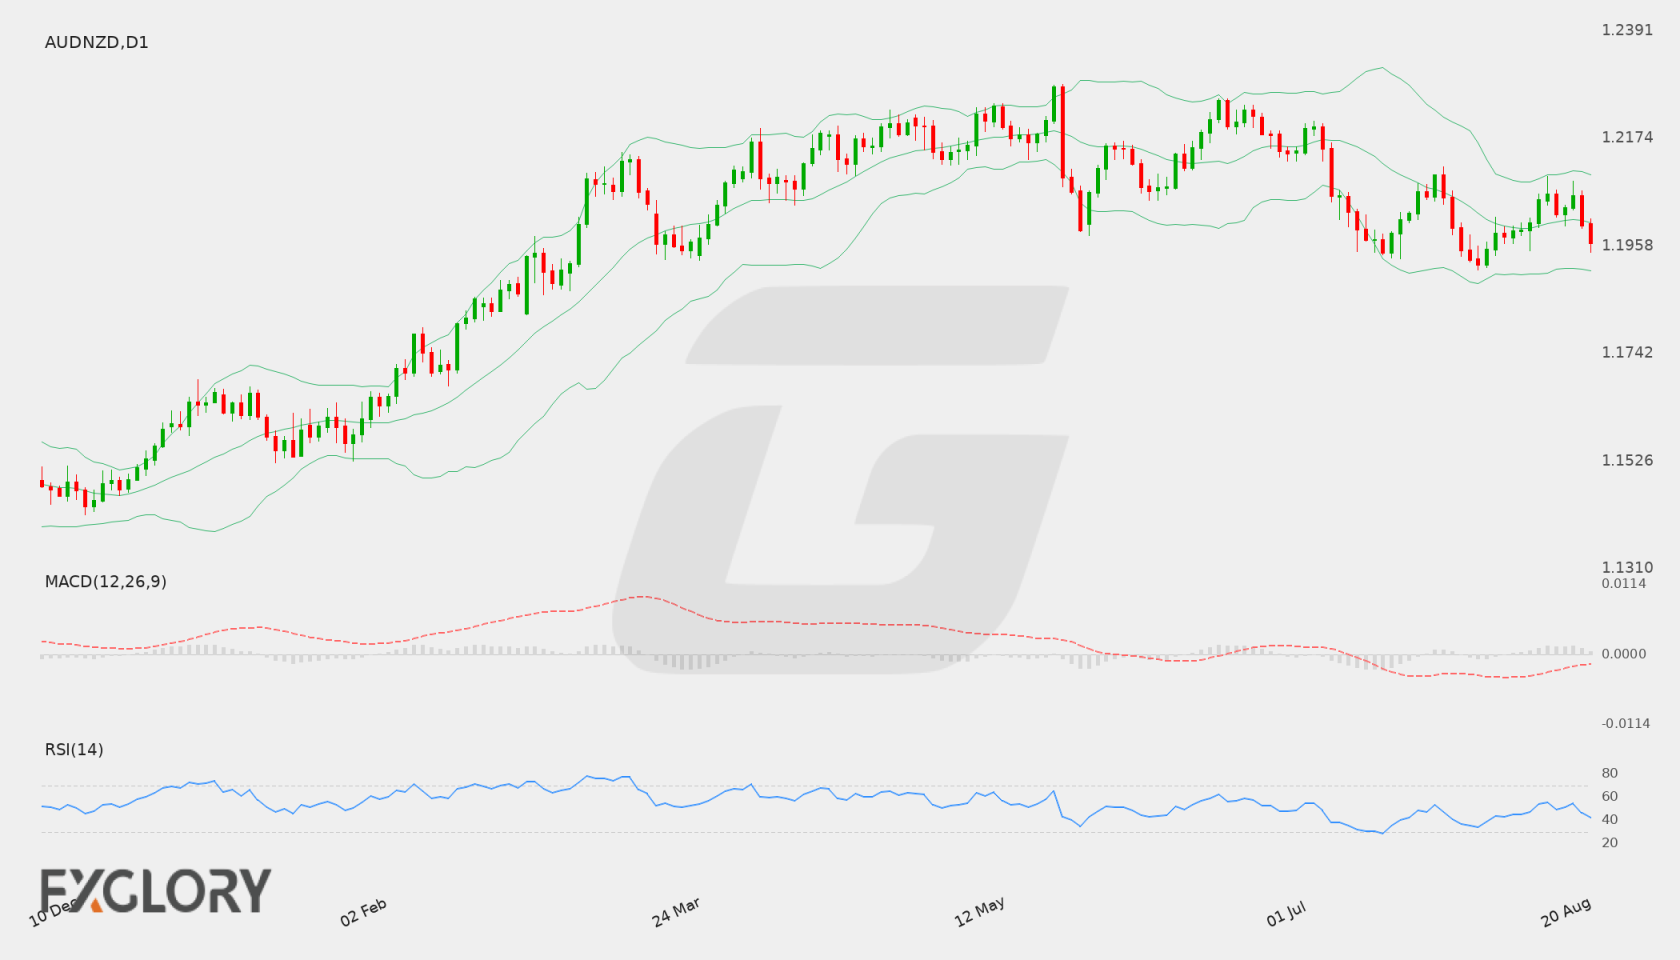
AUD/NZD D1 technical analysis chart
AUD/NZD D1 Technical Analysis for 08.29.2026

AUD/NZD Forecast — 22 August 2026

Time Zone: GMT +3

Time Frame: Daily (D1) / Weekly Outlook

Weekly Fundamental Overview:

Fundamentally, AUD/NZD remains sensitive to upcoming Australian inflation metrics and broader economic conditions across Australasia. Fresh consumer price data could alter interest rate expectations for the Reserve Bank of Australia, influencing near-term direction for the pair.

Price Action:

On the D1 chart, AUD/NZD recently pulled back from recent daily highs near 1.20594, settling at a last close of 1.19646. The daily candles demonstrate prevailing downward pressure as sellers push price action lower within the broader range.

Key Technical Indicators:

Bollinger Bands: The D1 Bollinger Bands display a middle band at 1.20050, an upper band at 1.21012, and a lower band at 1.19087. Trading at 1.19646, AUD/NZD sits below the middle line and trades near the lower envelope, indicating a bearish drift.

RSI: The 14-period Daily Relative Strength Index (RSI) stands at 42.05. Holding below the 50 neutral mark, it reflects moderate bearish control while remaining above oversold conditions.

MACD: The D1 MACD indicator is currently at -0.00115. Resting below the zero signal line, it confirms negative momentum across recent daily trading sessions.

Support and Resistance:

Technical analysis highlights key D1 support at 1.19102, which serves as the primary floor. On the upside, major resistance is located at 1.22547, marking a key potential barrier for any corrective moves.

News to Watch for AUDNZD This Week:

  • CPI m/m: This monthly release gauges inflation changes and can influence near-term central bank policy expectations.
  • Trimmed Mean CPI m/m: This core inflation metric excludes extreme price swings to reveal underlying consumer price trends.
  • CPI y/y: This annualized rate provides insight into long-term price pressures that impact overall exchange rate sentiment.

Weekly Outlook and Consideration:

The daily outlook for AUD/NZD remains tilted to the downside as price trades at 1.19646 below the 1.20050 Bollinger middle band. Negative MACD values and an RSI of 42.05 support the current bearish bias. A break below key support at 1.19102 could open the path toward lower technical levels, while a sustained recovery above 1.20050 is required to challenge resistance at 1.22547.

Disclaimer: The analysis provided for AUD/NZD is for informational purposes only and does not constitute investment advice. Traders are encouraged to perform their own analysis and research before making any trading decisions. Market conditions can change quickly, so staying informed with the latest data is essential.
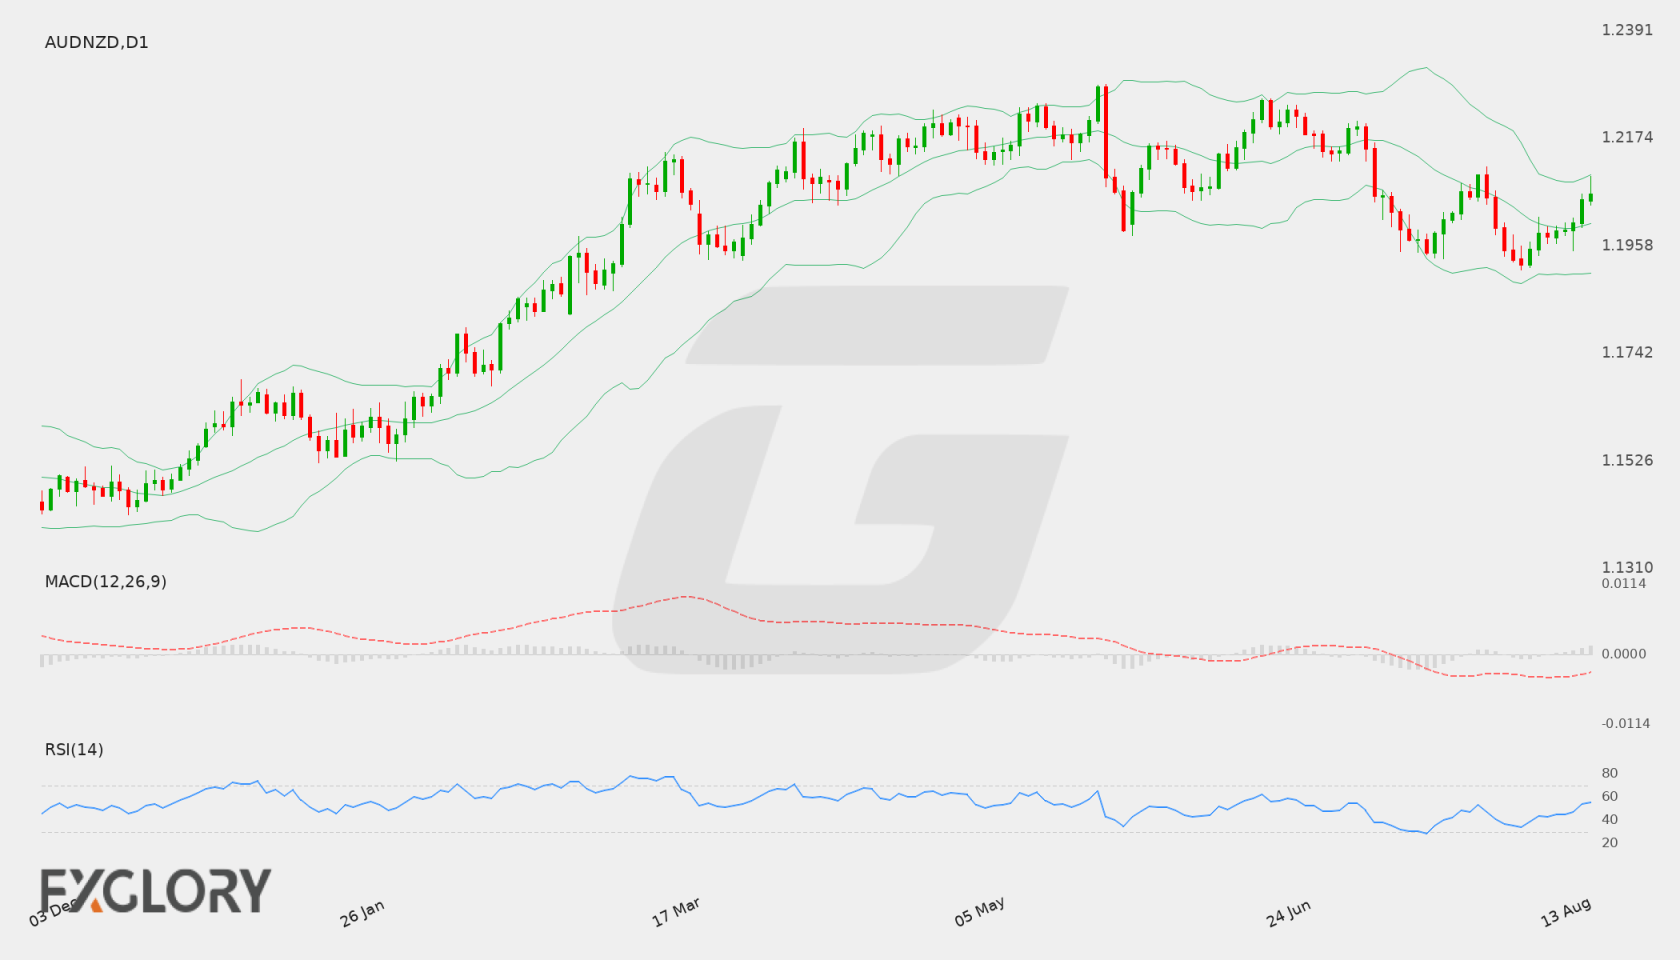
AUD/NZD D1 technical analysis chart
AUD/NZD D1 Technical Analysis for 08.22.2026

AUD/NZD Forecast — 15 August 2026

Time Zone: GMT +3

Time Frame: Daily (D1) / Weekly Outlook

Weekly Fundamental Overview:

AUD/NZD remains sensitive to scheduled market events and broader risk sentiment. Traders should watch high-impact calendar releases and USD movement where relevant before forming a directional view.

Price Action:

AUDNZD is trading near 1.20627, with current daily movement framed by nearby support and resistance.

Key Technical Indicators:

Bollinger Bands: Price is being assessed against the 20-period Bollinger Bands, with middle band near 1.200252, upper band near 1.2101245996576, and lower band near 1.1903794003424.

RSI: RSI(14) is near 55.416414885325, suggesting traders should watch whether momentum holds, reaches overbought pressure, or weakens toward oversold territory.

MACD: MACD is near -0.0015857247738349, so momentum should be watched for continuation or loss of strength on the daily chart.

Support and Resistance:

Key support is near 1.19102, while key resistance is near 1.22823.

News to Watch for AUDNZD This Week:

  • Watch scheduled high-impact releases, central bank comments, and broader risk sentiment this week; no specific calendar events are available in current plugin data.

Weekly Outlook and Consideration:

AUD/NZD may remain guided by daily price action, support and resistance reactions, momentum indicators, and supplied calendar events. Traders should wait for confirmation around key levels and avoid assuming that current conditions guarantee the next move.

Disclaimer: The analysis provided for AUD/NZD is for informational purposes only and does not constitute investment advice. Traders are encouraged to perform their own analysis and research before making any trading decisions. Market conditions can change quickly, so staying informed with the latest data is essential.
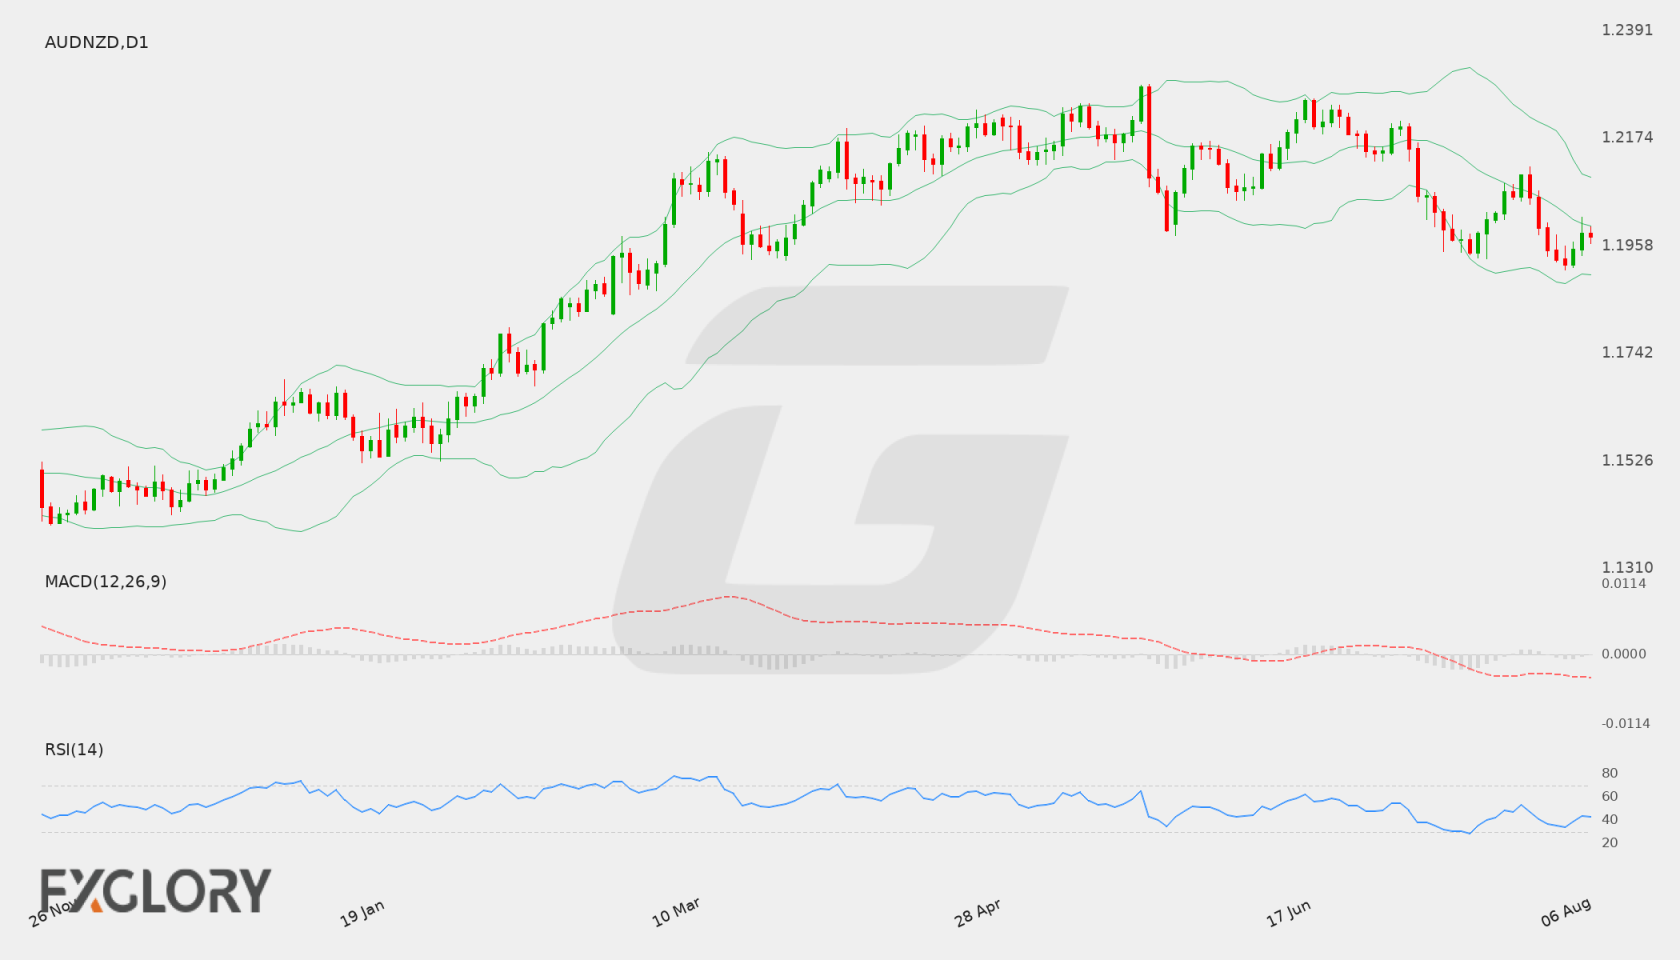
AUD/NZD D1 technical analysis chart
AUD/NZD D1 Technical Analysis for 08.15.2026

AUD/NZD Forecast — 9 August 2026

Time Zone: GMT +3

Time Frame: Daily (D1) / Weekly Outlook

Weekly Fundamental Overview:

AUD/NZD remains sensitive to scheduled market events and broader risk sentiment. Traders should watch high-impact calendar releases and USD movement where relevant before forming a directional view.

Price Action:

AUDNZD is trading near 1.19768, with current daily movement framed by nearby support and resistance.

Key Technical Indicators:

Bollinger Bands: Price is being assessed against the 20-period Bollinger Bands, with middle band near 1.1998635, upper band near 1.209653152241, and lower band near 1.190073847759.

RSI: RSI(14) is near 42.901304813271, suggesting traders should watch whether momentum holds, reaches overbought pressure, or weakens toward oversold territory.

MACD: MACD is near -0.0038924469924617, so momentum should be watched for continuation or loss of strength on the daily chart.

Support and Resistance:

Key support is near 1.19102, while key resistance is near 1.22823.

News to Watch for AUDNZD This Week:

  • Watch scheduled high-impact releases, central bank comments, and broader risk sentiment this week; no specific calendar events are available in current plugin data.

Weekly Outlook and Consideration:

AUD/NZD may remain guided by daily price action, support and resistance reactions, momentum indicators, and supplied calendar events. Traders should wait for confirmation around key levels and avoid assuming that current conditions guarantee the next move.

Disclaimer: The analysis provided for AUD/NZD is for informational purposes only and does not constitute investment advice. Traders are encouraged to perform their own analysis and research before making any trading decisions. Market conditions can change quickly, so staying informed with the latest data is essential.

AUD/NZD D1 technical analysis chart
AUD/NZD D1 Technical Analysis for 08.09.2026
1AUD = –––NZD –––%
AUDNZD
Loading chart...