
EURUSD Forecast

EUR/USD Forecast — 14 September 2026

Time Zone: GMT +3

Time Frame: Daily (D1) / Weekly Outlook

Weekly Fundamental Overview:

The EUR/USD currency pair reflects ongoing balance between economic developments in the Eurozone and the US. Market participants continue to monitor economic indicators, central bank comments, and upcoming Flash PMI releases from key European economies to assess overall growth momentum and interest rate expectations.

Price Action:

Daily price action for EUR/USD shows the pair recently settling near 1.15972 after oscillating between a daily high of 1.16165 and a low of 1.15687. The pair has experienced a slight pull back toward the lower half of its recent daily range, reflecting short-term consolidation across recent sessions.

Key Technical Indicators:

Bollinger Bands: On the daily chart, the Bollinger Bands display a middle line at 1.16262, an upper band at 1.16946, and a lower band at 1.15579. With the latest close at 1.15972, price trades below the middle band, indicating a neutral to mildly subdued stance within the current band boundaries.

RSI: The 14-period Relative Strength Index (RSI) stands at 50.87. This neutral reading around the midpoint confirms a balanced market, with neither overbought nor oversold condition taking precedent.

MACD: The MACD indicator registers at 0.00194, maintaining a positive reading above the zero line. This suggests residual underlying bullish momentum, though the modest magnitude points to potential sideways movement or momentum stabilization on the daily timeframe.

Support and Resistance:

Key technical levels for EUR/USD on the D1 chart include immediate support at 1.13236 and significant resistance at 1.17103.

News to Watch for EURUSD This Week:

  • French Flash Services PMI: Tracks service sector activity in France and serves as an indicator of broader European economic health.
  • French Flash Manufacturing PMI: Reflects operational conditions within the French manufacturing industry and impacts sentiment.
  • German Flash Services PMI: Evaluates business conditions in Germany's service sector, offering signals on regional economic momentum.

Weekly Outlook and Consideration:

The EUR/USD pair enters the week in a neutral consolidation phase, trading near 1.15972. Technical indicators present mixed signals, as a neutral RSI of 50.87 and price positioning below the 1.16262 middle Bollinger Band contrast with a positive MACD of 0.00194. If buyers regain initiative, price may move toward resistance at 1.17103, while a push lower could direct attention toward the lower Bollinger Band at 1.15579 and major support at 1.13236.

Disclaimer: The analysis provided for EUR/USD is for informational purposes only and does not constitute investment advice. Traders are encouraged to perform their own analysis and research before making any trading decisions. Market conditions can change quickly, so staying informed with the latest data is essential.
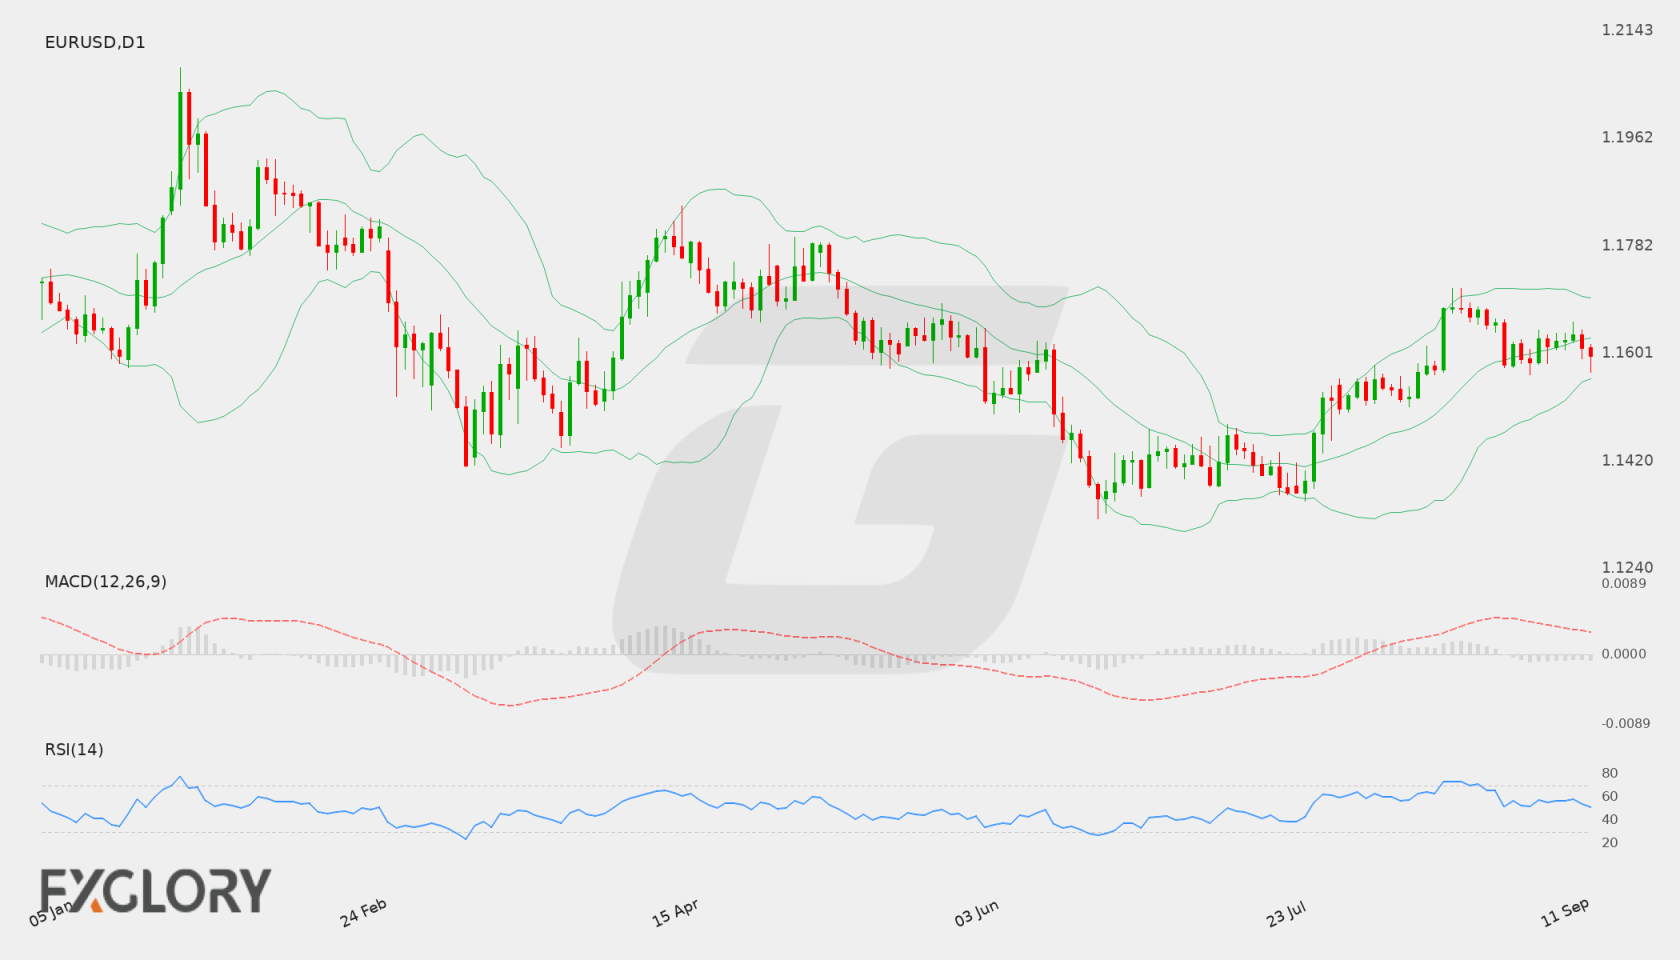
EUR/USD D1 technical analysis chart
EUR/USD D1 Technical Analysis for 09.14.2026

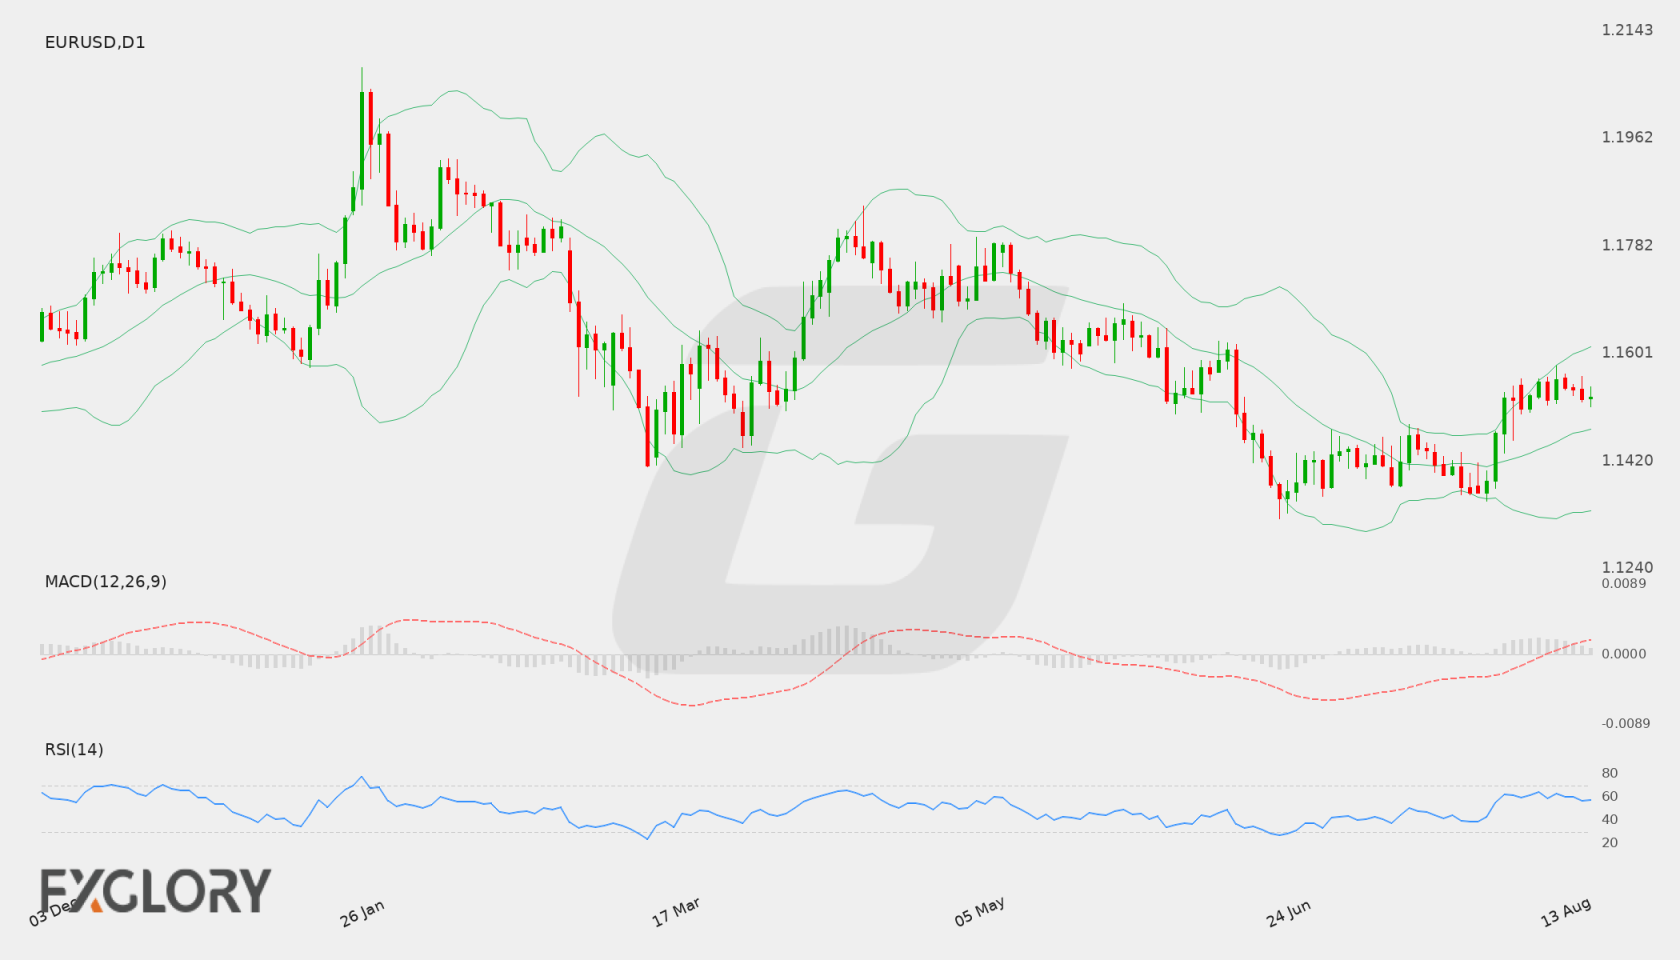
EUR/USD Forecast — 22 August 2026

Time Zone: GMT +3

Time Frame: Daily (D1) / Weekly Outlook

Weekly Fundamental Overview:

The fundamental context for EUR/USD (EURUSD) remains driven by market expectations around upcoming US economic data releases and central bank monetary policy outlooks. Traders are evaluating broader macroeconomic trends and inflation metrics, which could impact risk sentiment and drive volatility in the pair throughout the week.

Price Action:

On the Daily (D1) chart, EUR/USD (EURUSD) has demonstrated notable bullish price action, rallying from recent lows near 1.15747 to a close of 1.16773. The pair achieved a daily high of 1.17096, with consecutive green daily candles signaling strong short-term upward momentum approaching overhead technical levels.

Key Technical Indicators:

Bollinger Bands: The Bollinger Bands indicator shows EUR/USD trading near the upper band of 1.16863, with the middle band positioned at 1.15262 and the lower band at 1.13660. Price remaining close to the upper band highlights sustained bullish momentum, though it also warns of potential volatility or resistance near the upper band limit.

RSI: The 14-day Relative Strength Index (RSI) stands at 73.09, placing EUR/USD in overbought territory above the 70 level. While this underscores strong buying interest, it cautions traders about potential overextension and the possibility of a brief pause or corrective pullbacks.

MACD: The MACD indicator prints a positive value of 0.00467, operating above the zero line. This positive alignment reflects ongoing upward momentum for EUR/USD (EURUSD) on the daily timeframe, supporting the recent bullish trend.

Support and Resistance:

Key technical levels for EUR/USD (EURUSD) include immediate resistance at 1.17096, which aligns with recent daily highs. On the downside, critical support sits at 1.13236, with dynamic support provided near the middle Bollinger Band level of 1.15262.

News to Watch for EURUSD This Week:

  • CB Consumer Confidence: Reflects consumer economic sentiment which can influence consumer spending patterns and broader market expectations.
  • Core PCE Price Index m/m: Serves as a key inflation indicator that directly impacts central bank interest rate decisions.
  • Prelim GDP q/q: Provides a comprehensive measure of economic growth rate affecting currency valuation.
  • Prelim GDP Price Index q/q: Measures changes in prices of domestic goods and services to indicate inflationary trends.
  • Unemployment Claims: Tracks weekly changes in jobless claims to gauge labor market health.
  • Prelim Benchmark Payrolls Revision: Delivers updated historical employment figures that may alter assessments of overall labor market performance.

Weekly Outlook and Consideration:

EUR/USD (EURUSD) enters the week showing robust bullish strength after closing at 1.16773, positioned near upper Bollinger Band resistance at 1.16863 and testing technical resistance at 1.17096. The MACD confirms positive momentum, but an RSI of 73.09 cautions that the pair is in overbought conditions. A clear break above 1.17096 could clear the path for extended upside, while failure to overcome resistance may lead to a pullback toward the 1.15262 middle band and support at 1.13236.

Disclaimer: The analysis provided for EUR/USD is for informational purposes only and does not constitute investment advice. Traders are encouraged to perform their own analysis and research before making any trading decisions. Market conditions can change quickly, so staying informed with the latest data is essential.
EUR/USD Forecast — 15 August 2026

Time Zone: GMT +3

Time Frame: Daily (D1) / Weekly Outlook

Weekly Fundamental Overview:

The EUR/USD currency pair enters the week influenced by underlying sentiment around monetary policy outlooks and forthcoming economic indicators from both sides of the Atlantic. Market participants are monitoring upcoming employment benchmark revisions and central bank insights, alongside European sentiment data, which may drive price shifts across the pair. Moderate moves in recent daily sessions suggest traders are weighing economic resilience against shifting rate expectations.

Price Action:

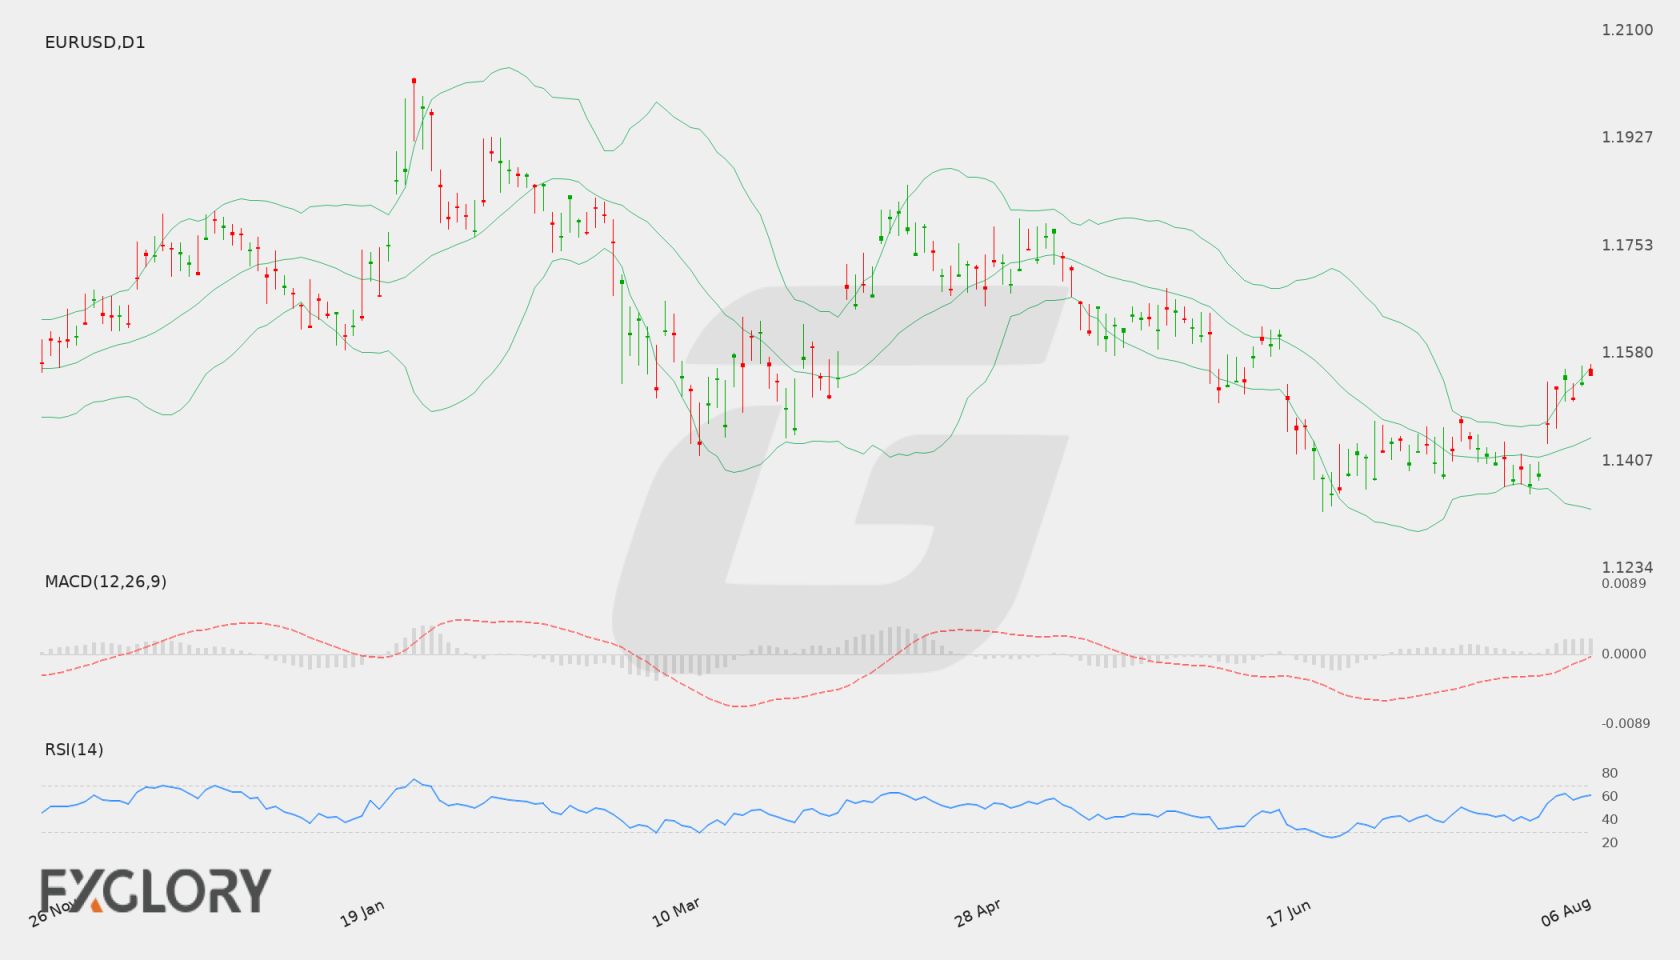
On the Daily (D1) chart, EUR/USD recently rebounded from lower levels near 1.1352 to register a latest close of 1.15274. The price action shows a gradual upward trajectory following a period of consolidation, with recent daily candles forming higher lows and maintaining stability above the 1.1500 level.

Key Technical Indicators:

Bollinger Bands: The D1 Bollinger Bands show the middle band positioned at 1.14742, while the upper band rests at 1.16114 and the lower band at 1.13369. Trading at 1.15274, EUR/USD is hovering above the middle baseline, reflecting mild bullish momentum within the current band boundaries.

RSI: The 14-period Relative Strength Index (RSI) on the daily chart stands at 57.08. Positioned comfortably above the 50 neutral mark and below overbought levels, the oscillator reflects positive buying pressure without indicating an overextended market state.

MACD: The D1 MACD indicator records a reading of 0.00252, remaining above the zero line. This indicates that short-term momentum is currently leaning slightly positive, though the signal line convergence suggests a balanced environment requiring confirmation for stronger directional extension.

Support and Resistance:

Key technical support for EUR/USD is identified at 1.13236, holding the recent lower boundary. On the upside, primary daily resistance is located at 1.16848, which serves as a notable ceiling for potential upward attempts.

News to Watch for EURUSD This Week:

  • Prelim Benchmark Payrolls Revision: Revisions to labor statistics can influence market expectations regarding economic strength.
  • FOMC Meeting Minutes: Detailed policy discussion notes may provide insights into future interest rate decisions.
  • Unemployment Claims: Weekly labor market updates offer hints about employment trends and economic stability.
  • Philly Fed Manufacturing Index: Regional business survey data helps assess overall manufacturing sector performance.
  • French Flash Services PMI: Preliminary services survey results offer a view into economic activity in the region.

Weekly Outlook and Consideration:

The weekly outlook for EUR/USD remains cautiously constructive while price action holds above the 1.14742 daily middle Bollinger band. With RSI at 57.08 and MACD remaining in positive territory at 0.00252, technicals lean slightly bullish. However, upcoming economic event risk could spur volatility, with price dynamics likely constrained between main support at 1.13236 and resistance at 1.16848.

Disclaimer: The analysis provided for EUR/USD is for informational purposes only and does not constitute investment advice. Traders are encouraged to perform their own analysis and research before making any trading decisions. Market conditions can change quickly, so staying informed with the latest data is essential.
EUR/USD D1 technical analysis chart
EUR/USD D1 Technical Analysis for 08.15.2026

EUR/USD Forecast — 6 August 2026

Time Zone: GMT +3

Time Frame: Daily (D1) / Weekly Outlook

Weekly Fundamental Overview:

Macroeconomic focus for EUR/USD (EURUSD) remains centered on upcoming US inflation metrics and consumer activity. As market participants evaluate broader economic conditions, shifts in US pricing pressures and retail performance could significantly influence dollar sentiment and drive price action across the pair.

Price Action:

The daily D1 chart demonstrates that EUR/USD (EURUSD) has steadily rebounded from recent lows around 1.13674 to reach a close of 1.15524. The price action reflects sustained upward trajectory over recent sessions, positioning the pair closer to testing higher resistance zones near 1.17205.

Key Technical Indicators:

Bollinger Bands: Bollinger Bands on the D1 chart show a middle band at 1.14406, an upper band at 1.15558, and a lower band at 1.13253. Trading near the upper band at 1.15524, EUR/USD (EURUSD) indicates strong upside momentum while approaching potential volatility boundaries.

RSI: The 14-day Relative Strength Index (RSI) is currently at 64.02. This value confirms prevailing bullish momentum for EUR/USD (EURUSD) while staying below the overbought barrier of 70.

MACD: The Moving Average Convergence Divergence (MACD) indicator displays a positive reading of 0.00165. This positioning above the zero line suggests that bullish momentum remains intact for EUR/USD (EURUSD) on the daily chart.

Support and Resistance:

Key technical levels for EUR/USD (EURUSD) highlight main support at 1.13236 and major resistance at 1.17205. A pull back below support could indicate weakening sentiment, whereas a break above resistance may extend the broader advance.

News to Watch for EURUSD This Week:

  • Core CPI y/y: This release measures annual core price changes and heavily influences monetary policy expectations.
  • CPI y/y: Headline annual inflation data offers critical insight into overall pricing trends across the economy.
  • CPI m/m: Monthly inflation updates provide timely signals regarding immediate consumer price shifts.
  • Core CPI m/m: Monthly core inflation figures exclude volatile items to highlight underlying price dynamics.
  • PPI m/m: Producer price metrics act as a leading indicator for upcoming consumer price pressures.
  • Core PPI m/m: Wholesale price trends excluding volatile sectors offer a clearer view of producer costs.
  • Unemployment Claims: Weekly jobless claims data provides key insights into labor market health and broad economic stability.
  • Retail Sales m/m: Consumer spending figures reflect overall economic momentum and domestic demand strength.
  • Core Retail Sales m/m: Core spending data offers a refined view of underlying consumer purchasing behavior.

Weekly Outlook and Consideration:

EUR/USD (EURUSD) enters the week with a bullish technical posture on the daily timeframe, supported by an RSI of 64.02 and a positive MACD value of 0.00165. With the last close at 1.15524 positioned near the upper Bollinger Band of 1.15558 and well above the middle band of 1.14406, price action favors further upside testing. Technical focus remains on support at 1.13236 and resistance at 1.17205, with upcoming inflation and retail sales data likely to dictate near-term volatility.

Disclaimer: The analysis provided for EUR/USD is for informational purposes only and does not constitute investment advice. Traders are encouraged to perform their own analysis and research before making any trading decisions. Market conditions can change quickly, so staying informed with the latest data is essential.

EUR/USD D1 technical analysis chart
EUR/USD D1 Technical Analysis for 08.06.2026

EUR/USD Forecast — 2 August 2026

Time Zone: GMT +4

Time Frame: 4 Hours (H4)

Fundamental Analysis:

Economic calendar data is unavailable for this period, shifting market focus primarily toward technical price dynamics for the EUR/USD currency pair on the H4 timeframe.

Price Action:

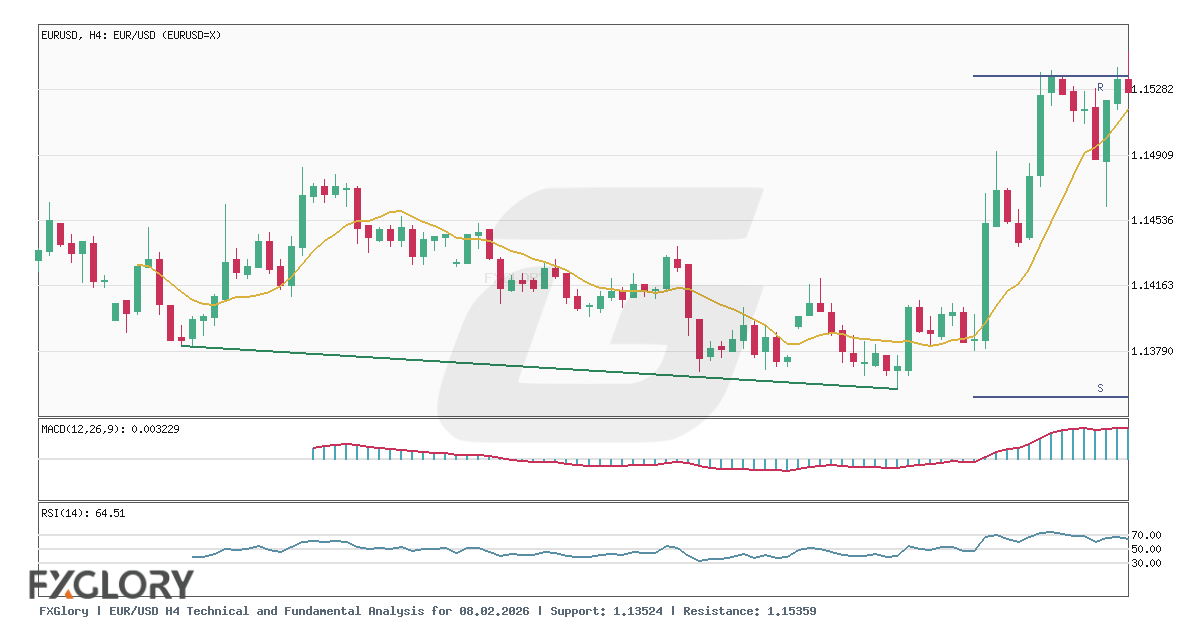
On the H4 chart, EUR/USD experienced a strong advance from recent swing lows around 1.13648 to a peak high of 1.15359. Following a brief dip to 1.14543, price action bounced back to settle at a last close of 1.15162, maintaining a short-term bullish structure.

Key Technical Indicators:

Bollinger Bands(20,2.000): The Bollinger Bands display a middle line at 1.14494, an upper band at 1.15627, and a lower band at 1.13362. EUR/USD trading at 1.15162 positions the pair near the upper boundary, highlighting solid upward push relative to its 20-period moving average.

MACD(12,26,9): The MACD indicator is currently reading 0.003229, remaining in positive territory above the baseline to signify intact bullish momentum on the H4 timeframe.

RSI(14): The 14-period Relative Strength Index (RSI) stands at 64.51, signaling positive momentum in favor of buyers without entering deeply into overbought territory.

Support and Resistance:

Key technical levels for EUR/USD include primary resistance at 1.15359 and strong horizontal support established at 1.13524.

Conclusion and Consideration:

EUR/USD retains a bullish posture on the H4 chart, supported by a positive MACD and an RSI of 64.51. A continuation of current momentum could test resistance at 1.15359, whereas a pullback would bring focus toward the middle Bollinger Band near 1.14494 and primary support at 1.13524.

Disclaimer: The analysis provided for EUR/USD is for informational purposes only and does not constitute investment advice. Traders are encouraged to perform their own analysis and research before making any trading decisions. Market conditions can change quickly, so staying informed with the latest data is essential.

EUR/USD H4 technical and fundamental analysis
EUR/USD H4 Technical and Fundamental Analysis for 08.02.2026
1EUR = –––USD –––%
EURUSD
Loading chart...