
GOLD Forecast

GOLD iconUSD icon
Gold

SPOT Gold Ounce vs US Dollar

Gold Live Price

4348.43000
+0.36%

Gold Forecast — 22 August 2026

Time Zone: GMT +3

Time Frame: Daily (D1) / Weekly Outlook

Weekly Fundamental Overview:

Gold (GOLD) continues to be influenced by macroeconomic trends and upcoming economic data releases. Shifts in inflation measures, growth metrics, and employment updates remain pivotal factors steering market sentiment and safe-haven demand.

Price Action:

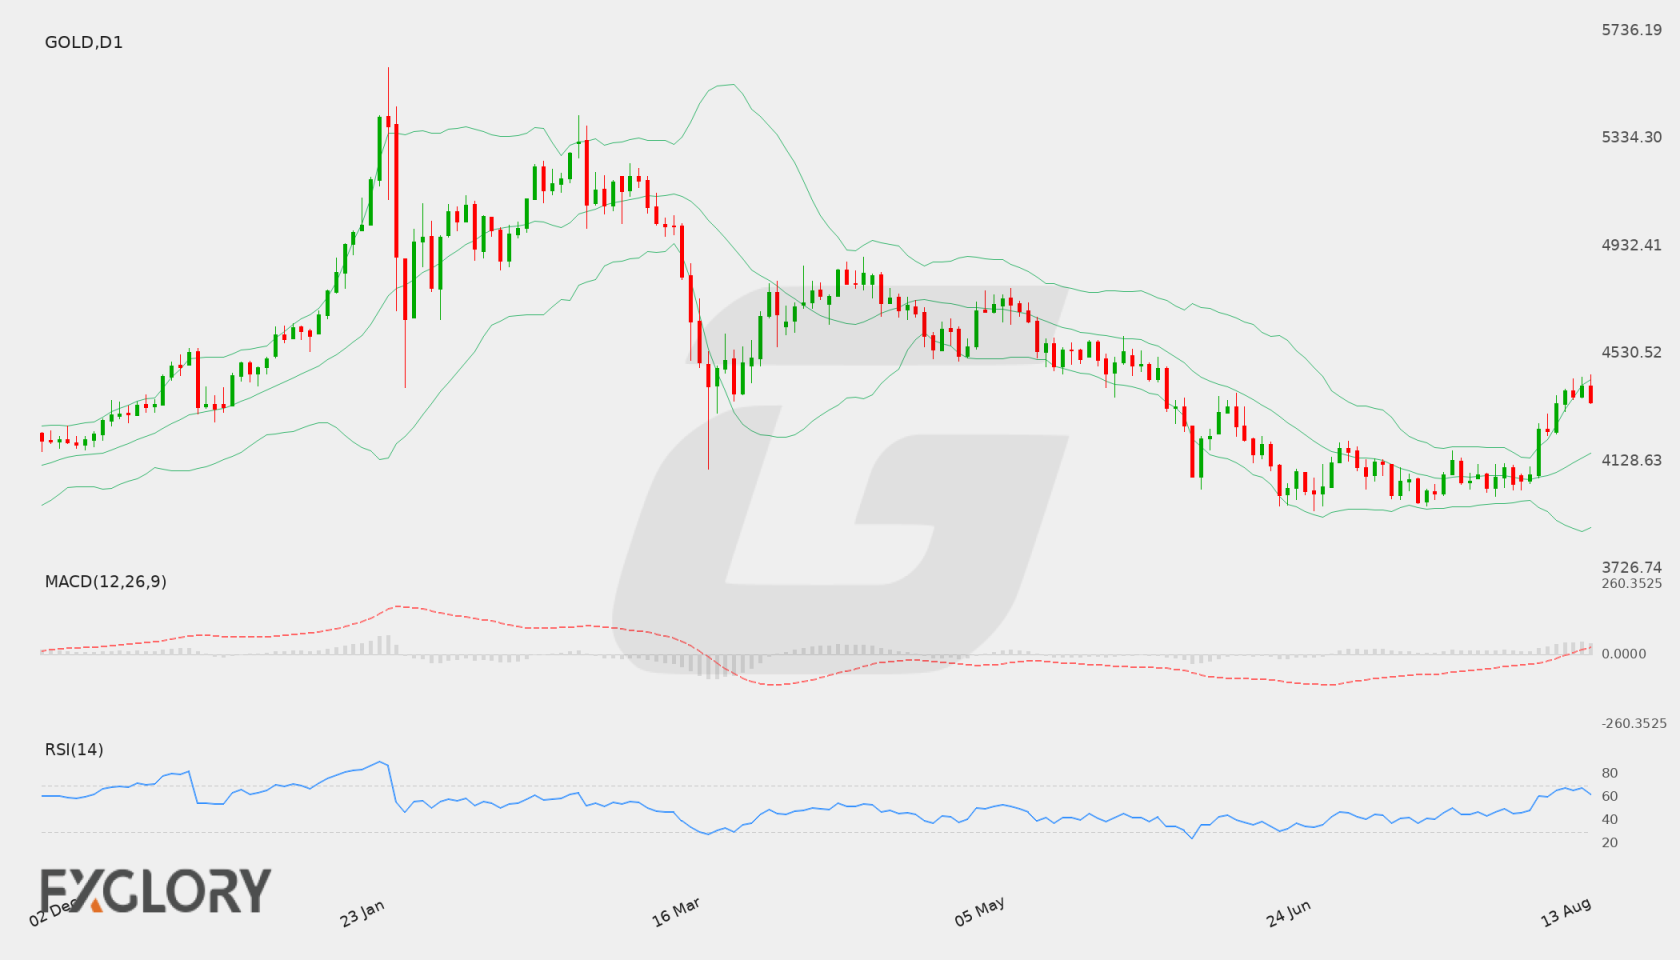
On the daily (D1) chart, Gold (GOLD) recently advanced toward its last close of 4518.6, maintaining a strong upward trajectory from prior lower bounds near 4054.89. The recent candlestick progression demonstrates solid buying pressure as price moves toward key resistance levels.

Key Technical Indicators:

Bollinger Bands: The D1 Bollinger Bands show Gold (GOLD) trading near the upper band of 4585.02, well above the middle band at 4250.94. The lower band is located at 3916.85, reflecting expanded volatility accompanying the recent price expansion.

RSI: The 14-period Relative Strength Index (RSI) sits at 67.09, signaling firm bullish momentum as it approaches overbought territory above the 70 threshold without immediate signs of exhaustion.

MACD: The MACD indicator is currently reading a positive value of 92.53. The histogram and signal lines remain in bullish territory, pointing to sustained upward momentum across the daily timeframe.

Support and Resistance:

Key technical levels for Gold (GOLD) include daily support at 3943.33 and daily resistance at 4594.90. A move beyond resistance could reinforce the bullish trend, whereas a pull back could find buyers near lower support bounds.

News to Watch for GOLD This Week:

  • CB Consumer Confidence: Shifts in consumer confidence can influence market expectations regarding economic activity and monetary policy.
  • Core PCE Price Index m/m: As a primary inflation indicator, this report impacts interest rate projections and demand for bullion.
  • Prelim GDP q/q: Comprehensive economic growth figures provide insight into overall macroeconomic strength and risk sentiment.
  • Prelim GDP Price Index q/q: Price index figures help assess underlying inflationary pressures within the broader economy.
  • Unemployment Claims: Weekly jobless claims data offers timely insights into labor market health and policy direction.
  • Prelim Benchmark Payrolls Revision: Significant adjustments to benchmark payroll statistics can reshape market expectations for employment trends.

Weekly Outlook and Consideration:

The D1 technical outlook for Gold (GOLD) remains constructively bullish, supported by an RSI of 67.09, positive MACD of 92.53, and price trading near the upper Bollinger Band of 4585.02 around the 4518.6 level. Key levels to watch include support at 3943.33 and resistance at 4594.90. Upcoming high-impact economic releases could trigger volatility, dictating whether price breaks resistance or consolidates within established ranges.

Disclaimer: The analysis provided for Gold is for informational purposes only and does not constitute investment advice. Traders are encouraged to perform their own analysis and research before making any trading decisions. Market conditions can change quickly, so staying informed with the latest data is essential.
Gold Forecast — 15 August 2026

Time Zone: GMT +3

Time Frame: Daily (D1) / Weekly Outlook

Weekly Fundamental Overview:

Market dynamics for Gold (GOLD) remain focused on economic data releases and policy signals. Traders are tracking upcoming labor market reports and central bank policy updates to assess potential interest rate trajectories, which influence demand for precious metals. Macroeconomic sentiment and risk conditions continue to play a key role in short-term price movements.

Price Action:

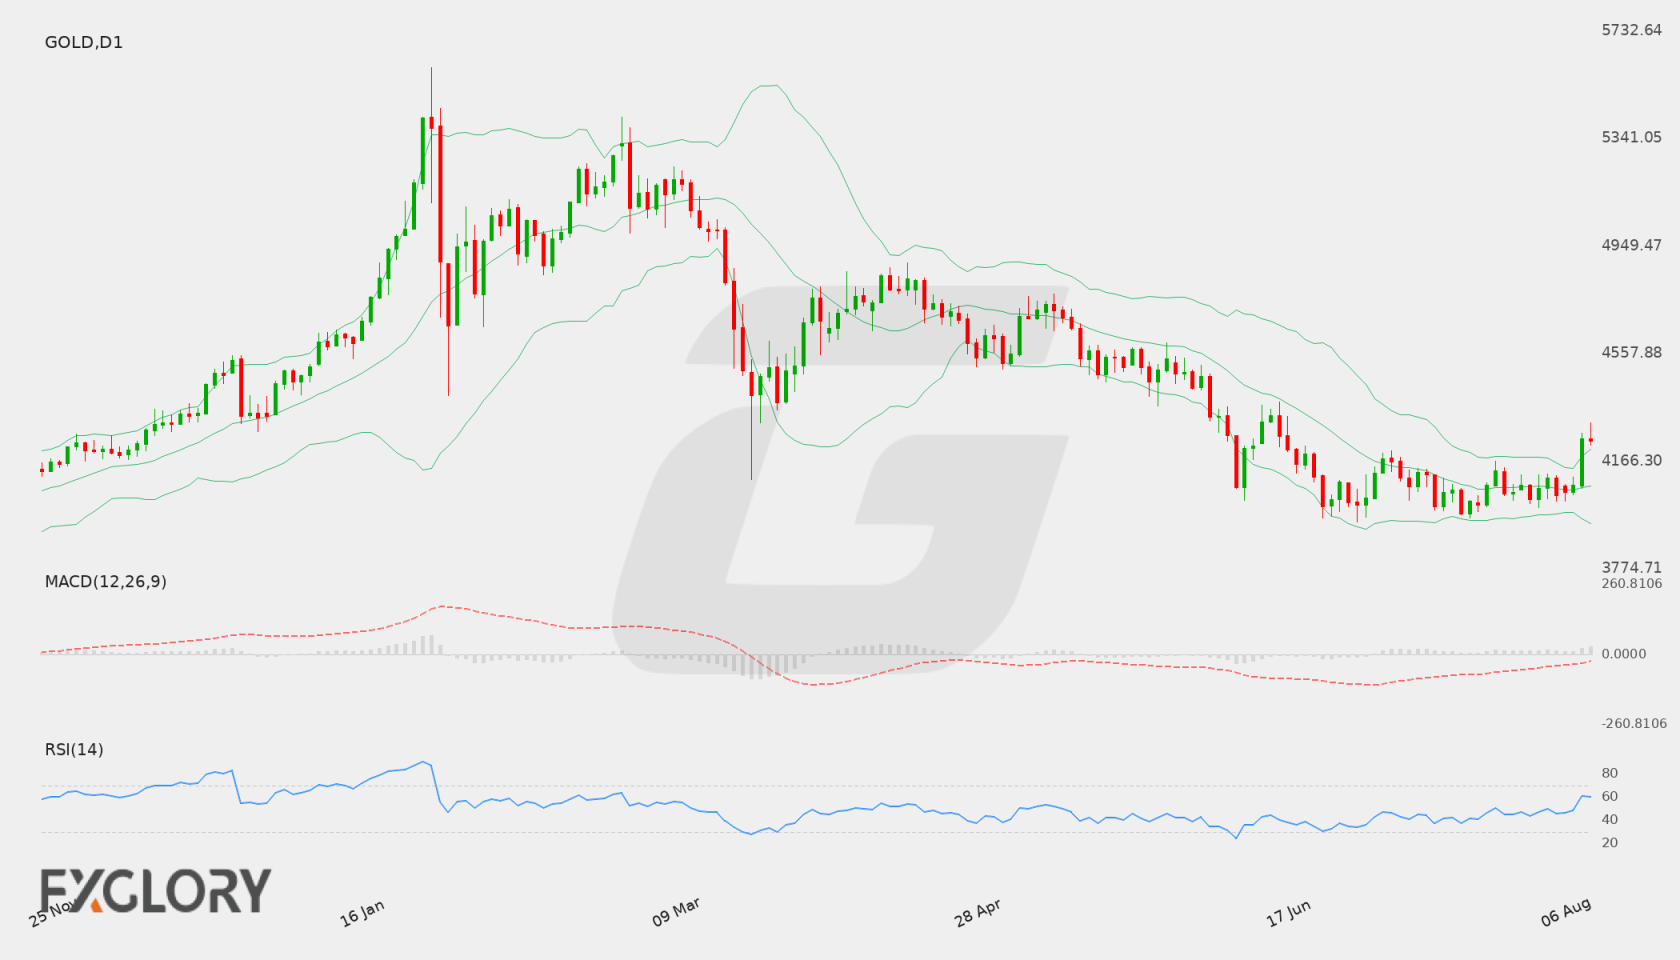
On the daily D1 chart, Gold (GOLD) recently pushed upward to reach a high around 4408.39 before pulling back slightly to close at 4350.02. This recent upward swing followed a rise from the 4054.89 level, demonstrating active buying interest over recent sessions, though the price is currently pausing below recent peaks.

Key Technical Indicators:

Bollinger Bands: The D1 Bollinger Bands indicate that Gold (GOLD) is trading near the upper band of 4433.66, situated above the middle line at 4156.69 and the lower band at 3879.73. Price action holding in the upper band region highlights recent bullish strength across the daily timeframe.

RSI: The 14-day Relative Strength Index (RSI) for Gold (GOLD) stands at 61.97. Holding above the 50 mark, this value indicates positive price momentum without currently crossing into overbought conditions above 70.

MACD: The MACD indicator for Gold (GOLD) registers a reading of 65.09, maintaining a position in positive territory. This positive value highlights bullish momentum following the recent upward price movements on the daily chart.

Support and Resistance:

Key daily technical levels for Gold (GOLD) show established resistance at 4594.90 and major support positioned at 3943.33.

News to Watch for GOLD This Week:

  • Prelim Benchmark Payrolls Revision: Revisions to historical employment data can alter expectations for labor market health and future monetary policy decisions.
  • FOMC Meeting Minutes: Insights into policy discussions provide details on central bank interest rate expectations and economic outlooks.
  • Unemployment Claims: Weekly jobless numbers offer an updated measure of labor market stability and economic trajectory.
  • Philly Fed Manufacturing Index: Regional manufacturing conditions provide early signals on broader industrial sector health.
  • Flash Manufacturing PMI: Preliminary purchasing managers data reflects overall activity levels and trends across the manufacturing sector.

Weekly Outlook and Consideration:

Gold (GOLD) maintains a positive technical tone on the daily chart, supported by an RSI of 61.97 and an MACD of 65.09. With price closing at 4350.02 above the middle Bollinger Band of 4156.69, momentum favors the upside. A continuation of current trend dynamics could see price test resistance toward 4594.90, whereas a pullback might head toward support at 3943.33.

Disclaimer: The analysis provided for Gold is for informational purposes only and does not constitute investment advice. Traders are encouraged to perform their own analysis and research before making any trading decisions. Market conditions can change quickly, so staying informed with the latest data is essential.
Gold D1 technical analysis chart
Gold D1 Technical Analysis for 08.15.2026

Gold Forecast — 9 August 2026

Time Zone: GMT +3

Time Frame: Daily (D1) / Weekly Outlook

Weekly Fundamental Overview:

Gold (GOLD) continues to react to broader macroeconomic trends, shifting interest rate expectations, and market risk sentiment. Strategic safe-haven flows and changes in US economic growth perspectives play a primary role in directing momentum for the precious metal across daily charts. Upcoming macroeconomic data releases offer critical context for potential price shifts in the near term.

Price Action:

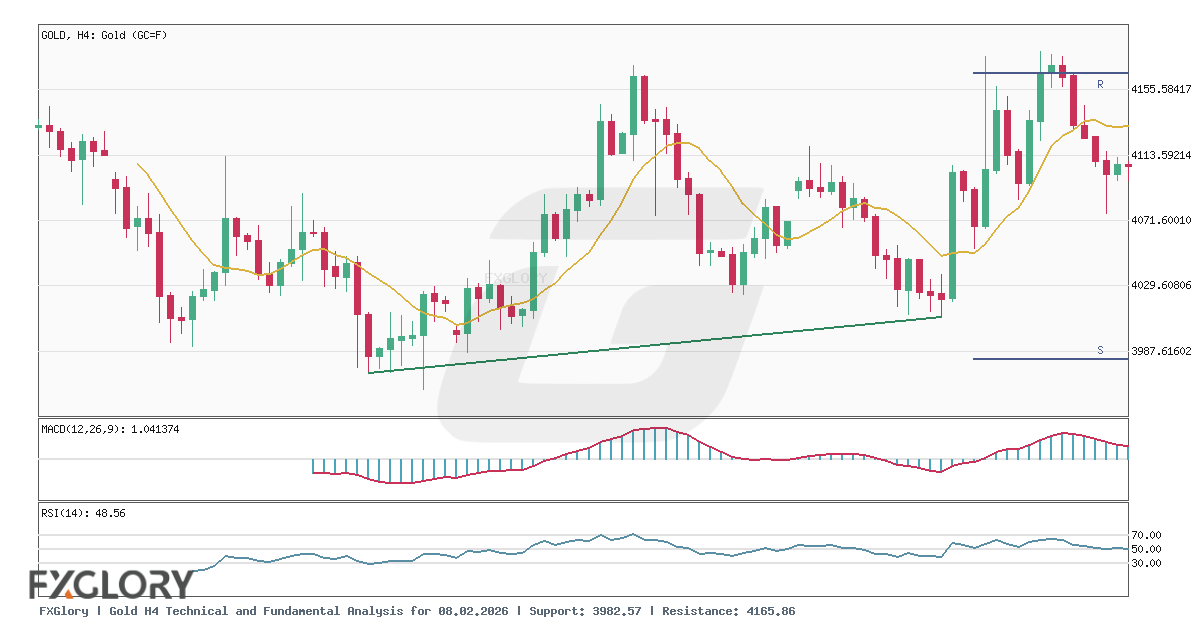
Daily chart price action for Gold (GOLD) shows a strong recent push higher, with price advancing from recent consolidation levels around 4050-4077 to close near 4239.68 after touching a daily high of 4303.86. This impulsive move demonstrates renewed bullish buying interest following periods of range-bound behavior.

Key Technical Indicators:

Bollinger Bands: The D1 Bollinger Bands show a middle line at 4074.13, an upper band at 4209.04, and a lower band at 3939.22. With the current close at 4239.68 positioned above the upper band, Gold (GOLD) reflects robust bullish strength, though prolonged trading outside the bands may prompt temporary consolidation.

RSI: The 14-day Relative Strength Index (RSI) rests at 59.78. This indicates comfortable bullish territory with healthy buying momentum while staying clear of traditional overbought thresholds.

MACD: The D1 MACD indicator posts a positive reading with the main value at 2.22, signaling active bullish momentum. The upward trajectory supports the current strength seen in price action while indicating positive underlying market force.

Support and Resistance:

Key Daily (D1) chart levels place resistance at 4665.08, which marks the overhead target level. On the downside, key support is established at 3943.33, offering a baseline floor in the event of corrective price retracements.

News to Watch for GOLD This Week:

  • Core Retail Sales m/m: This metric provides insight into consumer spending habits, which can alter interest rate expectations and impact precious metals sentiment.
  • Retail Sales m/m: Broad shifts in retail trade data may influence economic growth forecasts and drive volatility in bullion prices.

Weekly Outlook and Consideration:

Gold (GOLD) enters the trading week with a strong bullish posture after closing at 4239.68, above its upper daily Bollinger Band. Supported by an RSI of 59.78 and a positive MACD at 2.22, the technical bias points toward sustained momentum, provided key support at 3943.33 remains intact. Key resistance at 4665.08 stands as the primary upside level to monitor. Market participants will closely watch upcoming US retail sales releases to gauge economic momentum and determine whether current price levels can be sustained.

Disclaimer: The analysis provided for Gold is for informational purposes only and does not constitute investment advice. Traders are encouraged to perform their own analysis and research before making any trading decisions. Market conditions can change quickly, so staying informed with the latest data is essential.
Gold D1 technical analysis chart
Gold D1 Technical Analysis for 08.09.2026

Gold Forecast — 2 August 2026

Time Zone: GMT +4

Time Frame: 4 Hours (H4)

Fundamental Analysis:

Market participants observing Gold (GOLD) encounter a period with no major scheduled economic calendar events in the provided driver list. In the absence of immediate high-impact macroeconomic releases, trading sentiment is primarily steered by technical factors and market positioning.

Price Action:

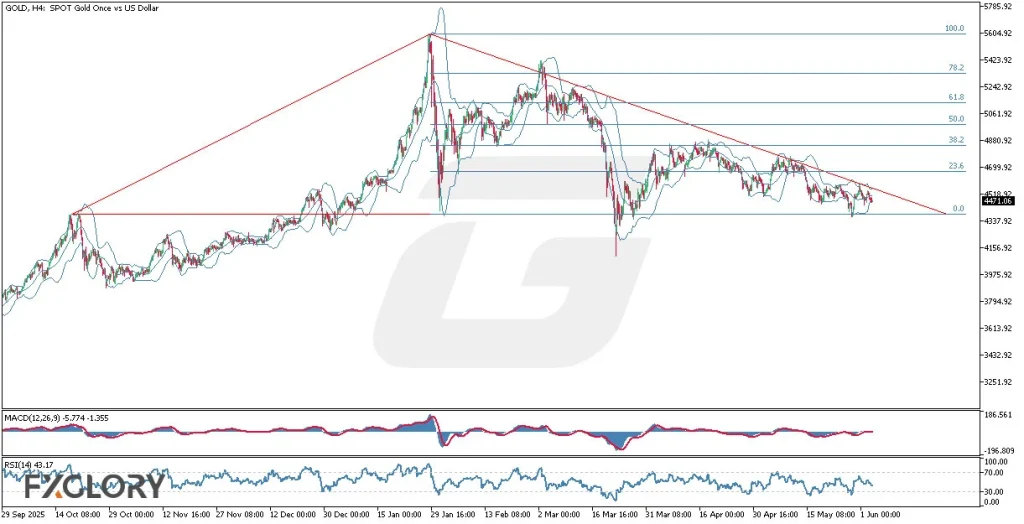
On the H4 chart, Gold (GOLD) recently retreated from highs above 4112.00 toward a low near 4025.36 before pulling back up to close at 4053.56. This movement indicates recent short-term selling pressure followed by a modest stabilization within the broader trading frame.

Key Technical Indicators:

Bollinger Bands(20,2.000): The Bollinger Bands for Gold (GOLD) display a middle band at 4053.92, an upper band at 4114.37, and a lower band at 3993.47. The last closing price of 4053.56 places the market almost directly on the middle band, signaling a period of neutral price equilibrium.

MACD(12,26,9): The MACD indicator registers a reading of 1.04. Remaining slightly above the zero line, the modest value reflects weak bullish momentum for Gold (GOLD) without a strong trend acceleration.

RSI(14): The 14-period Relative Strength Index (RSI) for Gold (GOLD) stands at 48.56. Resting near the neutral 50 threshold, the indicator underscores a balanced market environment between buyers and sellers.

Support and Resistance:

Key technical boundaries for Gold (GOLD) include critical support located at 3982.57 and key resistance positioned at 4165.86. Secondary dynamic boundaries are highlighted by the lower Bollinger Band at 3993.47 and upper Bollinger Band at 4114.37.

Conclusion and Consideration:

Gold (GOLD) trades in a consolidation phase near 4053.56 on the H4 timeframe, constrained by an RSI near 48.56 and price hovering right at the 4053.92 middle Bollinger Band. Market focus remains on how price interacts with support at 3982.57 and resistance at 4165.86.

Disclaimer: The analysis provided for Gold is for informational purposes only and does not constitute investment advice. Traders are encouraged to perform their own analysis and research before making any trading decisions. Market conditions can change quickly, so staying informed with the latest data is essential.

Gold H4 technical and fundamental analysis
Gold H4 Technical and Fundamental Analysis for 08.02.2026

Gold Forecast — 3 June 2026

Time Zone: GMT +3

Time Frame: 4 Hours H4

Fundamental Analysis:

The XAUUSD pair, also known as Gold Spot versus the US Dollar, remains highly sensitive to USD news today as traders monitor ADP employment data, S&P Global Services PMI, ISM Services PMI, Factory Orders, the Fed Beige Book, EIA crude inventories, and speeches from Fed officials including Goolsbee, Barr, and Logan. Stronger than expected US labor or services data could support the US Dollar and Treasury yields, which may pressure Gold price action, while weaker data or dovish Federal Reserve commentary could increase demand for Gold as a safe haven asset. This makes today’s XAUUSD H4 technical and fundamental analysis especially important, as Gold daily chart sentiment may shift quickly depending on inflation expectations, interest rate outlook, and broader market risk appetite.

Price Action:

The Gold H4 chart shows a bearish to sideways correction, with price making lower highs beneath the red descending trendline after a strong previous rally. Current XAU/USD price action is holding near the 4471 support area, but the market remains capped below the main resistance zone around 4700, showing that sellers still control the short term structure. The broader Gold H4 forecast suggests consolidation unless buyers break above the descending triangle resistance, while a failure to hold 4471 and 4380 could extend bearish momentum toward lower support zones.

Key Technical Indicators:

Bollinger Bands(20,2.000): The Bollinger Bands on the Gold H4 chart are tightening, showing reduced volatility and a possible buildup before the next breakout. Price is trading near the lower side of the bands, which reflects weak bullish momentum and continued downside pressure. For XAU-USD technical analysis, this setup suggests that Gold may remain in consolidation unless price breaks clearly above the middle band and descending trendline.

MACD(12,26,9): The MACD is flat and slightly bearish, with values around -5.774 and -1.355, confirming weak momentum on the XAU/USD H4 chart. The lack of strong histogram expansion suggests that sellers are present but not yet driving a major impulsive move. Traders should watch for a bearish widening below the signal line or a bullish crossover to confirm the next Gold market direction.

RSI(14): The RSI is around 43, which indicates weak momentum but not yet oversold conditions. This means Gold still has room to move lower before reaching extreme downside exhaustion. In XAUUSD H4 price action analysis, RSI below the 50 level supports the bearish to neutral outlook unless buyers regain momentum above the midline.

Support and Resistance:

Support: The immediate support area is near 4471, followed by stronger downside support around 4380 and 4338 if selling pressure continues.

Resistance: The nearest resistance is around 4700, followed by 4880 and 5060, while a stronger bullish breakout could expose 5240, 5420, and 5605.

Conclusion and Consideration:

The XAU-USD H4 technical analysis shows Gold trading in a bearish to sideways correction, with price compressed under a descending red trendline and struggling to regain bullish momentum. Bollinger Bands, MACD, RSI, and Fibonacci levels all suggest caution, as Gold price action remains weak while holding near support. Fundamentally, today’s USD news, Fed speeches, ADP employment data, Services PMI, ISM PMI, Factory Orders, and Beige Book could create sharp volatility in GOLD versus the US Dollar. A breakout above 4700 may shift the Gold H4 outlook toward recovery, while a breakdown below 4471 and 4380 could strengthen the bearish daily chart forecast.

Disclaimer: The analysis provided for GOLD/USD is for informational purposes only and does not constitute investment advice. Traders are encouraged to perform their own analysis and research before making any trading decisions on GOLDUSD. Market conditions can change quickly, so staying informed with the latest data is essential.

GOLD H4 Technical and Fundamental Analysis for 06.03.2026

1GOLD = –––USD –––%
GOLD
Loading chart...