Time Zone: GMT +3
Time Frame: Daily (D1) / Weekly Outlook
Weekly Fundamental Overview:
Gold (GOLD) continues to react to broader macroeconomic trends, shifting interest rate expectations, and market risk sentiment. Strategic safe-haven flows and changes in US economic growth perspectives play a primary role in directing momentum for the precious metal across daily charts. Upcoming macroeconomic data releases offer critical context for potential price shifts in the near term.
Price Action:
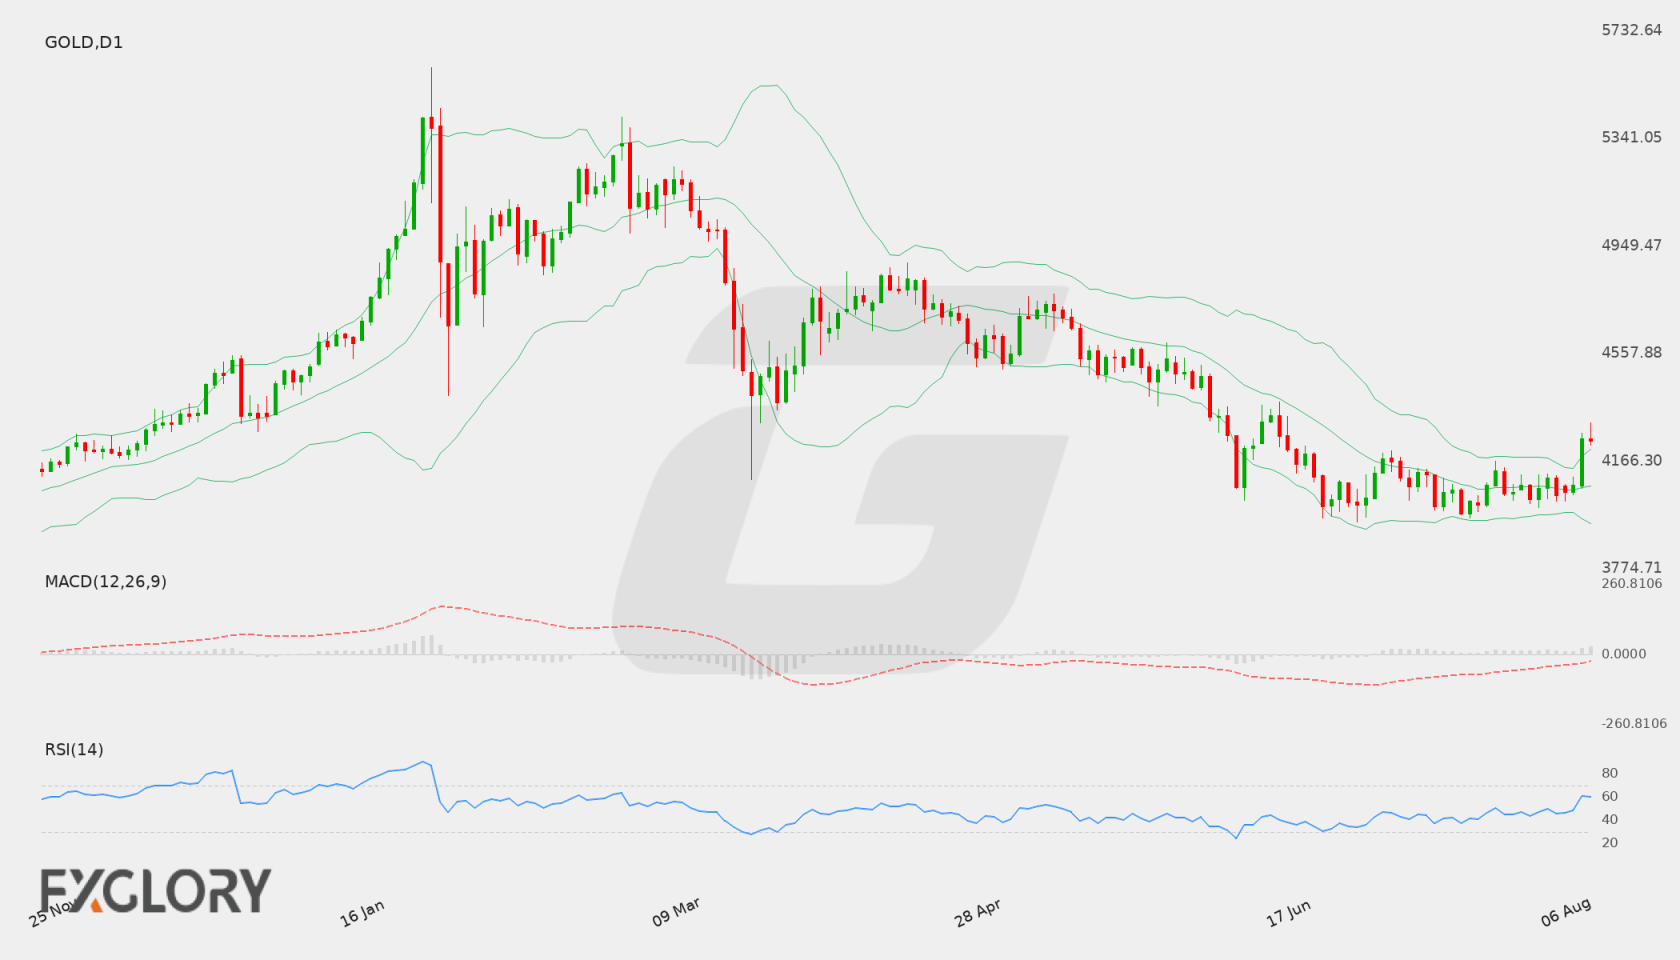
Daily chart price action for Gold (GOLD) shows a strong recent push higher, with price advancing from recent consolidation levels around 4050-4077 to close near 4239.68 after touching a daily high of 4303.86. This impulsive move demonstrates renewed bullish buying interest following periods of range-bound behavior.
Key Technical Indicators:
Bollinger Bands: The D1 Bollinger Bands show a middle line at 4074.13, an upper band at 4209.04, and a lower band at 3939.22. With the current close at 4239.68 positioned above the upper band, Gold (GOLD) reflects robust bullish strength, though prolonged trading outside the bands may prompt temporary consolidation.
RSI: The 14-day Relative Strength Index (RSI) rests at 59.78. This indicates comfortable bullish territory with healthy buying momentum while staying clear of traditional overbought thresholds.
MACD: The D1 MACD indicator posts a positive reading with the main value at 2.22, signaling active bullish momentum. The upward trajectory supports the current strength seen in price action while indicating positive underlying market force.
Support and Resistance:
Key Daily (D1) chart levels place resistance at 4665.08, which marks the overhead target level. On the downside, key support is established at 3943.33, offering a baseline floor in the event of corrective price retracements.
News to Watch for GOLD This Week:
- Core Retail Sales m/m: This metric provides insight into consumer spending habits, which can alter interest rate expectations and impact precious metals sentiment.
- Retail Sales m/m: Broad shifts in retail trade data may influence economic growth forecasts and drive volatility in bullion prices.
Weekly Outlook and Consideration:
Gold (GOLD) enters the trading week with a strong bullish posture after closing at 4239.68, above its upper daily Bollinger Band. Supported by an RSI of 59.78 and a positive MACD at 2.22, the technical bias points toward sustained momentum, provided key support at 3943.33 remains intact. Key resistance at 4665.08 stands as the primary upside level to monitor. Market participants will closely watch upcoming US retail sales releases to gauge economic momentum and determine whether current price levels can be sustained.
Disclaimer: The analysis provided for Gold is for informational purposes only and does not constitute investment advice. Traders are encouraged to perform their own analysis and research before making any trading decisions. Market conditions can change quickly, so staying informed with the latest data is essential.