
SILVER Forecast

SILVER iconUSD icon
Silver

SPOT Silver Ounce vs US Dollar

Silver Live Price

65.46500
+1.26%

Silver Forecast — 5 September 2026

Time Zone: GMT +3

Time Frame: Daily (D1) / Weekly Outlook

Weekly Fundamental Overview:

Silver (SILVER) market sentiment remains tied to global industrial demand and monetary policy expectations. Inflation updates and labor market data can significantly alter rate outlooks, impacting non-yielding assets. Market participants continue to monitor economic trends and risk sentiment for directional cues on the metal.

Price Action:

On the daily chart, Silver (SILVER) recently closed at 66.948 after recovering from a low around 64.067. Price action reflects a gradual rebound following recent consolidation, with buyers attempting to build momentum while price remains bound between key technical parameters.

Key Technical Indicators:

Bollinger Bands: The daily Bollinger Bands show the middle band at 66.280, with the upper band at 69.973 and lower band at 62.587. Silver (SILVER) trades slightly above the middle boundary, indicating a modest bullish tilt while remaining well within the band boundaries.

RSI: The 14-period Relative Strength Index (RSI) stands at 55.62, positioning Silver (SILVER) in neutral territory with a slight upward bias. This suggests balanced conditions with room for directional moves in either direction.

MACD: The MACD indicator registers at 1.227, maintaining a positive reading on the daily chart. While momentum remains constructive above the zero line, traders continue to watch for potential signal line crossovers or histogram changes.

Support and Resistance:

Key technical levels for Silver (SILVER) place primary resistance at 71.536 and major support at 54.757. Intermediate support also aligns near the lower Bollinger Band around 62.587.

News to Watch for SILVER This Week:

  • PPI m/m: Tracks producer inflation rates, providing insight into cost pressures and monetary policy expectations.
  • Core PPI m/m: Measures factory-gate price changes excluding volatile items, influencing currency dynamics and yields.
  • Unemployment Claims: Reflects weekly labor market conditions, which can influence broader economic expectations.
  • Core CPI m/m: Measures underlying consumer inflation trends, heavily impacting interest rate projections.
  • CPI y/y: Gauges overall annual consumer inflation, shaping sentiment around inflation-hedging assets.
  • Core CPI y/y: Assesses core annual price changes, offering guidance on long-term monetary policy trends.
  • CPI m/m: Tracks monthly changes in consumer prices, potentially driving short-term volatility.
  • Prelim UoM Inflation Expectations: Gauges consumer outlook on future inflation, influencing sentiment across financial markets.
  • Prelim UoM Consumer Sentiment: Evaluates consumer confidence, providing signals regarding economic stability.

Weekly Outlook and Consideration:

Silver (SILVER) holds a neutral-to-bullish posture as long as price remains above the daily middle Bollinger band near 66.280. A sustained push could see price test resistance around 71.536. On the downside, a drop below the middle band may lead to a retest of lower support levels near 62.587 and 54.757, depending on upcoming inflation and economic data releases.

Disclaimer: The analysis provided for Silver is for informational purposes only and does not constitute investment advice. Traders are encouraged to perform their own analysis and research before making any trading decisions. Market conditions can change quickly, so staying informed with the latest data is essential.
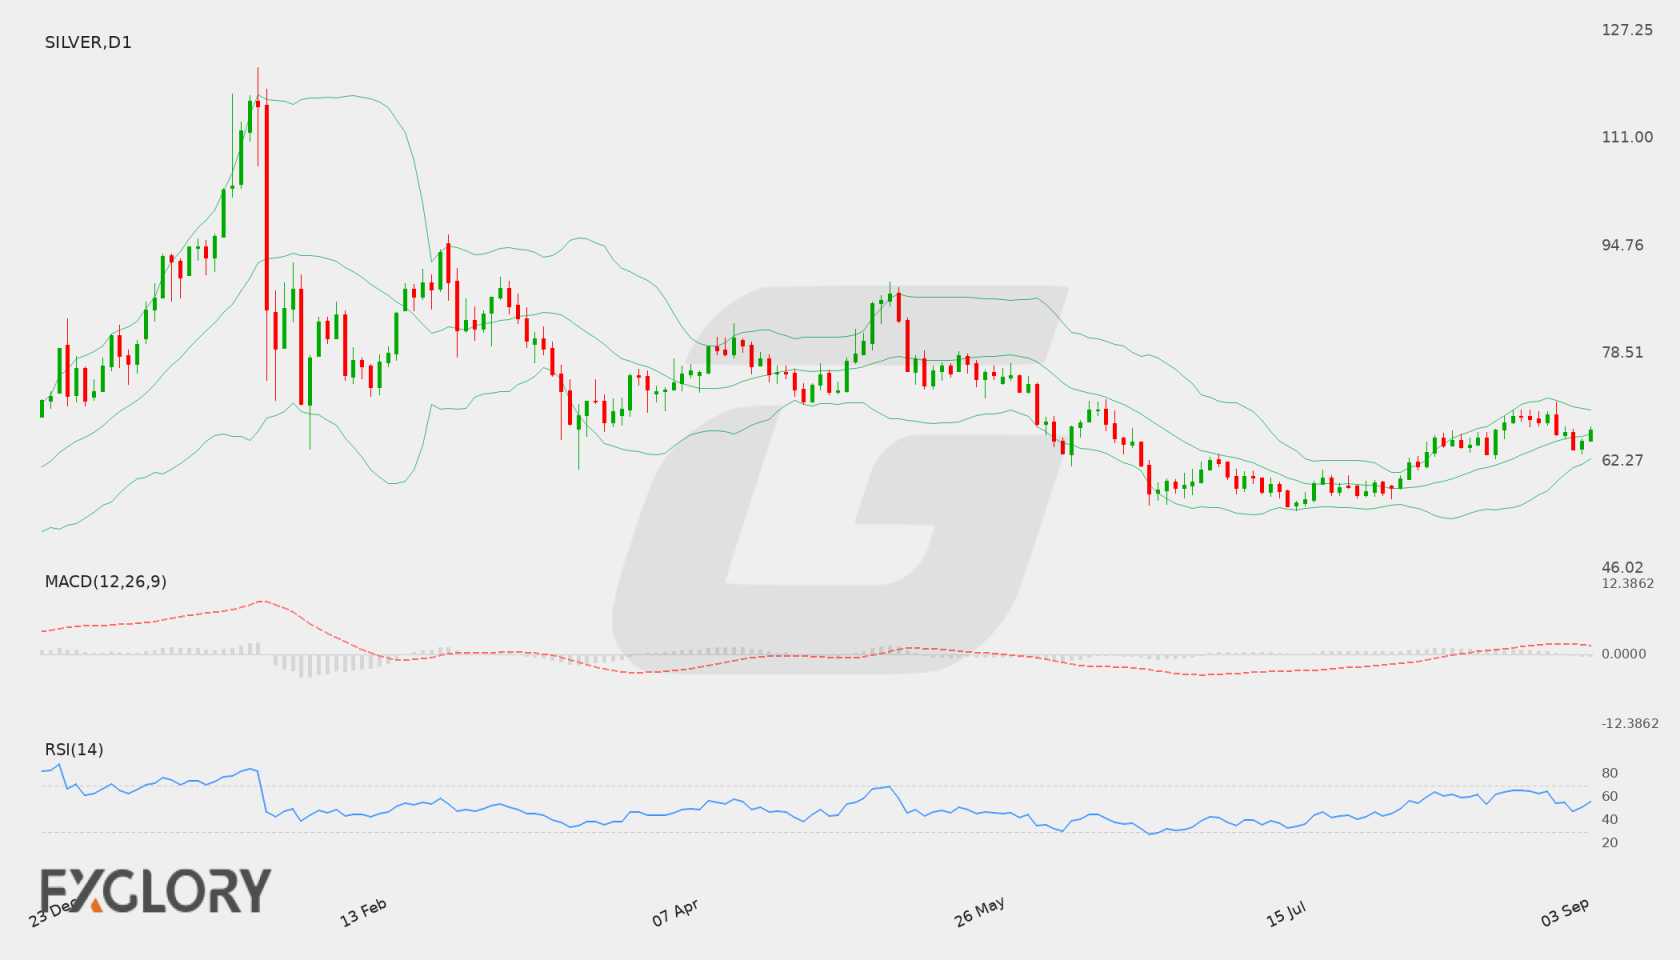
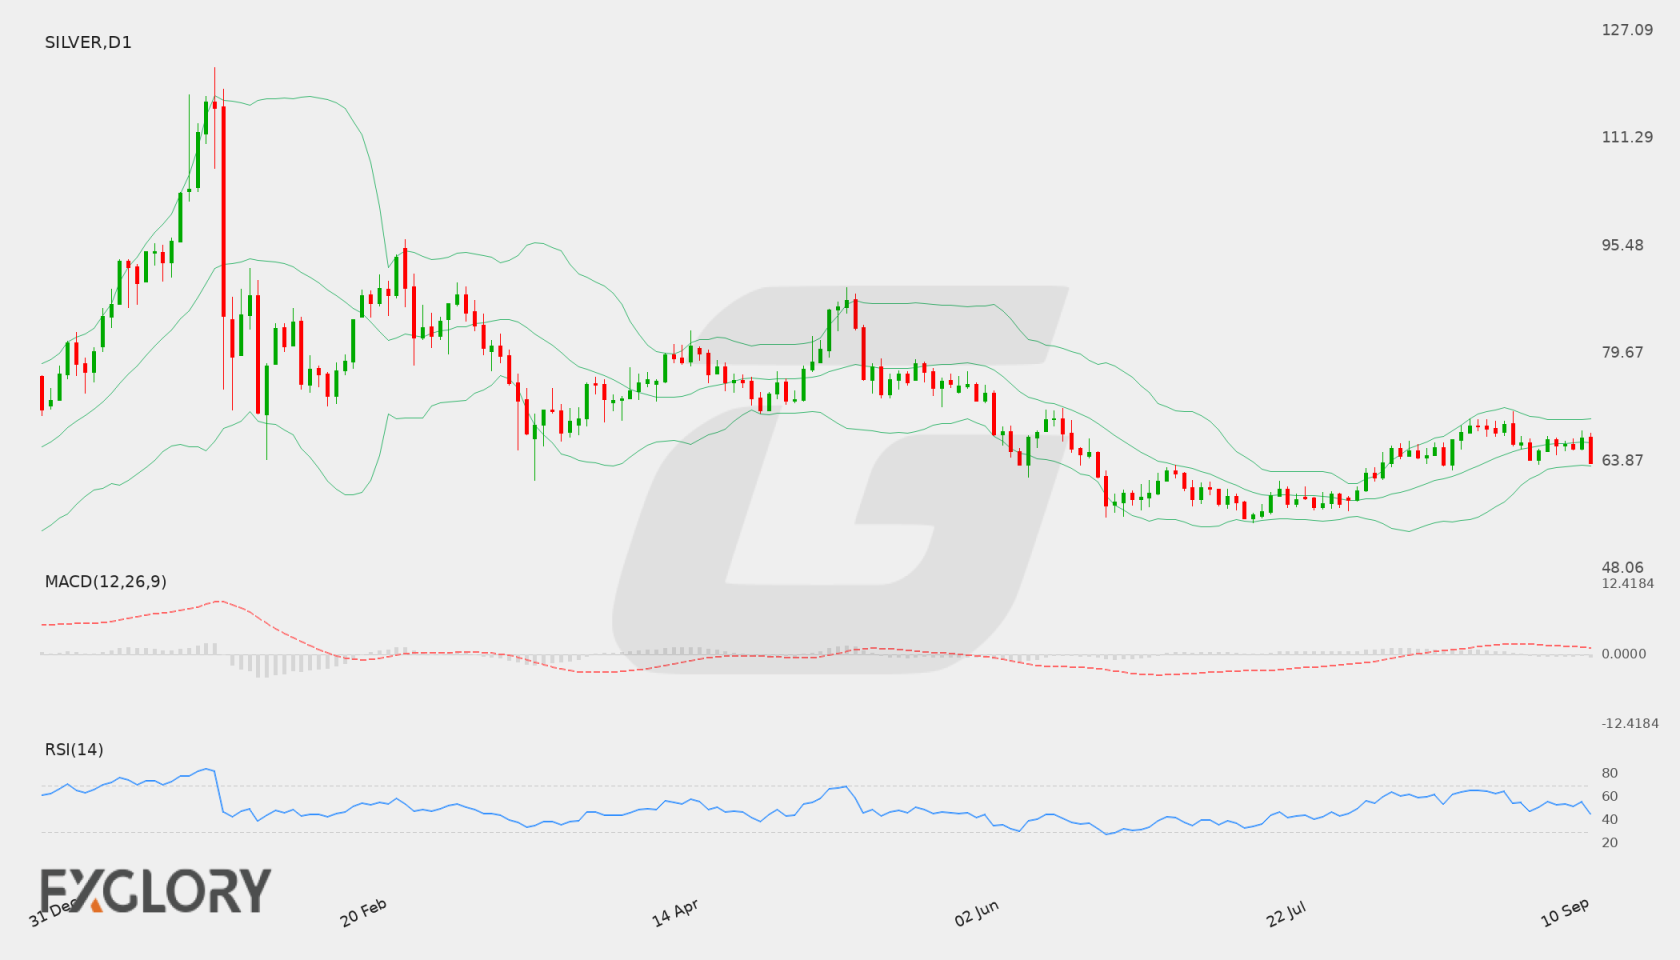
Silver D1 technical analysis chart
Silver D1 Technical Analysis for 09.05.2026

Silver Forecast — 12 September 2026

Time Zone: GMT +3

Time Frame: Daily (D1) / Weekly Outlook

Weekly Fundamental Overview:

Silver (SILVER) fundamentals remain sensitive to macroeconomic trends, interest rate expectations, and US economic performance. As a key precious metal with both industrial and investment appeal, price momentum reflects shifting investor sentiment regarding Federal Reserve policy and broad economic activity.

Price Action:

On the daily (D1) chart, Silver (SILVER) recorded a recent close of 63.562, sliding back from recent resistance at 71.138. Recent price candles reflect short-term selling momentum that has driven the price toward lower technical levels within the current trading range.

Key Technical Indicators:

Bollinger Bands: The Bollinger Bands indicator displays a middle band at 66.5506, an upper band at 70.0366, and a lower band at 63.0645. With Silver trading near 63.562, close to the lower band, price action is testing lower volatility limits, indicating potential support or room for downside expansion.

RSI: The 14-period RSI sits at 45.25, indicating neutral-to-bearish sentiment below the 50 level. This suggests modest downside bias without entering oversold territory.

MACD: The MACD value is currently at 0.6469, holding slightly above the zero line. However, declining values point to weakening bullish momentum and suggest traders should monitor for potential trend confirmation.

Support and Resistance:

Technical analysis highlights primary support at 54.757 and primary resistance at 71.138.

News to Watch for SILVER This Week:

  • Core Retail Sales m/m: Measures consumer spending changes excluding volatile sectors which can impact overall market sentiment.
  • Retail Sales m/m: Tracks broad US retail activity to gauge consumer health and economic momentum.
  • FOMC Economic Projections: Details central bank expectations for interest rates, growth, and inflation outlook.
  • FOMC Statement: Provides key monetary policy decisions and economic assessments from policymakers.
  • Federal Funds Rate: Declares the official interest rate decision influencing dollar strength and asset prices.
  • FOMC Press Conference: Features commentary explaining monetary policy stance and future policy expectations.
  • Unemployment Claims: Indicates short-term labor market trends and ongoing economic conditions.

Weekly Outlook and Consideration:

Silver (SILVER) enters the week facing short-term pressure around the 63.562 close, holding between key daily support at 54.757 and resistance at 71.138. The RSI at 45.25 and price position near the lower Bollinger Band of 63.0645 highlight cautious market sentiment. A clear bounce above the 66.5506 middle band could re-energize bullish momentum, while a break below current lower levels may keep the focus on broader support.

Disclaimer: The analysis provided for Silver is for informational purposes only and does not constitute investment advice. Traders are encouraged to perform their own analysis and research before making any trading decisions. Market conditions can change quickly, so staying informed with the latest data is essential.
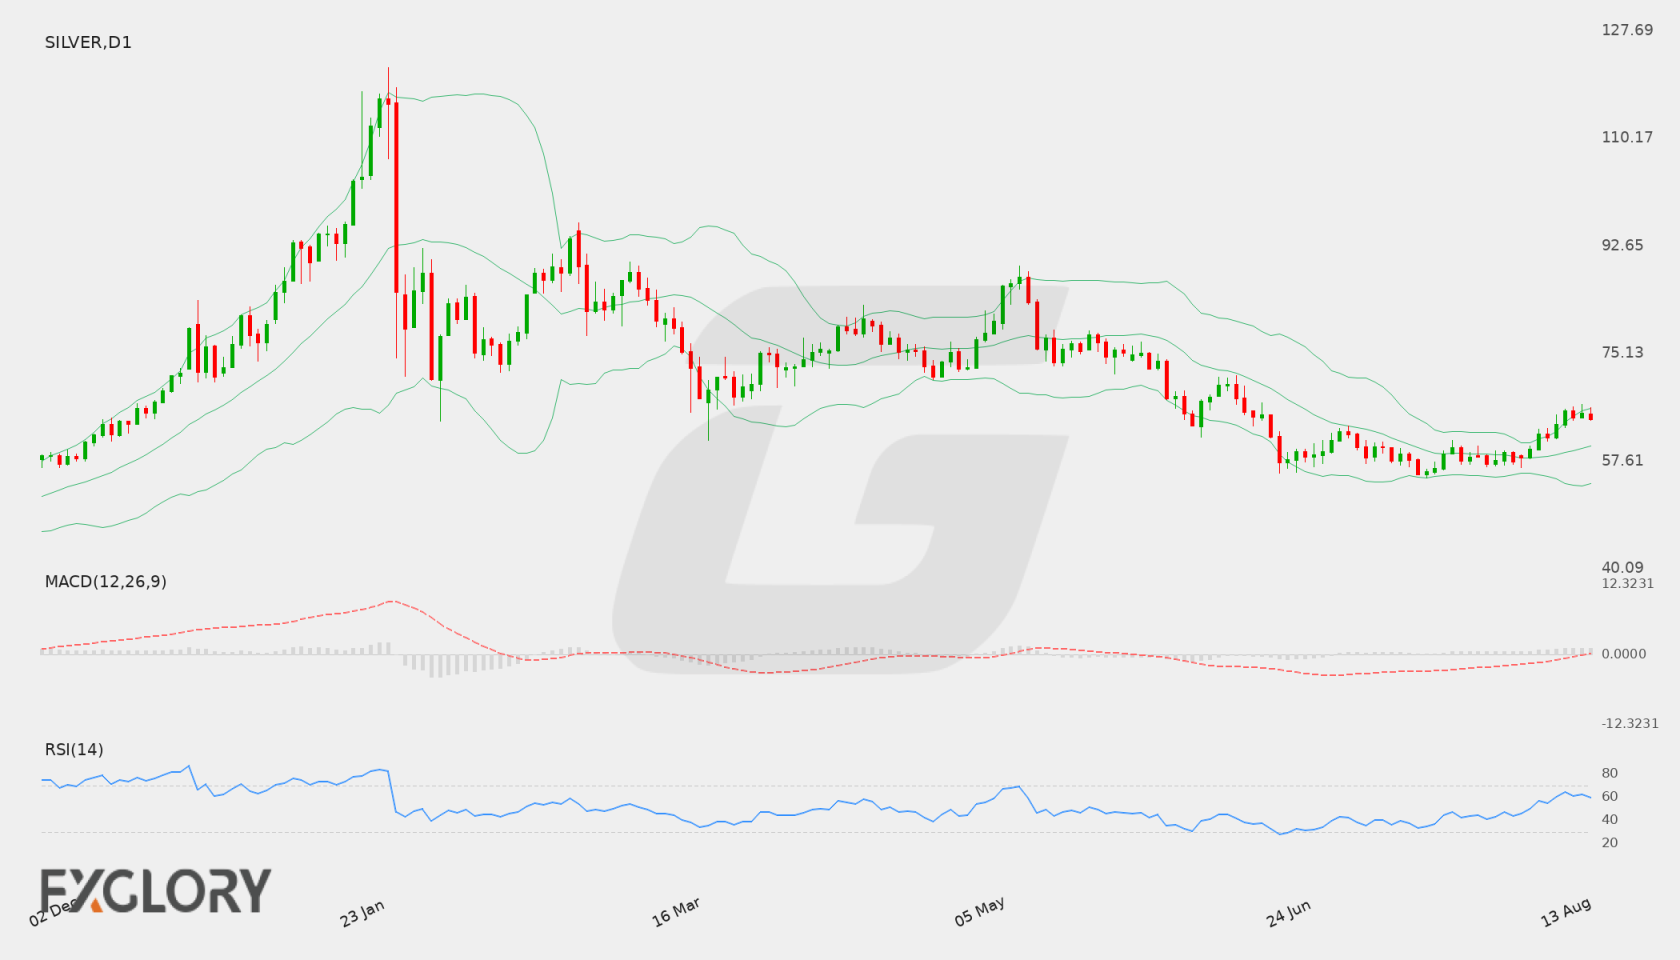
Silver D1 technical analysis chart
Silver D1 Technical Analysis for 09.12.2026

Silver Forecast — 1 September 2026

Time Zone: GMT +3

Time Frame: Daily (D1) / Weekly Outlook

Weekly Fundamental Overview:

Silver (SILVER) continues to be influenced by global macroeconomic conditions, broader industrial demand, and fluctuations in the US Dollar. As a key precious metal, price dynamics remain sensitive to shift in market risk sentiment and central bank interest rate expectations.

Price Action:

On the Daily (D1) chart, Silver (SILVER) recently retraced from peak levels near 69.25 toward 66.37 before stabilizing to close at 66.52. This movement reflects a short-term consolidation phase within a broader market structure.

Key Technical Indicators:

Bollinger Bands: The Bollinger Bands indicator on the daily chart places the middle band at 65.62, with the upper band at 70.90 and the lower band at 60.33. Trading at 66.52, Silver is positioned slightly above the central moving average, indicating equilibrium within the band boundaries.

RSI: The 14-day Relative Strength Index (RSI) reads 55.16, positioning the asset near the neutral midpoint. This balance suggests the market currently holds sufficient room to maneuver in either direction.

MACD: The MACD indicator registers at 1.8021, remaining in positive territory. This reading indicates that underlying bullish momentum is still active despite recent price corrections.

Support and Resistance:

Key daily technical levels locate primary support at 54.757 and key overhead resistance at 71.536.

News to Watch for SILVER This Week:

  • ISM Services PMI: This release measures economic activity in the service sector and may significantly affect USD valuation and precious metals.

Weekly Outlook and Consideration:

The weekly outlook for Silver (SILVER) points to potential range-bound movement above the daily middle Bollinger Band at 65.62. With an RSI of 55.16 and a positive MACD value of 1.8021, positive momentum remains intact. A sustained rise would require buyers to test resistance at 71.536, whereas a downside push could see initial support tested around the lower band of 60.33 before reaching major support at 54.757.

Disclaimer: The analysis provided for Silver is for informational purposes only and does not constitute investment advice. Traders are encouraged to perform their own analysis and research before making any trading decisions. Market conditions can change quickly, so staying informed with the latest data is essential.

Silver Forecast — 22 August 2026

Time Zone: GMT +3

Time Frame: Daily (D1) / Weekly Outlook

Weekly Fundamental Overview:

Silver remains sensitive to scheduled market events and broader risk sentiment. Traders should watch high-impact calendar releases and USD movement where relevant before forming a directional view.

Price Action:

SILVER is trading near 68.079, with current daily movement framed by nearby support and resistance.

Key Technical Indicators:

Bollinger Bands: Price is being assessed against the 20-period Bollinger Bands, with middle band near 62.08115, upper band near 69.089067729968, and lower band near 55.073232270032.

RSI: RSI(14) is near 64.209947507314, suggesting traders should watch whether momentum holds, reaches overbought pressure, or weakens toward oversold territory.

MACD: MACD is near 1.635811204888, so momentum should be watched for continuation or loss of strength on the daily chart.

Support and Resistance:

Key support is near 54.757, while key resistance is near 76.988.

News to Watch for SILVER This Week:

  • Watch scheduled high-impact releases, central bank comments, and broader risk sentiment this week; no specific calendar events are available in current plugin data.

Weekly Outlook and Consideration:

Silver may remain guided by daily price action, support and resistance reactions, momentum indicators, and supplied calendar events. Traders should wait for confirmation around key levels and avoid assuming that current conditions guarantee the next move.

Disclaimer: The analysis provided for Silver is for informational purposes only and does not constitute investment advice. Traders are encouraged to perform their own analysis and research before making any trading decisions. Market conditions can change quickly, so staying informed with the latest data is essential.

Silver Forecast — 15 August 2026

Time Zone: GMT +3

Time Frame: Daily (D1) / Weekly Outlook

Weekly Fundamental Overview:

Silver (SILVER) price dynamics remain tied to macroeconomic expectations surrounding central bank interest rate policies and industrial demand trends. Shift in economic indicators and market liquidity directly impact trading sentiment across precious metals markets.

Price Action:

On the daily chart, Silver (SILVER) staged a push up toward recent highs around 65.721 before easing back slightly to settle at 64.427. Price action remains positioned above the 20-day moving average, signaling an ongoing effort by buyers to build a higher trading base.

Key Technical Indicators:

Bollinger Bands: The daily Bollinger Bands reveal a middle band at 60.062, an upper band at 66.205, and a lower band at 53.918. With Silver (SILVER) trading at 64.427 near the upper boundary, price action reflects firm upside engagement within the current volatility channel.

RSI: The 14-day RSI currently reads 59.08, positioning the indicator in constructive territory above the neutral 50 level. This reading denotes moderate buying strength while remaining well below overbought thresholds.

MACD: The MACD indicator registers a reading of 1.008, holding comfortably above the zero mark. This positive value suggests that upside momentum continues to dominate short-term structure, though convergence would indicate potential slowing.

Support and Resistance:

Key technical levels for Silver (SILVER) are anchored by main support at 54.757 and major resistance at 78.809. Dynamic levels include the middle Bollinger Band at 60.062 as intermediate support and the upper band at 66.205 as near-term resistance.

News to Watch for SILVER This Week:

  • Prelim Benchmark Payrolls Revision: Revisions to historical labor data can alter expectations regarding overall economic strength and monetary policy.
  • FOMC Meeting Minutes: Detailed records of policy discussions offer guidance on future interest rate paths influencing precious metals.
  • Unemployment Claims: Weekly employment figures provide timely updates on labor market trends affecting market sentiment.
  • Philly Fed Manufacturing Index: Regional business outlook metrics give insight into broader manufacturing trajectory and industrial demand.
  • Flash Manufacturing PMI: Preliminary manufacturing data highlights economic performance and industrial sector growth prospects.

Weekly Outlook and Consideration:

Silver (SILVER) maintains a moderately positive stance as it trades at 64.427, held up by an RSI of 59.08 and a positive MACD of 1.008. If bullish momentum pushes price beyond the upper Bollinger Band near 66.205, buyers may target structural resistance closer to 78.809. Alternatively, a move beneath the middle band at 60.062 could open the way toward primary support at 54.757.

Disclaimer: The analysis provided for Silver is for informational purposes only and does not constitute investment advice. Traders are encouraged to perform their own analysis and research before making any trading decisions. Market conditions can change quickly, so staying informed with the latest data is essential.

Silver D1 technical analysis chart
Silver D1 Technical Analysis for 08.15.2026
1SILVER = –––USD –––%
SILVER
Loading chart...