

Quick Answer: What Is Volatility in Forex?
In practical trading terms, volatility tells you how active or unstable price movement is. A calm pair may move in a narrow range. A volatile pair may swing sharply, move through price areas quickly, reverse suddenly, or move farther than expected within the same trading session.
The key idea is:
Forex volatility = the size and speed of currency price movement over a chosen timeframe.
Volatility can create opportunity because price has more room to move. It can also create danger because prices can move faster than expected, spreads can widen, slippage can increase, and stop-loss orders can be triggered more easily. More movement also means a normal-looking position size can become too large for the current market.
Volatility should not be treated as a trade signal by itself. It does not tell you whether to buy or sell. It tells you whether price movement is expanding, contracting, calm, or unstable. Traders use volatility to judge whether stop distance, position size, leverage and timing are realistic for current conditions.
Forex Volatility Meaning
Forex volatility means the degree of price movement in a currency pair over a specific period. The more a pair moves, and the faster it moves, the more volatile it is.
Always ask: volatility over what timeframe? A pair can be quiet on a 5-minute chart but volatile over a week. Another pair can be active intraday but still range-bound over a month.
| Volatility Type | Meaning |
|---|---|
| High volatility | Price is making larger or faster moves. |
| Low volatility | Price is moving more slowly or within a smaller range. |
| Rising volatility | Recent price ranges are expanding. |
| Falling volatility | Recent price ranges are contracting. |
| Historical volatility | How much price moved in the past. |
| Implied volatility | Market expectations of future volatility, often reflected in options pricing. |
Most beginner forex volatility discussions focus on historical or realized volatility because traders usually look at recent price movement, average ranges, candles, ATR, or chart behavior. Implied volatility is more common in options-related analysis and should not be confused with basic chart volatility.
How Volatile Is Forex?
Forex can be highly volatile, but not all pairs, sessions or market conditions behave the same way. Volatility changes by pair, session, timeframe, news, liquidity, central-bank policy, expectations and broader market conditions.
Major currency pairs are often more liquid and sometimes more stable during normal conditions, but they can still become highly volatile around major events. Exotic pairs may show larger swings because they often have thinner liquidity, wider spreads, and more local policy or political risk.
For USD pairs, volatility can change sharply around U.S. CPI, PCE inflation, Nonfarm Payrolls, FOMC decisions, Fed projections, Fed Chair press conferences, Federal Reserve speeches, Treasury-yield moves, U.S. holidays, and major New York session events.
Volatility is most useful when tied to a specific pair, timeframe and current market condition. A trader should judge volatility based on what is happening now, not only on a pair's reputation.
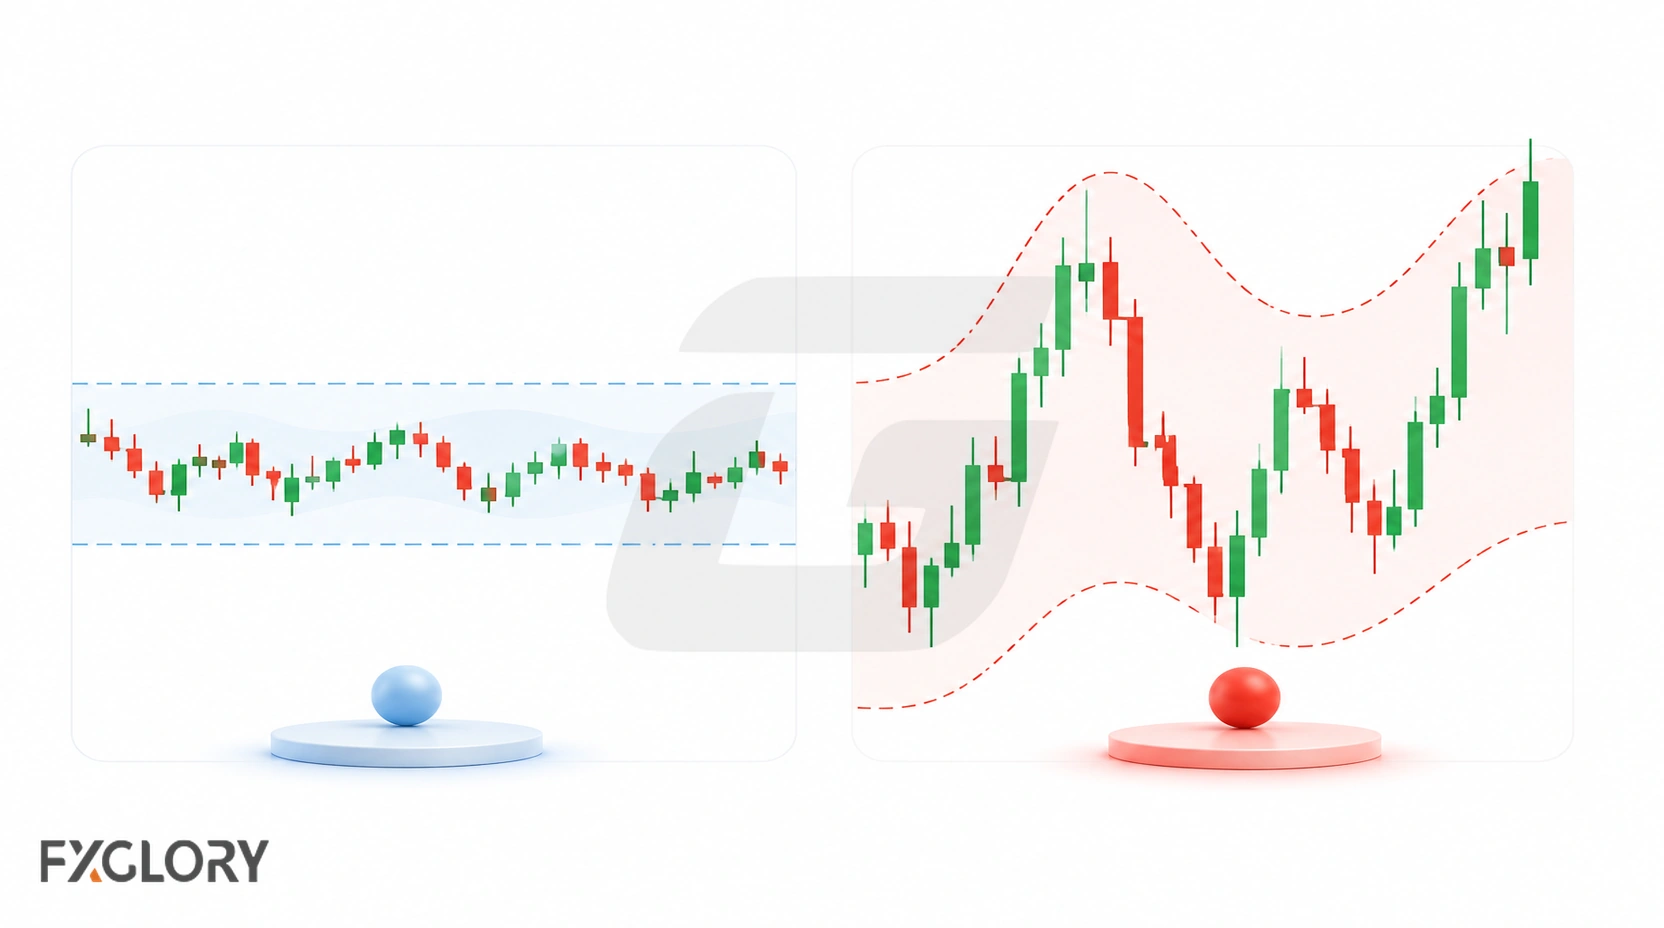
High vs Low Volatility in Forex
High and low volatility create different trading conditions. Neither one is automatically good or bad.
| Condition | What It Means | Main Risk |
|---|---|---|
| High volatility | Price is moving faster or farther than usual. | Wider stops, larger swings, slippage, emotional trading, rapid losses. |
| Low volatility | Price is moving more slowly or within a tighter range. | False breakouts, choppy ranges, small targets, overtrading, sudden expansion. |
| Volatility expansion | Market ranges are getting larger. | Existing stops and position sizes may become too tight or too large. |
| Volatility contraction | Market ranges are getting smaller. | Breakout traders may get trapped by fake moves or slow follow-through. |
High volatility can create more movement to trade, but it also increases the chance of wider spreads, slippage, stop-outs, and rapid account losses. Low volatility can look safer, but quiet markets can still become frustrating or dangerous if traders overtrade small moves or ignore sudden expansion risk.
What Causes Forex Market Volatility?
Forex market volatility usually increases when new information changes expectations or when market participants react strongly to risk, policy or liquidity conditions.
Scheduled events can create volatility when traders react to known calendar releases such as inflation reports, jobs data, central-bank decisions and speeches. Unscheduled volatility can come from surprise events such as geopolitical shocks, emergency policy action, sudden intervention, crisis headlines or unexpected risk-off moves.
Markets often react to the gap between forecast and actual data, not only to the data release itself. A report can trigger strong volatility when the actual number or policy message differs sharply from what traders expected.
Common causes of forex volatility include:
- Central-bank decisions: Interest-rate decisions, policy statements, projections, press conferences and speeches can change currency expectations quickly.
- U.S. data releases: U.S. CPI, PCE inflation, Nonfarm Payrolls, unemployment data, retail sales, GDP, ISM/PMI data and other releases can create sharp movement in USD pairs.
- FOMC and Federal Reserve events: FOMC decisions, Fed projections, Fed Chair press conferences and Federal Reserve speeches can affect USD volatility and global risk sentiment.
- Inflation and interest-rate expectations: Currency markets often react when inflation, real-rate expectations or policy expectations change.
- Geopolitical events: Conflict, sanctions, elections, trade tensions and crisis headlines can trigger sudden risk repricing.
- Liquidity changes: Thin liquidity can make price swings larger because fewer orders are available to absorb flow.
- Trading sessions: Volatility can change as Asian, European, London and New York participants become active.
- Session overlaps: The London-New York overlap can be more active for major pairs.
- Market sentiment: Risk-on and risk-off shifts can affect safe-haven currencies and risk-sensitive currencies.
- Large order flow: Institutional positioning, hedge adjustments, corporate flows and stop-loss clusters can contribute to sharp movement. Large orders can accelerate movement when many participants are positioned the same way or forced to exit.
News does not move a currency only because a headline exists. It moves price when the news changes expectations and enough participants respond with orders.
For more on the groups behind major market moves, see forex market participants.
Volatility vs Liquidity, Volume and Spread
Volatility is often confused with liquidity, volume and spread. They are connected, but they are not the same thing.
| Term | Meaning | Why It Matters |
|---|---|---|
| Volatility | How much and how quickly price moves. | Shows movement size and risk conditions. |
| Liquidity | How easily trades execute near the quoted price. | Affects fills, slippage and execution stability. |
| Volume | How much trading activity occurs. | Can show activity, but spot forex volume is not centralized. |
| Spread | The difference between bid and ask. | Affects the cost of entering or exiting a trade. |
| Slippage | The difference between expected price and final execution price. | Can increase during fast or thin conditions. |
A market can be liquid and volatile at the same time. For example, a major USD pair may have deep liquidity but still move sharply during a Federal Reserve decision. A market can also be illiquid and volatile, where thin depth makes every move more unstable.
Volatility measures movement. Liquidity affects execution. Spread affects transaction cost. Slippage affects the final fill. Keep those ideas separate.
For the execution side, see what is liquidity in forex. For spread basics, see bid and ask price in forex.
How to Measure Forex Volatility
Forex volatility can be measured in several ways. The best method depends on whether you want a simple recent range, an indicator reading, or a pair comparison.
| Method | What It Shows | Limitation |
|---|---|---|
| Recent high-low range | How far price moved over a chosen period. | Simple, but can be distorted by one large candle. |
| Pip movement | How many pips a pair moved. | Raw pips can be misleading when comparing very different pairs. |
| Percentage movement | Movement relative to the pair's price. | Better for comparisons, but still depends on timeframe. |
| Average True Range | Average recent candle range. | Does not show direction. |
| Standard deviation | How much price varies from an average. | Historical and can be affected by outliers. |
| Volatility calculator | Pair movement in pips or percentage over selected periods. | Depends on timeframe and data source. |
A simple range example: if EUR/USD moves 70 pips in one day and its recent normal daily range has been closer to 40 pips, that day is more volatile than normal for that pair and timeframe.
Pip volatility shows the distance a pair moved in pips. Percentage volatility shows movement relative to price. A 100-pip move on one pair may represent a different percentage move and money impact than 100 pips on another pair. For comparing very different pairs, percentage movement can be more meaningful than raw pips.
In spot forex, platform volume or tick volume may not represent the whole global market because there is no single centralized spot forex volume feed.
ATR, Bollinger Bands and Volatility Tools
Volatility tools can help traders understand movement conditions, but they are not buy or sell signals by themselves.
| Tool | What It Shows | What It Does Not Show |
|---|---|---|
| ATR | The average range a pair has moved over a selected number of candles. | Direction. ATR can rise in both falling and rising markets. |
| Bollinger Bands | Expansion or contraction around a moving average. | Guaranteed reversal or breakout direction. |
| Standard deviation | Statistical variation from an average. | Future certainty or trade direction. |
| Volatility calculator | Movement in pips or percentage over selected timeframes. | Whether the next trade should be long or short. |
| Recent range | How far price has moved from recent high to low. | Whether that range will continue. |
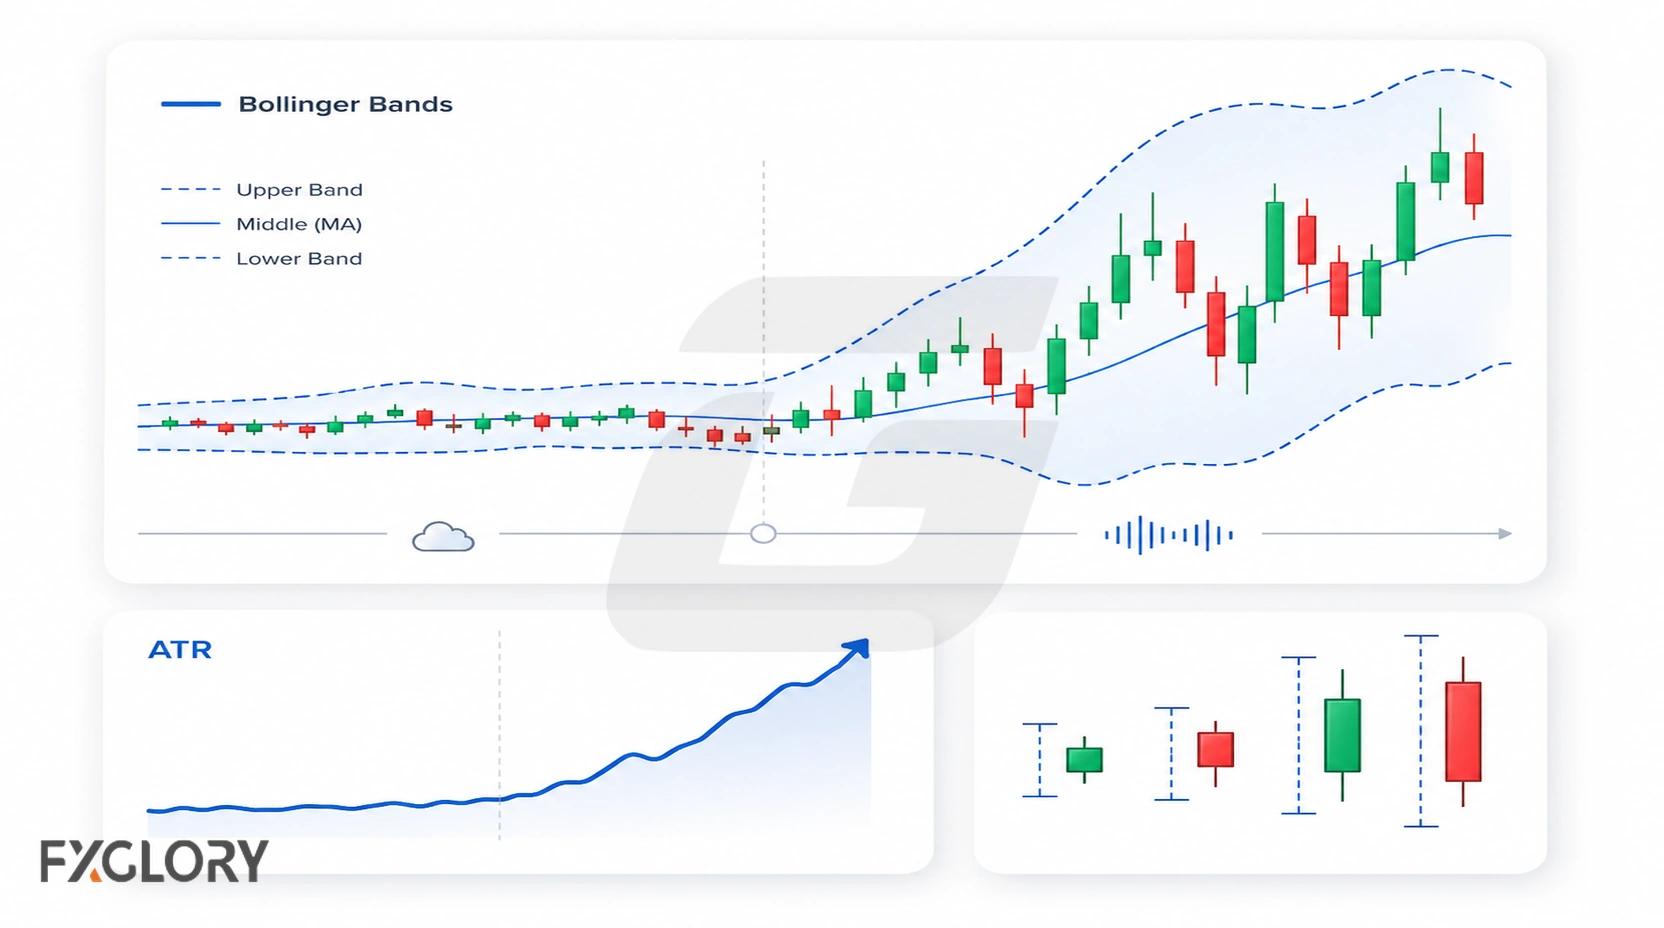
ATR, or Average True Range, is one of the simplest volatility tools. It shows the average price range a pair has moved over a selected number of candles. Many platforms use 14 periods as a default setting, but the selected period should match the trader's timeframe and purpose.
If ATR rises, recent price ranges are expanding. If ATR falls, recent price ranges are contracting. For example, if a pair's ATR rises from 45 pips to 90 pips, recent ranges have roughly doubled. A stop that was reasonable in a 45-pip environment may be too tight in a 90-pip environment.
Bollinger Bands and similar tools can show when price ranges are expanding or contracting. Widening bands can show expanding volatility, while narrowing bands can show contracting volatility. Wide bands can happen during sharp upward moves, sharp downward moves, or unstable two-way movement.
When using a volatility calculator, compare pairs over the same timeframe and check both pips and percentage movement. Different platforms can show slightly different readings because price feeds, calculation settings and data sources can differ.
Which Forex Pairs Are More Volatile?
The most volatile forex pairs can change by timeframe, news, liquidity, policy and market conditions. Avoid relying on a fixed top-10 list unless the data is updated regularly.
Instead, think in pair categories:
| Pair Type | Typical Volatility Behavior | Risk Note |
|---|---|---|
| Major pairs | Often more liquid and sometimes more stable during normal conditions. | Can still become volatile around major news or central-bank events. |
| Yen crosses | Can move sharply during risk sentiment shifts, carry-trade changes or policy surprises. | May react strongly to safe-haven flows, carry-trade appetite and Japan-related policy news. |
| Commodity pairs | Can respond to commodities, global growth, China demand and risk sentiment. | AUD, CAD and NZD pairs may move sharply when commodity prices or global demand expectations change. |
| Exotic pairs | Often more volatile because of thinner liquidity and local risks. | Can have wider spreads, higher slippage and sharper gaps. |
Pairs such as GBP/JPY or some exotic pairs may show larger swings during certain periods, but current data matters more than reputation. A pair can be generally calm but volatile during news. A pair can be generally volatile but quiet during a specific session. Always check current volatility, not just the pair's reputation.
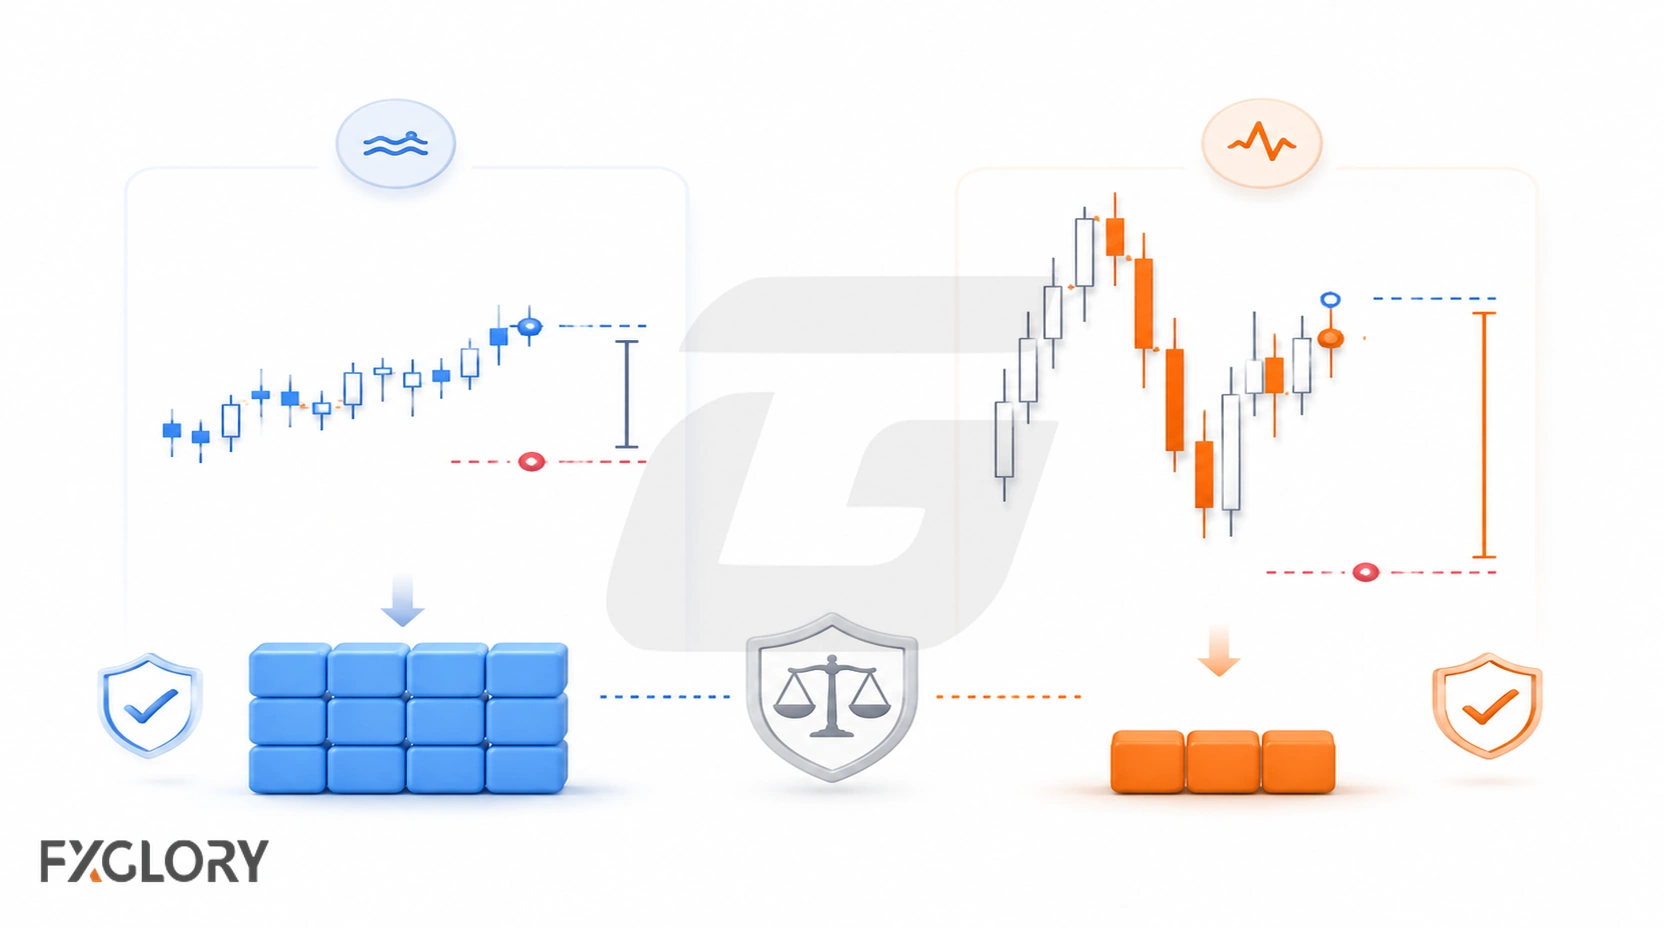
How Volatility Affects Risk, Stops and Position Size
Volatility directly affects trade risk. When price ranges expand, the same stop-loss distance may become too tight and the same position size may become too risky.
Higher volatility usually requires one or more adjustments:
- Wider stop distance: A stop that works in calm conditions may be too tight during volatile conditions.
- Smaller position size: If stop distance increases, position size may need to decrease to keep account risk controlled.
- Lower leverage: Leverage can magnify fast price swings and make losses grow quickly.
- Fewer trades: Volatile markets can tempt overtrading and emotional decisions.
- Spread and slippage checks: Fast movement can make execution worse than expected.
- Strategy filter: Some strategies need volatility; others perform better in calmer conditions.
Simple risk example: if a trader uses a 30-pip stop in calm conditions, then volatility expands and a realistic stop becomes 60 pips, keeping the same lot size roughly doubles the pip risk. To keep risk similar, the trader would need to reduce position size.
Position size should be based on account risk, stop distance and pip value, not only on how attractive the setup looks. In high volatility, leverage reduces the amount of adverse movement needed to damage the account.
When volatility rises, do not automatically trade bigger because the moves look larger. Larger movement can mean larger opportunity, but it can also mean larger losses and less forgiving execution.
For related basics, see how to calculate pips in forex and best leverage for forex.
How to Check Volatility Before Trading
Before trading, use volatility as a market-condition filter. The goal is not to avoid movement. The goal is to know whether current movement fits the trade plan.
- Check the pair: Major, minor, yen cross, commodity pair, or exotic pair.
- Check the timeframe: Ask whether volatility is being measured over minutes, hours, days, weeks, or months.
- Compare current volatility with normal volatility: Check whether current ranges are larger or smaller than that pair's recent normal range.
- Check recent range: Compare current candle ranges with normal ranges for that pair.
- Check ATR or another volatility tool: See whether price ranges are expanding or contracting.
- Check the news calendar: Watch for CPI, PCE inflation, Nonfarm Payrolls, FOMC decisions, Fed Chair press conferences, central-bank speeches, and other major releases.
- Separate scheduled and unscheduled risk: Scheduled events can be planned for; sudden shocks cannot.
- Decide when to trade around news: Do not assume all volatility is tradable before, during, or immediately after major releases.
- Check the session: Volatility can change during Asian, London, New York, and overlap periods.
- Check spread: Wider spreads can make volatile conditions more expensive.
- Check liquidity: Thin liquidity can make volatile moves more unstable.
- Check stop distance: Make sure the stop is not unrealistically tight for current movement.
- Check position size: Reduce size if wider stops are needed to keep account risk controlled.
- Check leverage: Avoid letting leverage turn normal volatility into excessive account risk.
- Check strategy fit: Confirm whether your strategy is designed for high-volatility, low-volatility, trend, or range conditions.
- Check your assumption: Do not confuse movement with direction.
Common Myths About Forex Volatility
Many beginner mistakes come from misunderstanding what volatility does and does not mean. Avoid these myths:
- Myth 1: High volatility means easy profit. High volatility creates movement, but it also increases risk, spread changes, slippage, and emotional mistakes.
- Myth 2: Low volatility means no risk. Low volatility can lead to false breakouts, choppy price action, overtrading, and sudden expansion.
- Myth 3: Volatility shows direction. Volatility shows movement size, not whether price will rise or fall.
- Myth 4: ATR tells you when to buy or sell. ATR shows average range, not direction.
- Myth 5: The most volatile pairs are always best to trade. More movement can also mean wider spreads, larger stops, and more slippage.
- Myth 6: A volatile market must be illiquid. A market can be liquid and volatile at the same time, especially during major news.
- Myth 7: A quiet market will stay quiet. Low-volatility periods can be followed by sudden volatility expansion.
- Myth 8: The same stop works in all volatility conditions. Stop distance should reflect current movement, not only habit.
- Myth 9: Big movement always means a clean trend. Volatility can also create two-way chop, sharp reversals and false breakouts.
Quick Recap: Forex Volatility
Volatility in forex means how much and how quickly a currency pair's price moves over a specific period. High volatility means larger or faster price swings. Low volatility means smaller or slower price movement.
Volatility does not show direction. It only shows movement size. A volatile market can move up, down, or both during the same period.
Forex volatility changes by pair, timeframe, trading session, news, central-bank policy, liquidity, market sentiment, expectations and order flow. For USD pairs, U.S. CPI, PCE inflation, Nonfarm Payrolls, FOMC decisions, Fed Chair press conferences, Federal Reserve speeches, Treasury-yield moves, U.S. holidays and New York session events can be especially important.
Use volatility to adjust stop distance, position size, leverage, trade timing and expectations. Do not use volatility tools as standalone buy or sell signals.