
Platinum Forecast

PLATINUM iconUSD icon
Platinum

SPOT Platinum Ounce vs US Dollar

Platinum Live Price

1820.63000
+0.01%

Platinum Forecast — 5 September 2026

Time Zone: GMT +3

Time Frame: Daily (D1) / Weekly Outlook

Weekly Fundamental Overview:

Platinum remains sensitive to scheduled market events and broader risk sentiment. Traders should watch high-impact calendar releases and USD movement where relevant before forming a directional view.

Price Action:

Platinum is trading near 1822.41, with current daily movement framed by nearby support and resistance.

Key Technical Indicators:

Bollinger Bands: Price is being assessed against the 20-period Bollinger Bands, with middle band near 1792.1745, upper band near 1894.9435006714, and lower band near 1689.4054993286.

RSI: RSI(14) is near 56.560527925331, suggesting traders should watch whether momentum holds, reaches overbought pressure, or weakens toward oversold territory.

MACD: MACD is near 27.835292891054, so momentum should be watched for continuation or loss of strength on the daily chart.

Support and Resistance:

Key support is near 1532.81, while key resistance is near 1908.94.

News to Watch for Platinum This Week:

  • Watch scheduled high-impact releases, central bank comments, and broader risk sentiment this week; no specific calendar events are available in current plugin data.

Weekly Outlook and Consideration:

Platinum may remain guided by daily price action, support and resistance reactions, momentum indicators, and supplied calendar events. Traders should wait for confirmation around key levels and avoid assuming that current conditions guarantee the next move.

Disclaimer: The analysis provided for Platinum is for informational purposes only and does not constitute investment advice. Traders are encouraged to perform their own analysis and research before making any trading decisions. Market conditions can change quickly, so staying informed with the latest data is essential.
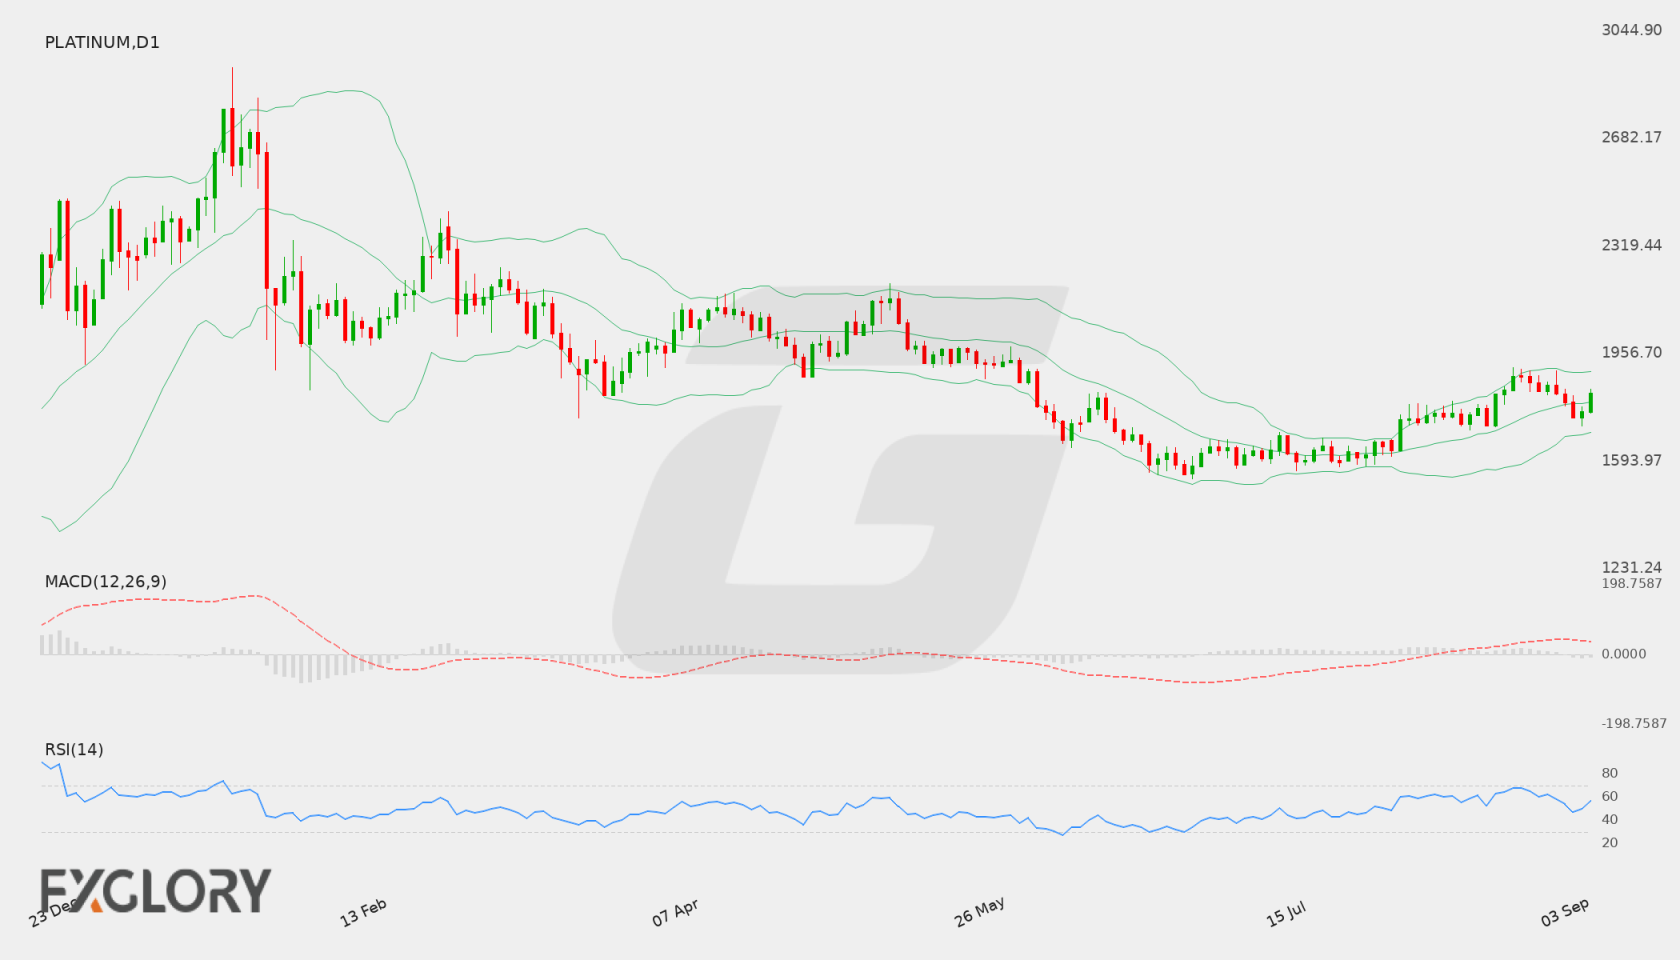
Platinum D1 technical analysis chart
Platinum D1 Technical Analysis for 09.05.2026

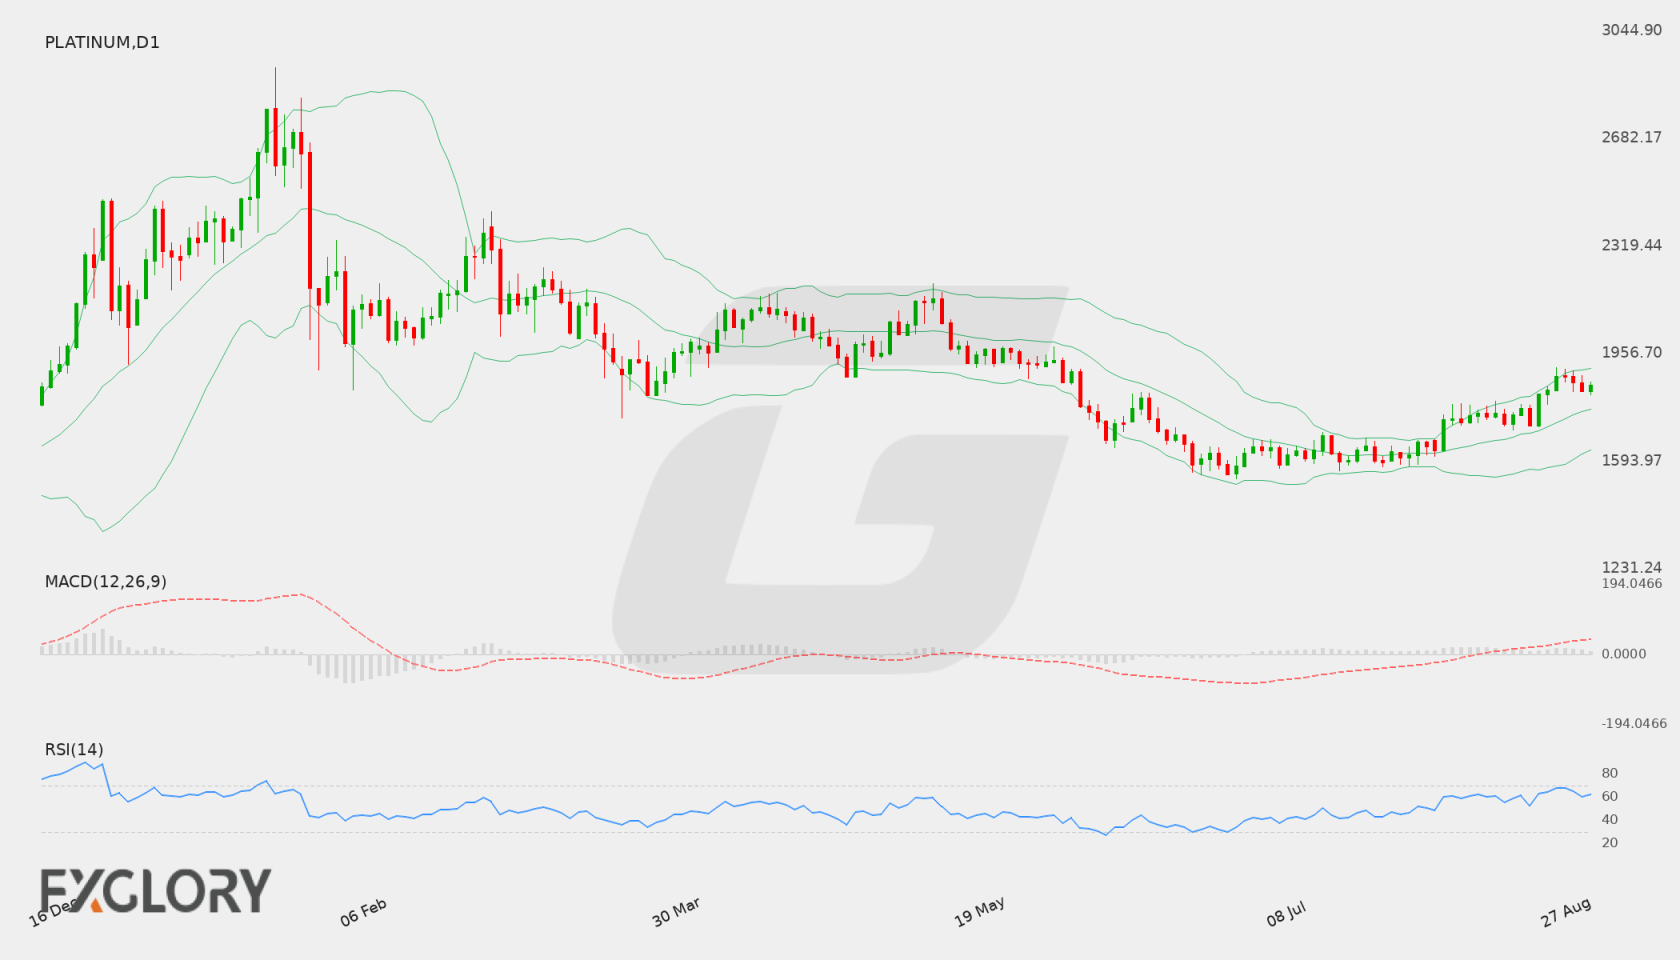
Platinum Forecast — 29 August 2026

Time Zone: GMT +3

Time Frame: Daily (D1) / Weekly Outlook

Weekly Fundamental Overview:

Platinum prices reflect broader macroeconomic trends, industrial demand, and shifts in global risk sentiment. Economic readings from major global economies continue to guide precious metals pricing, influencing investor sentiment and industrial sector expectations.

Price Action:

On the daily (D1) timeframe, Platinum closed recently at 1848.46, having recently tested high levels near 1879.61 and encountering resistance near 1908.94. Price action demonstrates an upward trajectory over recent sessions, staying well above recent swing lows near 1715.16.

Key Technical Indicators:

Bollinger Bands: The Bollinger Bands indicate a bullish expansion with the middle band at 1768.75, lower band at 1630.68, and upper band at 1906.82. The current close at 1848.46 sits in the upper half of the band structure, reflecting steady buying pressure near the upper threshold.

RSI: The 14-period Relative Strength Index (RSI) stands at 61.91. This indicates bullish sentiment without entering oversold or extreme overbought territory, allowing room for further directional movement in either direction.

MACD: The MACD indicator prints a positive value of 49.43, confirming strong upward momentum. The positive reading suggests bulls maintain control, though traders monitor for potential momentum deceleration near key overhead levels.

Support and Resistance:

Key technical levels on the daily chart place immediate resistance at 1908.94, near the upper Bollinger Band. On the downside, critical technical support is identified at 1532.81, with interim dynamic support provided by the middle Bollinger Band at 1768.75.

News to Watch for Platinum This Week:

  • ISM Manufacturing PMI: Manufacturing sentiment updates offer key insights into industrial activity and industrial metal demand.
  • JOLTS Job Openings: Labor demand metrics influence broader economic health expectations and market sentiment.
  • ISM Manufacturing Prices: Sub-index price data provides clues regarding inflationary pressure in the industrial sector.
  • ADP Non-Farm Employment Change: Early private sector employment data can shift expectations ahead of official labor figures.
  • ISM Services PMI: Economic momentum in the services sector drives overall market risk preference and dollar dynamics.
  • Non-Farm Employment Change: Official employment figures strongly impact overall economic growth projections and metal pricing.
  • Unemployment Rate: Changes in the jobless rate provide crucial clues regarding labor market stability and investor sentiment.
  • Average Hourly Earnings m/m: Wage growth metrics signal underlying inflationary trends that influence broader financial markets.

Weekly Outlook and Consideration:

Platinum enters the upcoming trading week with constructive technical momentum, held up by positive MACD values and an RSI above 60. A sustained break above resistance at 1908.94 could signal further upside toward new highs, whereas failure to breach this boundary might prompt a consolidation back toward the middle Bollinger Band near 1768.75. Traders should monitor upcoming macroeconomic releases for potential volatility triggers.

Disclaimer: The analysis provided for Platinum is for informational purposes only and does not constitute investment advice. Traders are encouraged to perform their own analysis and research before making any trading decisions. Market conditions can change quickly, so staying informed with the latest data is essential.
Platinum D1 technical analysis chart
Platinum D1 Technical Analysis for 08.29.2026

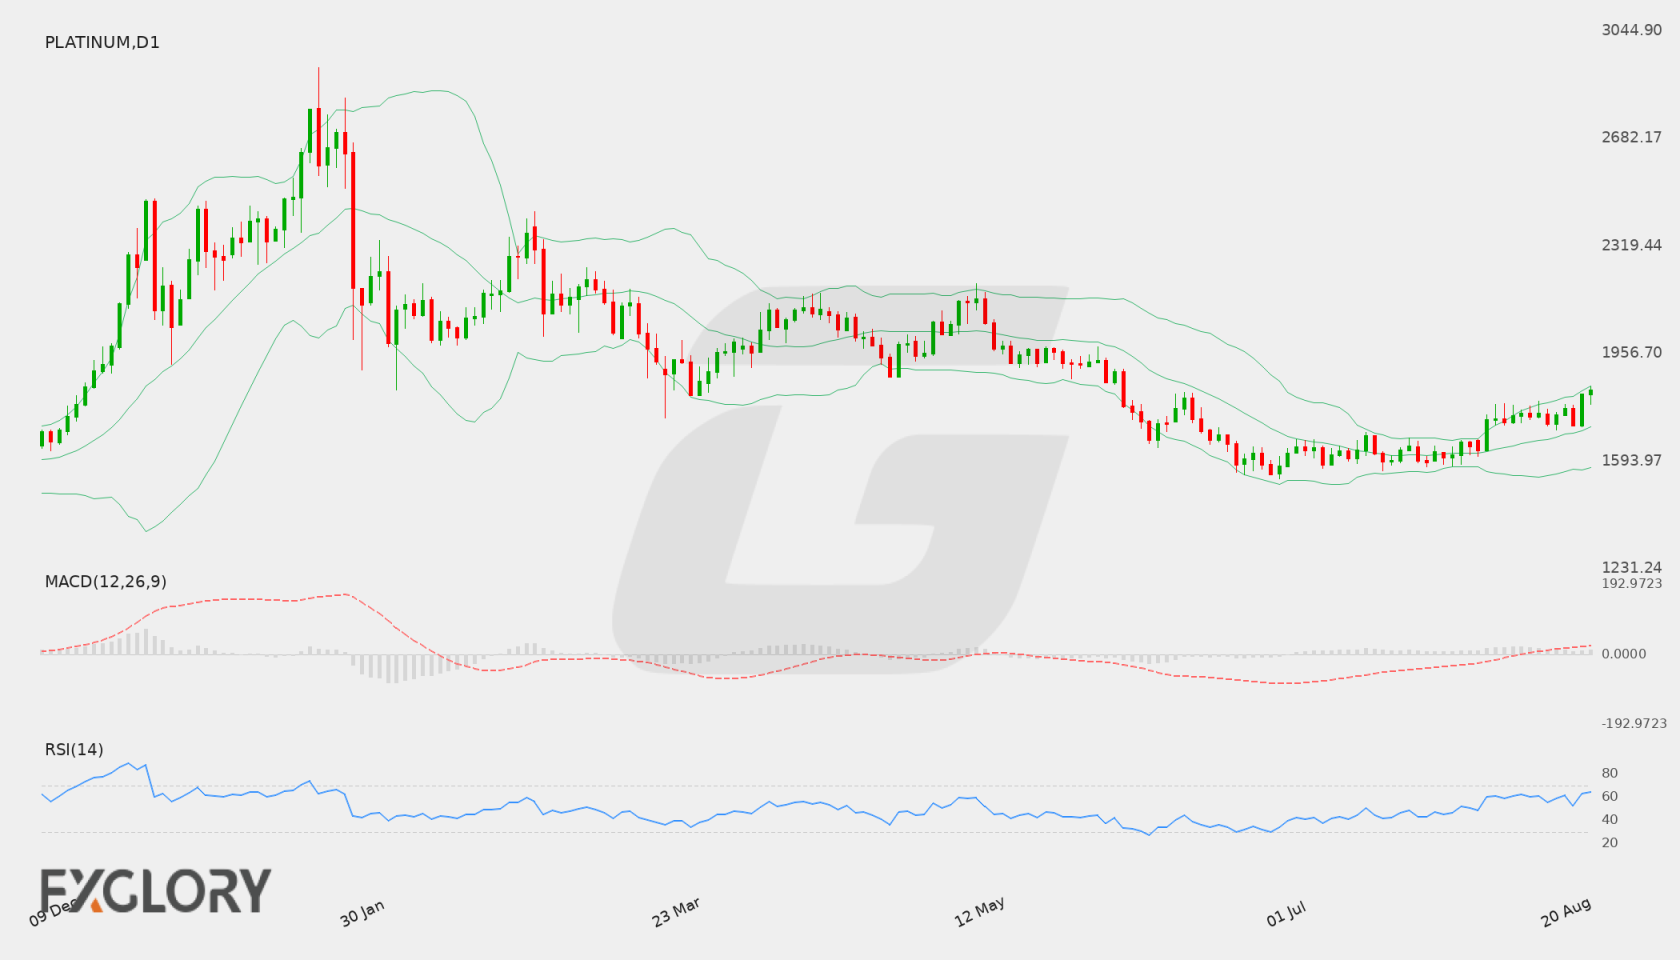
Platinum Forecast — 22 August 2026

Time Zone: GMT +3

Time Frame: Daily (D1) / Weekly Outlook

Weekly Fundamental Overview:

Platinum (Platinum) has demonstrated strong upward momentum, recently settling near the 1833.79 mark. Market participants continue to evaluate broader macroeconomic developments, inflation trends, and growth metrics to gauge risk appetite and sentiment across precious metals markets.

Price Action:

On the daily (D1) chart, Platinum has maintained a steady bullish trajectory, recovering from earlier baseline levels to close at 1833.79. The recent series of higher closes reflects persistent buying interest and positive short-term momentum.

Key Technical Indicators:

Bollinger Bands: The daily Bollinger Bands show the middle band located at 1708.62, with the lower band at 1570.74 and the upper band at 1846.51. Trading near 1833.79 places Platinum close to its upper band, signaling sustained upside pressure while staying within current volatility parameters.

RSI: The 14-day Relative Strength Index (RSI) stands at 64.36, reflecting positive bullish strength while remaining below overbought conditions.

MACD: The MACD indicator is currently reading 36.02, remaining in positive territory above the zero baseline to reflect active upside momentum on the daily timeframe.

Support and Resistance:

Key technical levels identify primary resistance at 1980.09, which limits potential upside extension. On the downside, fundamental support is anchored at 1532.81, with the 1708.62 middle Bollinger Band providing interim reference.

News to Watch for Platinum This Week:

  • CB Consumer Confidence: Shifts in consumer sentiment can impact overall market risk appetite.
  • Core PCE Price Index m/m: Key inflation measurements can influence central bank interest rate expectations.
  • Prelim GDP q/q: Growth data provides fundamental direction for broader economic sentiment.
  • Prelim GDP Price Index q/q: Price index trends provide crucial context on underlying inflationary pressures.
  • Unemployment Claims: Labor market indicators offer insights into overall economic momentum.
  • Prelim Benchmark Payrolls Revision: Adjustments to employment data can shift expectations surrounding broader monetary policy.

Weekly Outlook and Consideration:

Platinum (Platinum) enters the upcoming trading period with a constructive technical structure following its close at 1833.79. With an RSI of 64.36 and a positive MACD value of 36.02, momentum favors buyers, although proximity to the 1846.51 upper Bollinger Band suggests potential for near-term consolidation. A push higher would bring major resistance at 1980.09 into view, whereas shifts in broader market sentiment could highlight lower boundaries down toward 1532.81 support. Traders should observe incoming macroeconomic releases for further directional cues.

Disclaimer: The analysis provided for Platinum is for informational purposes only and does not constitute investment advice. Traders are encouraged to perform their own analysis and research before making any trading decisions. Market conditions can change quickly, so staying informed with the latest data is essential.
Platinum D1 technical analysis chart
Platinum D1 Technical Analysis for 08.22.2026

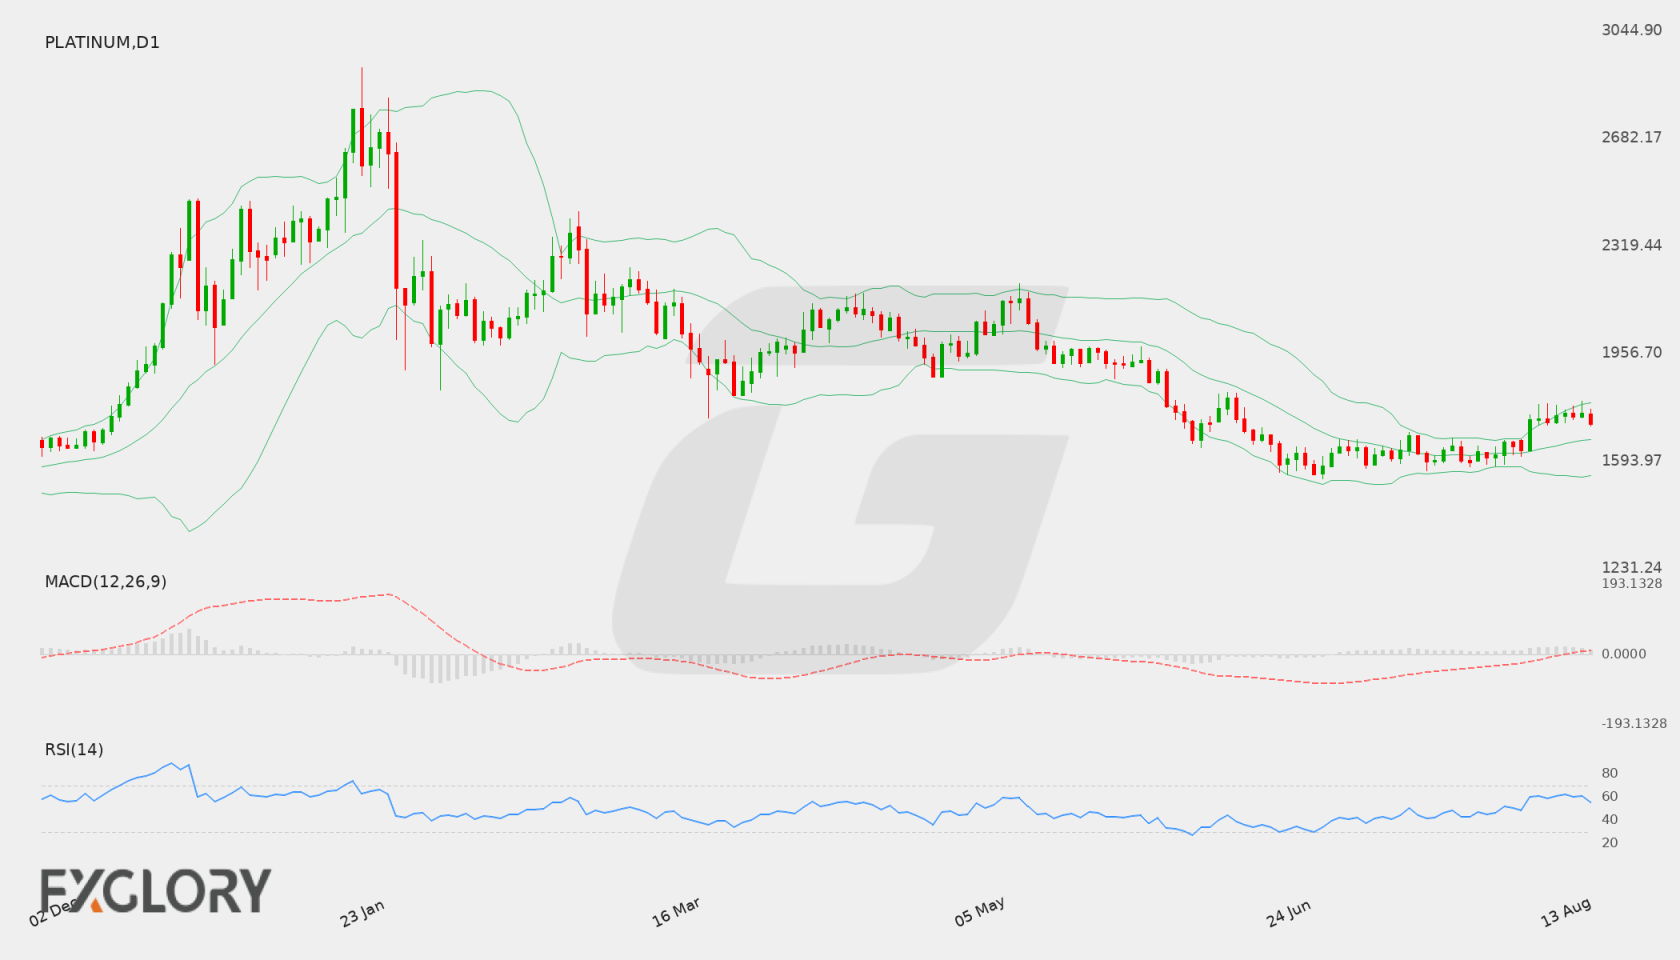
Platinum Forecast — 15 August 2026

Time Zone: GMT +3

Time Frame: Daily (D1) / Weekly Outlook

Weekly Fundamental Overview:

As an industrial and precious metal, Platinum (Platinum) remains sensitive to shifts in global macroeconomic sentiment, interest rate expectations, and broader economic conditions. Market participants will pay close attention to incoming economic data to gauge underlying industrial demand momentum and monetary policy trends, both of which can impact liquidity and price direction.

Price Action:

On the Daily (D1) chart, Platinum closed at 1720.71 after recently bouncing off lower ranges and testing region highs near 1755.02 before pulling back slightly. Price action demonstrates an active recovery structure from earlier lows, though recent candles reflect short-term consolidation as buyers and sellers battle around current levels.

Key Technical Indicators:

Bollinger Bands: The Daily Bollinger Bands feature a middle line at 1667.09, an upper band at 1790.78, and a lower band at 1543.41. Platinum is currently trading in the upper half of the band structure at 1720.71, indicating prevailing bullish characteristics while remaining below upper band territory.

RSI: The 14-period Relative Strength Index (RSI) is currently at 55.27. This reading places Platinum in neutral territory with a modest bullish bias, signaling that the asset is neither overbought nor oversold and has room to maneuver in either direction.

MACD: The MACD indicator registers at 23.62, positioned above its signal line in positive territory. This configuration indicates positive momentum on the D1 chart following the recent upward shift, though momentum strength will require sustained buying interest to extend higher.

Support and Resistance:

Key technical levels for Platinum are identified with primary support at 1532.81 and overhead resistance at 1980.09. Additional dynamic reference points include the Bollinger middle band at 1667.09 and the upper band at 1790.78.

News to Watch for Platinum This Week:

  • Prelim Benchmark Payrolls Revision: Revisions to historical labor data may influence broader economic expectations and monetary policy outlooks.
  • FOMC Meeting Minutes: Insights from central bank discussions could alter interest rate expectations and financial market conditions.
  • Unemployment Claims: Weekly jobless numbers offer a gauge of labor market strength and economic health.
  • Philly Fed Manufacturing Index: Manufacturing activity metrics provide clues regarding regional industrial demand and economic performance.
  • Flash Manufacturing PMI: Preliminary survey results reflect current operational conditions across the manufacturing sector.

Weekly Outlook and Consideration:

The weekly technical outlook for Platinum (Platinum) points to a neutral-to-bullish posture as long as price holds above the middle Bollinger Band at 1667.09. A continuation of recent upward momentum could see buyers test the upper Bollinger Band near 1790.78, with key resistance standing higher at 1980.09. Conversely, if selling pressure increases, a break below 1667.09 might shift focus back toward lower support near 1532.81.

Disclaimer: The analysis provided for Platinum is for informational purposes only and does not constitute investment advice. Traders are encouraged to perform their own analysis and research before making any trading decisions. Market conditions can change quickly, so staying informed with the latest data is essential.
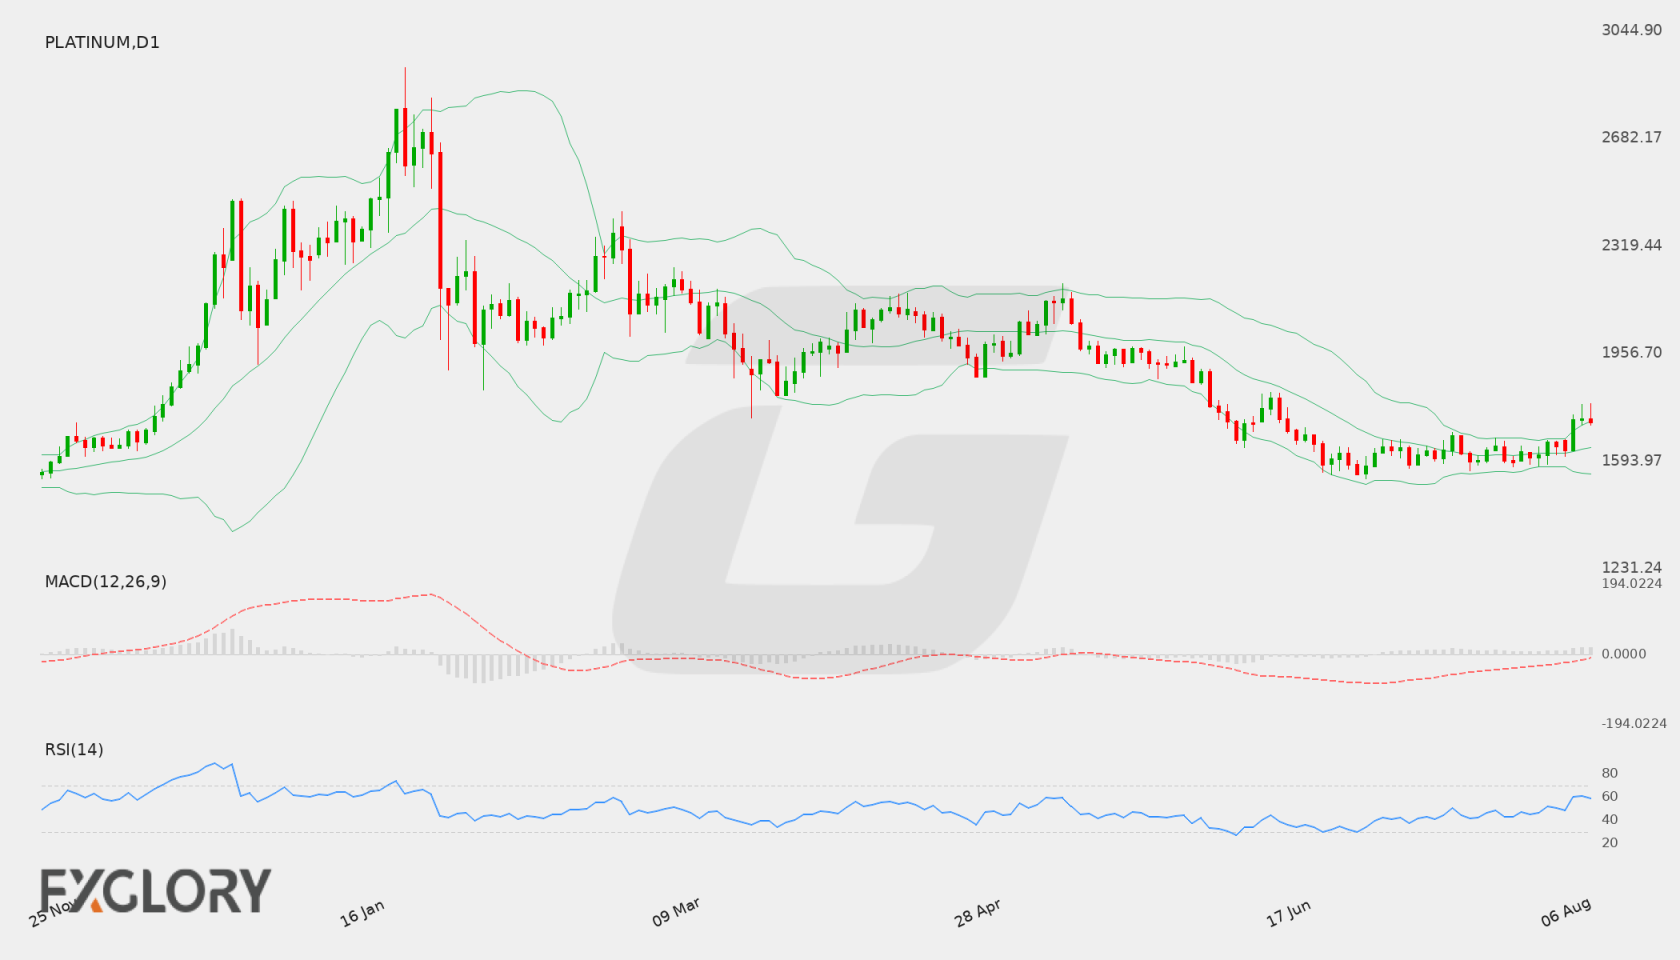
Platinum D1 technical analysis chart
Platinum D1 Technical Analysis for 08.15.2026

Platinum Forecast — 9 August 2026

Time Zone: GMT +3

Time Frame: Daily (D1) / Weekly Outlook

Weekly Fundamental Overview:

Platinum (Platinum) performance is driven by shifts in market sentiment and broader macroeconomic indicators. Trading around the 1723.98 level, the metal reflects underlying adjustments in physical commodity demand and general risk conditions across global markets.

Price Action:

On the daily (D1) chart, Platinum recently advanced from a low near 1631.51 up past 1730 before settling at 1723.98. This recent sequence of higher daily closes demonstrates a firming price structure over recent sessions.

Key Technical Indicators:

Bollinger Bands: Platinum is currently positioned near the upper Bollinger Band of 1728.58, holding well above the middle band baseline at 1639.15. The lower band sits at 1549.72, signaling elevated short-term volatility toward the higher end of the range.

RSI: The 14-day RSI is currently sitting at 58.51, indicating bullish momentum that remains within neutral to moderate bounds without reaching overbought levels.

MACD: The MACD indicator is currently positive at 8.24, indicating constructive upward momentum on the daily timeframe.

Support and Resistance:

Key technical levels for Platinum show established daily support at 1532.81 and daily overhead resistance at 2070.04.

News to Watch for Platinum This Week:

  • Core Retail Sales m/m: Changes in consumer spending patterns can influence market sentiment and industrial commodity demand.
  • Retail Sales m/m: Shifts in general retail activity provide insight into overall economic momentum affecting precious metals.

Weekly Outlook and Consideration:

Platinum (Platinum) enters the week in a bullish posture, with price action holding near 1723.98 close to the upper Bollinger Band of 1728.58. Supported by a positive MACD of 8.24 and an RSI of 58.51, the broader technical setup favors continued stability above the 1639.15 middle band. While key resistance lies further at 2070.04 and support at 1532.81, incoming macroeconomic data on retail sales will likely determine whether upside momentum can be sustained.

Disclaimer: The analysis provided for Platinum is for informational purposes only and does not constitute investment advice. Traders are encouraged to perform their own analysis and research before making any trading decisions. Market conditions can change quickly, so staying informed with the latest data is essential.

Platinum D1 technical analysis chart
Platinum D1 Technical Analysis for 08.09.2026
1Platinum = –––USD –––%
Platinum
Loading chart...