Time Zone: GMT +3
Time Frame: Daily (D1) / Weekly Outlook
Weekly Fundamental Overview:
Palladium dynamics are closely linked to macroeconomic expectations, industrial demand forecasts, and broader risk sentiment. Market participants will be closely monitoring key economic data releases, including inflation gauges and labor market indicators, which could influence monetary policy expectations and impact industrial commodities like Palladium.
Price Action:
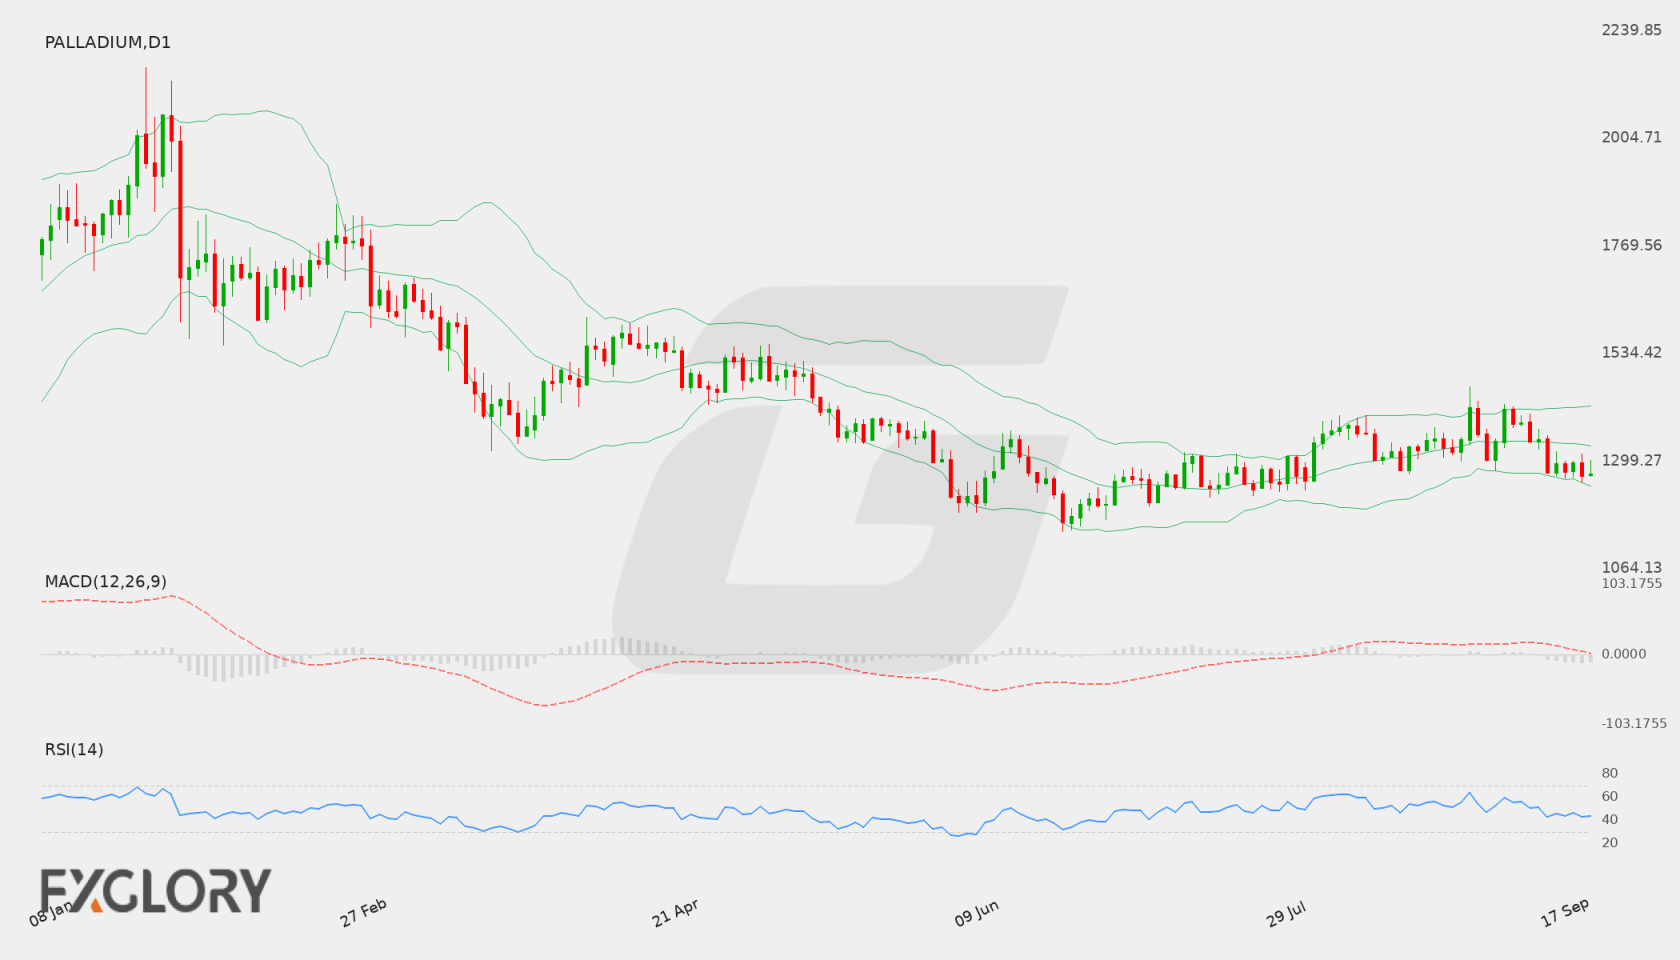
On the daily (D1) chart, Palladium (Palladium) recorded a last close of 1270.23. Recent price action shows the market consolidating within a range, having pulled back from brief spikes while maintaining a floor above key support at 1156.31 and remaining well below the overhead resistance at 1460.73.
Key Technical Indicators:
Bollinger Bands: The Bollinger Bands indicator on the daily time frame displays a middle band at 1332.09, an upper band at 1419.90, and a lower band at 1244.29. Palladium is currently trading in the lower half of the band structure, below the middle band, suggesting moderate bearish inclination.
RSI: The 14-day Relative Strength Index (RSI) is registered at 43.46. Operating below the neutral 50 threshold, the indicator reflects a mild bearish bias while staying above the oversold region.
MACD: The MACD indicator stands at -11.08, remaining in negative territory below the signal line. This configuration reflects persistent downward momentum in the daily timeframe, pointing to weak buying pressure.
Support and Resistance:
Technical chart analysis for Palladium highlights key support at 1156.31, bolstered closer by the lower Bollinger Band near 1244.29. On the resistance side, major overhead resistance is situated at 1460.73, with interim technical resistance located near the middle Bollinger Band at 1332.09.
News to Watch for Palladium This Week:
- CB Consumer Confidence: Assesses overall consumer confidence which can affect economic growth sentiment and commodity demand.
- JOLTS Job Openings: Reflects labor market demand and economic momentum.
- ADP Non-Farm Employment Change: Serves as an early estimate of private sector employment strength.
- Core PCE Price Index m/m: Functions as a vital inflation signal that can sway interest rate outlooks.
- Final GDP q/q: Provides a comprehensive picture of economic growth and risk sentiment.
- ISM Manufacturing PMI: Offers key insights into industrial activity that directly impacts physical metal usage.
- Average Hourly Earnings m/m: Indicates wage growth trends and underlying inflationary pressures.
- Non-Farm Employment Change: Acts as a primary benchmark for labor market expansion and macroeconomic health.
- Unemployment Rate: Evaluates broader labor conditions that influence monetary policy expectations.
Weekly Outlook and Consideration:
The weekly outlook for Palladium (Palladium) suggests a cautious tone with a slight downside tilt following a close at 1270.23. With the RSI at 43.46 and MACD at -11.08, bears hold a slight technical advantage. Should price action break below near-term lower band support around 1244.29, a move toward the key support level at 1156.31 may develop. Conversely, if buyers regain momentum and reclaim the middle Bollinger Band at 1332.09, Palladium could attempt a recovery toward resistance at 1460.73. Traders should watch incoming macroeconomic catalysts for directional clarity.
Disclaimer: The analysis provided for Palladium is for informational purposes only and does not constitute investment advice. Traders are encouraged to perform their own analysis and research before making any trading decisions. Market conditions can change quickly, so staying informed with the latest data is essential.