Time Zone: GMT +3
Time Frame: Daily (D1) / Weekly Outlook
Weekly Fundamental Overview:
Palladium (Palladium) continues to be influenced by broader macroeconomic trends, shifting interest rate expectations, and demand across industrial sectors. Upcoming economic releases from the United States, including producer and consumer price indices along with consumer sentiment data, may shape market expectations regarding monetary policy and influence price dynamics across precious metals markets.
Price Action:
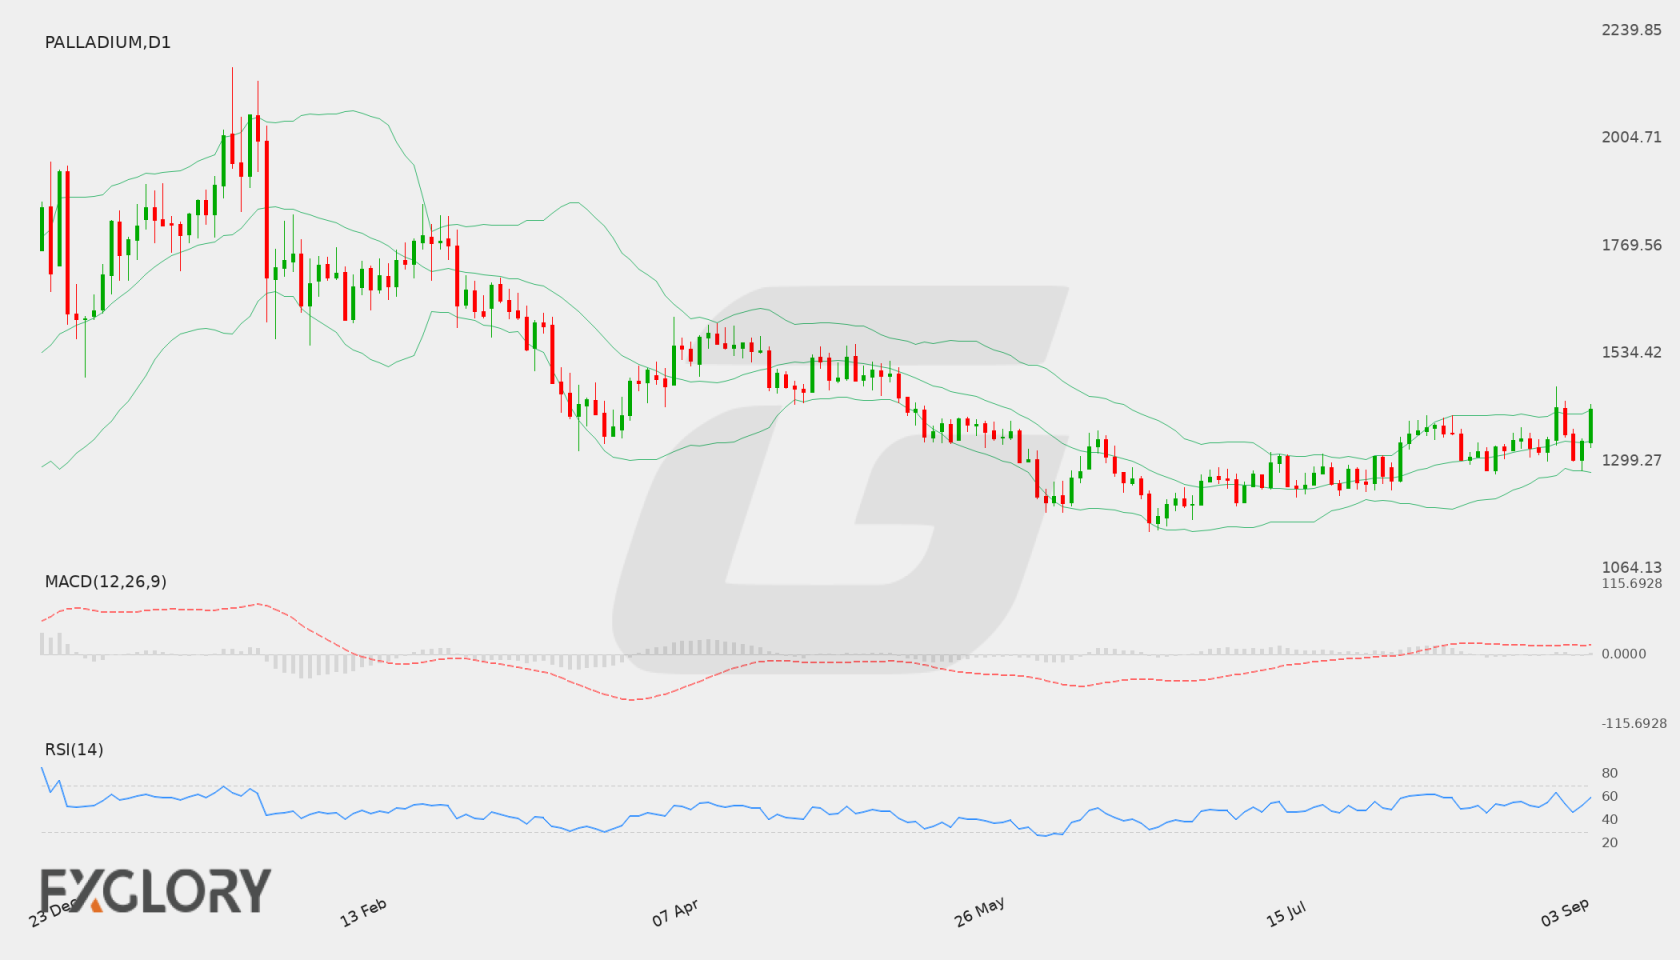
On the daily D1 chart, Palladium recently advanced to close at 1412.83, recovering from a recent low of 1301.22 earlier in the period. The price action demonstrates a recent bullish drive that brings the asset closer to testing the established technical resistance zone.
Key Technical Indicators:
Bollinger Bands: The daily Bollinger Bands reveal a middle band at 1342.03, an upper band at 1410.63, and a lower band at 1273.43. With the current close at 1412.83, Palladium is trading slightly above the upper band, indicating strong recent upward momentum relative to its moving average.
RSI: The 14-day Relative Strength Index (RSI) stands at 59.34, placing the asset in moderate bullish territory while remaining below the overbought threshold of 70.
MACD: The MACD indicator for Palladium sits at 17.68, remaining in positive territory above the zero baseline. This positive value reflects upward momentum on the daily timeframe, supporting recent buying interest.
Support and Resistance:
Key technical levels for Palladium include primary resistance at 1460.73 and primary support at 1145.21, which define the broader trading range on the daily chart.
News to Watch for Palladium This Week:
- PPI m/m: This release measures producer price changes and can impact inflation expectations surrounding precious metals.
- Core PPI m/m: Excluded volatile categories provide a clearer view of underlying wholesale cost trends.
- Unemployment Claims: Weekly jobless claims offer insights into labor market conditions and broader economic health.
- Core CPI m/m: Consumer inflation metrics influence monetary policy expectations and market sentiment.
- CPI y/y: The annual consumer inflation rate provides critical context for interest rate trajectories.
- Core CPI y/y: Year-over-year core figures help traders assess underlying inflation persistence.
- CPI m/m: Monthly inflation data highlights recent shifts in price pressures across the economy.
- Prelim UoM Inflation Expectations: Long-term consumer inflation surveys can impact store-of-value assets.
- Prelim UoM Consumer Sentiment: Sentiment metrics reflect consumer confidence and general economic outlooks.
Weekly Outlook and Consideration:
Palladium enters the week positioned at 1412.83, supported by an RSI reading of 59.34 and a positive MACD value of 17.68. The current price trades near the upper Bollinger Band of 1410.63, pointing to recent upward strength. Traders will monitor whether momentum can sustain a push toward resistance at 1460.73 or if price action will pull back toward the middle Bollinger Band at 1342.03 and deeper support at 1145.21, particularly as major U.S. economic data releases unfold.
Disclaimer: The analysis provided for Palladium is for informational purposes only and does not constitute investment advice. Traders are encouraged to perform their own analysis and research before making any trading decisions. Market conditions can change quickly, so staying informed with the latest data is essential.