Palladium Forecast — 29 September 2026
Time Zone: GMT +3
Time Frame: Daily (D1) / Weekly Outlook
Weekly Fundamental Overview:
Palladium (Palladium) continues to reflect shifting industrial sentiment and broader market trends. Key economic indicators, particularly from US manufacturing sectors, remain vital drivers for industrial metals, shaping broader market demand and risk outlooks.
Price Action:
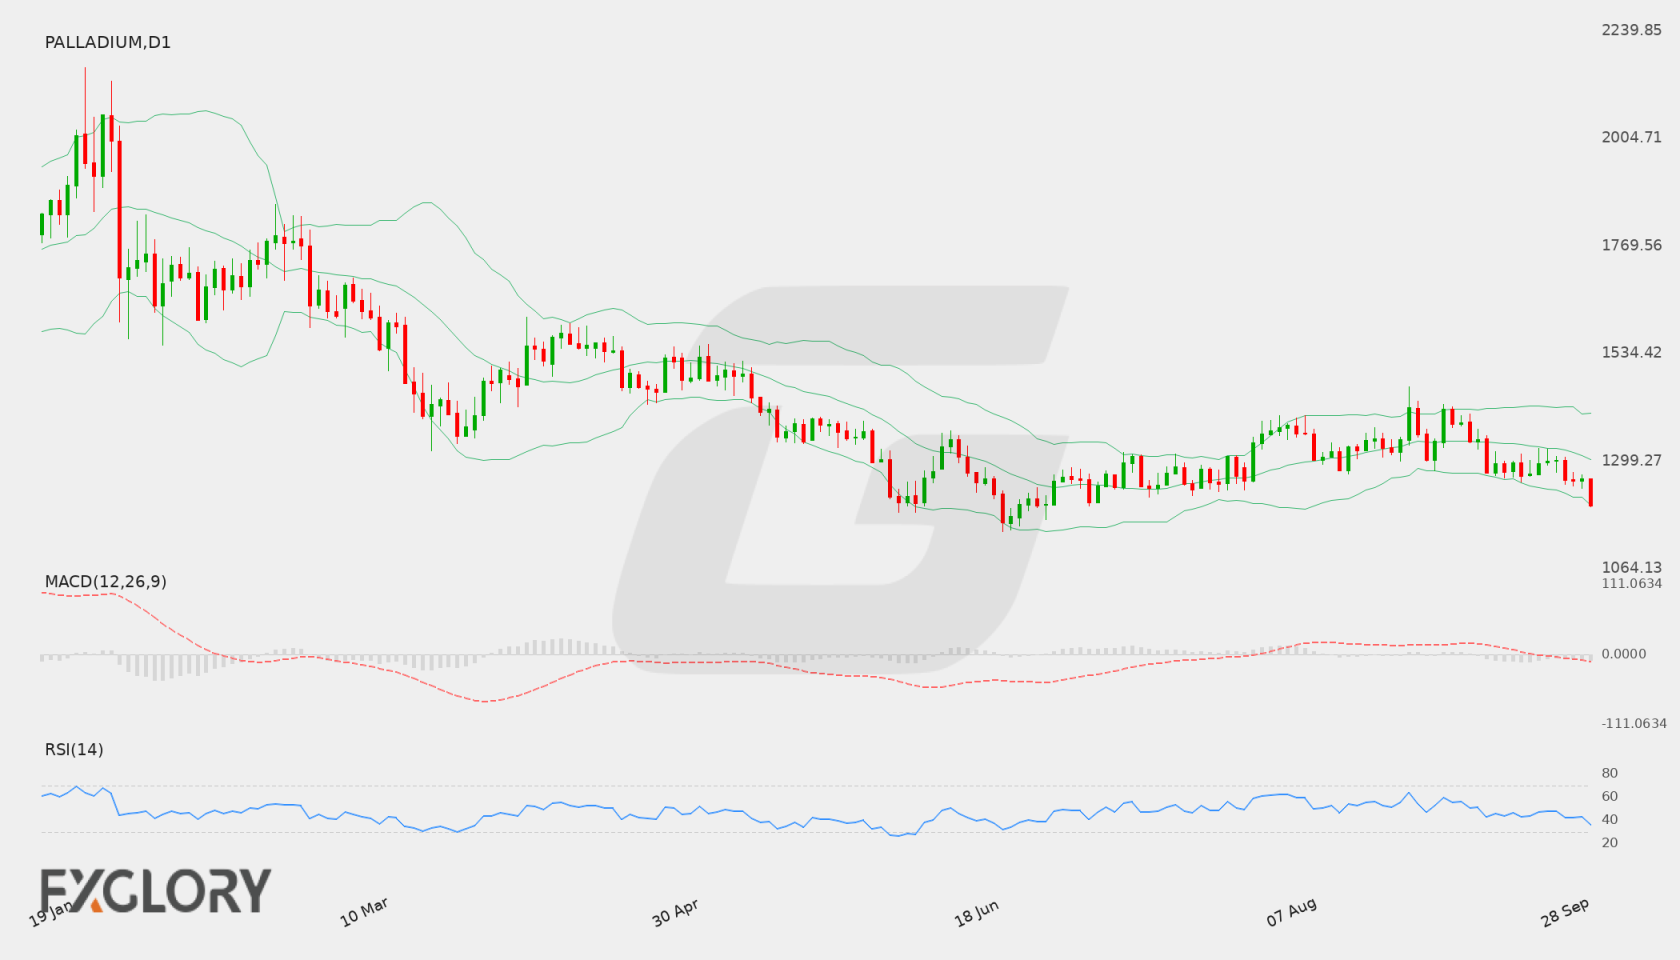
Palladium (Palladium) has shown sustained downward momentum across recent D1 sessions, declining from recent highs around 1383.28 to close at 1201.87. The asset recently posted a low near 1199.06, reflecting dominant seller control in the short term.
Key Technical Indicators:
Bollinger Bands: The Bollinger Bands on the daily timeframe show a middle line at 1302.89, an upper band at 1402.87, and a lower band at 1202.92. Palladium closed at 1201.87, hovering right around the lower band, which suggests strong downward pressure.
RSI: The 14-day RSI is currently reading 35.59, remaining in lower territory above oversold levels and pointing to ongoing bearish sentiment without immediate signs of trend reversal.
MACD: The MACD indicator on the daily chart sits at -22.00, reflecting persistent negative momentum for Palladium (Palladium).
Support and Resistance:
Key technical support for Palladium (Palladium) is identified at 1199.06, while key resistance stands higher at 1460.73.
News to Watch for Palladium This Week:
- ISM Manufacturing PMI: Reflects overall activity within the US manufacturing sector, which can influence broader market risk sentiment and commodity demand.
- ISM Manufacturing Prices: Tracks changes in input prices for manufacturers, offering insight into inflationary trends that impact market expectations.
Weekly Outlook and Consideration:
Palladium (Palladium) heads into the new week testing immediate support at 1199.06 following its close at 1201.87. Indicators remain tilted to the downside, with MACD at -22.00 and RSI at 35.59. A solid rebound from support could trigger a corrective move toward the daily middle Bollinger band at 1302.89, whereas a break below support may open the door for extended losses. Major resistance remains well above at 1460.73.
Disclaimer: The analysis provided for Palladium is for informational purposes only and does not constitute investment advice. Traders are encouraged to perform their own analysis and research before making any trading decisions. Market conditions can change quickly, so staying informed with the latest data is essential.