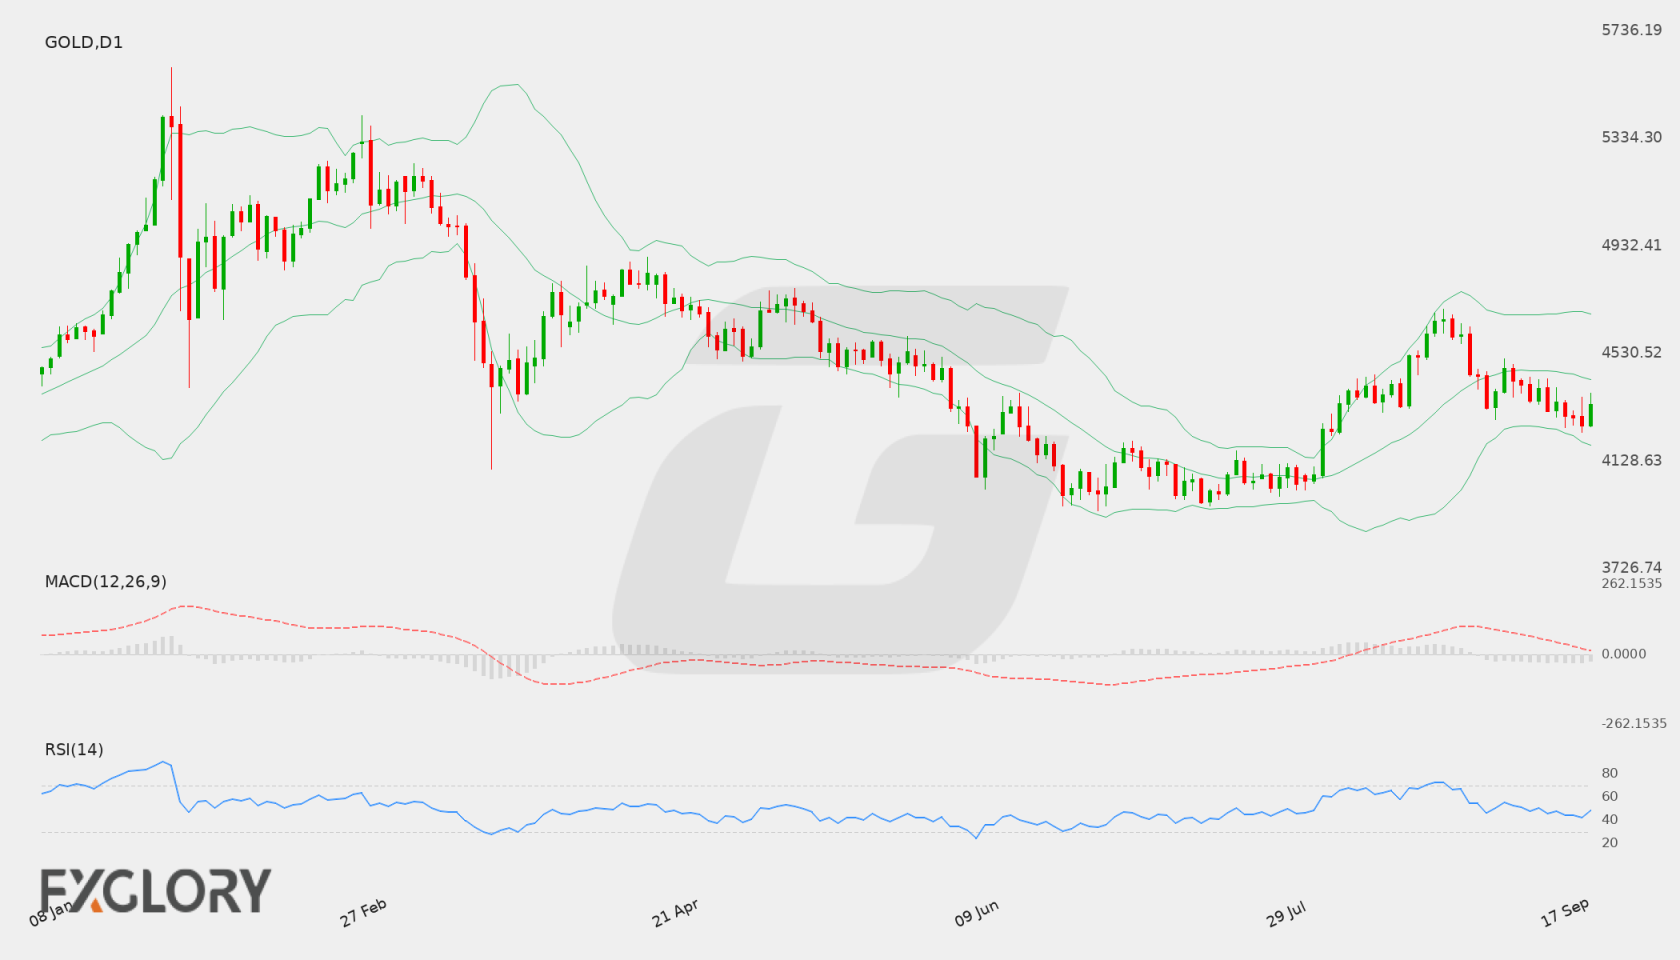
Current weekly forecast: This outlook covers 21–24 October 2026 and remains valid until 24 October 2026, unless its stated invalidation condition is triggered earlier.
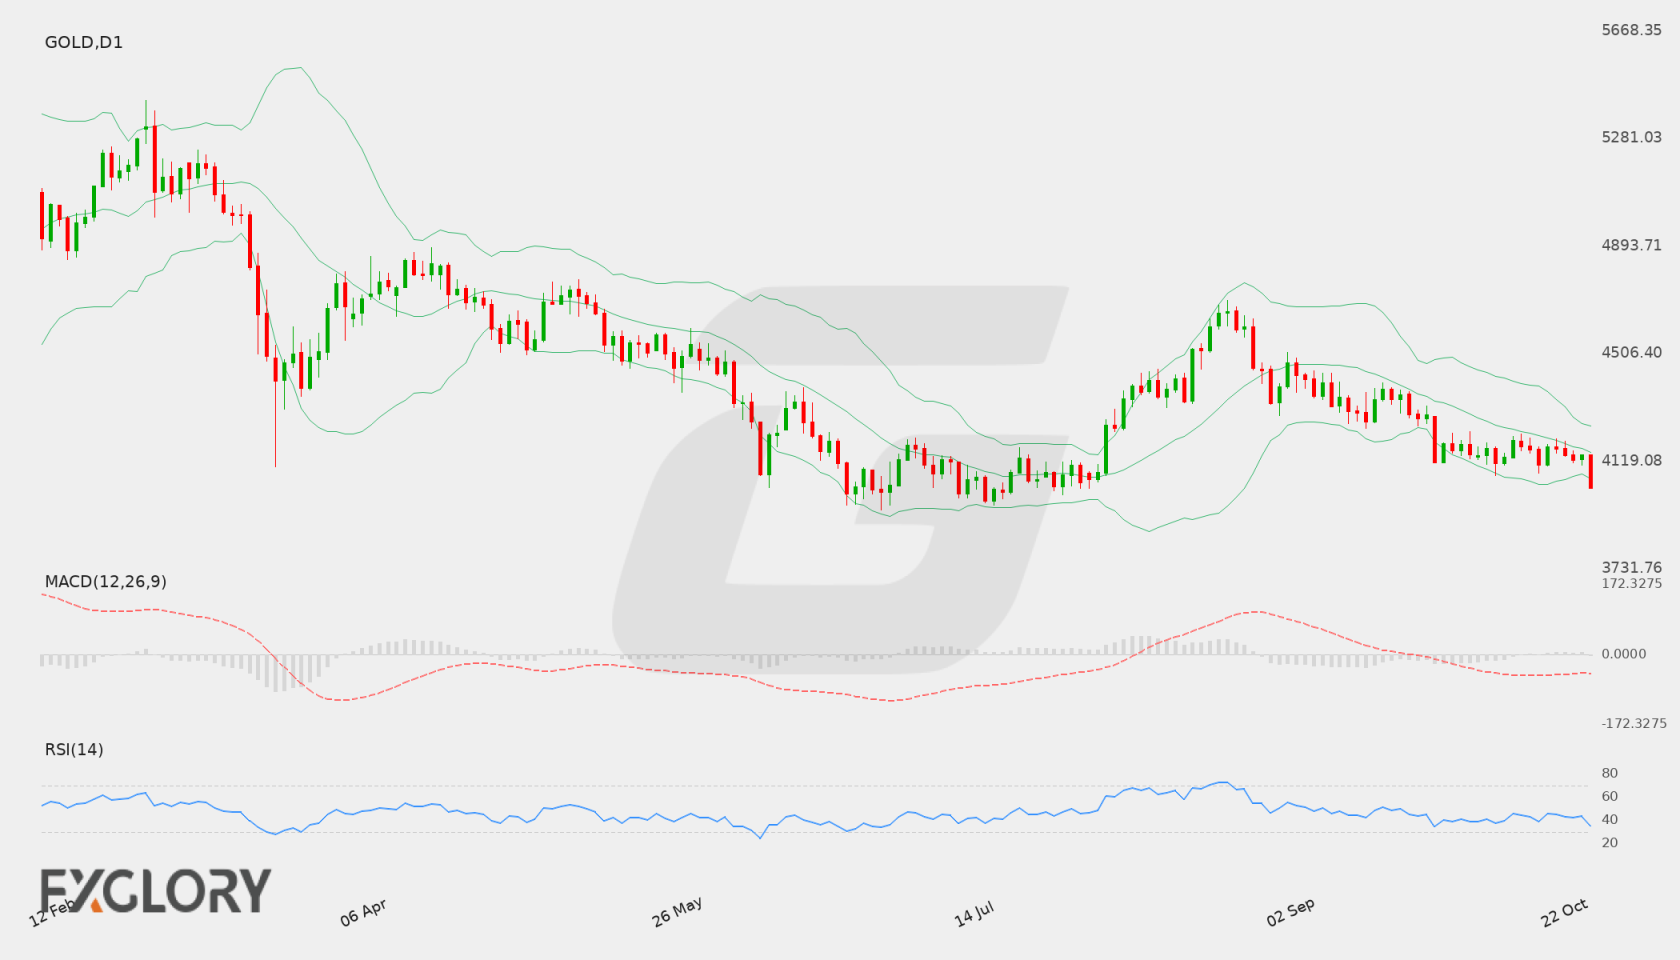
Daily check — 23 October 2026: The latest completed D1 close was 4024.17000 on 22 October 2026. It remains below the upper formal invalidation level 4252.28039; the lower calibrated boundary 3988.19327 is an extension/confirmation boundary. The authored weekly thesis remains valid.
In brief
The weekly bias is bearish as D1 structure and falling averages remain weak, although mixed D1 momentum and close behavior argue against assuming immediate downside continuation.
Gold closed at 4124.69, below D1 support-resistance context at 4165.86 and below its EMA20, EMA50, SMA200 and Bollinger middle. The bearish trend and falling EMA50 and SMA200 slopes reinforce the downside structure, but the mixed D1 close sequence makes the path less one-directional than the trend label alone suggests.
Momentum is mixed rather than fully aligned: D1 RSI is below 50 and MACD remains negative, yet D1 MACD is above its signal and its histogram is positive. H4 is more consistently weak, with negative MACD and histogram and price below its moving averages; this supports tactical downside pressure, while stable volatility offers no directional signal by itself.
GOLD D1 technical-analysis context for the weekly forecast. Chart data captured 23 October 2026.
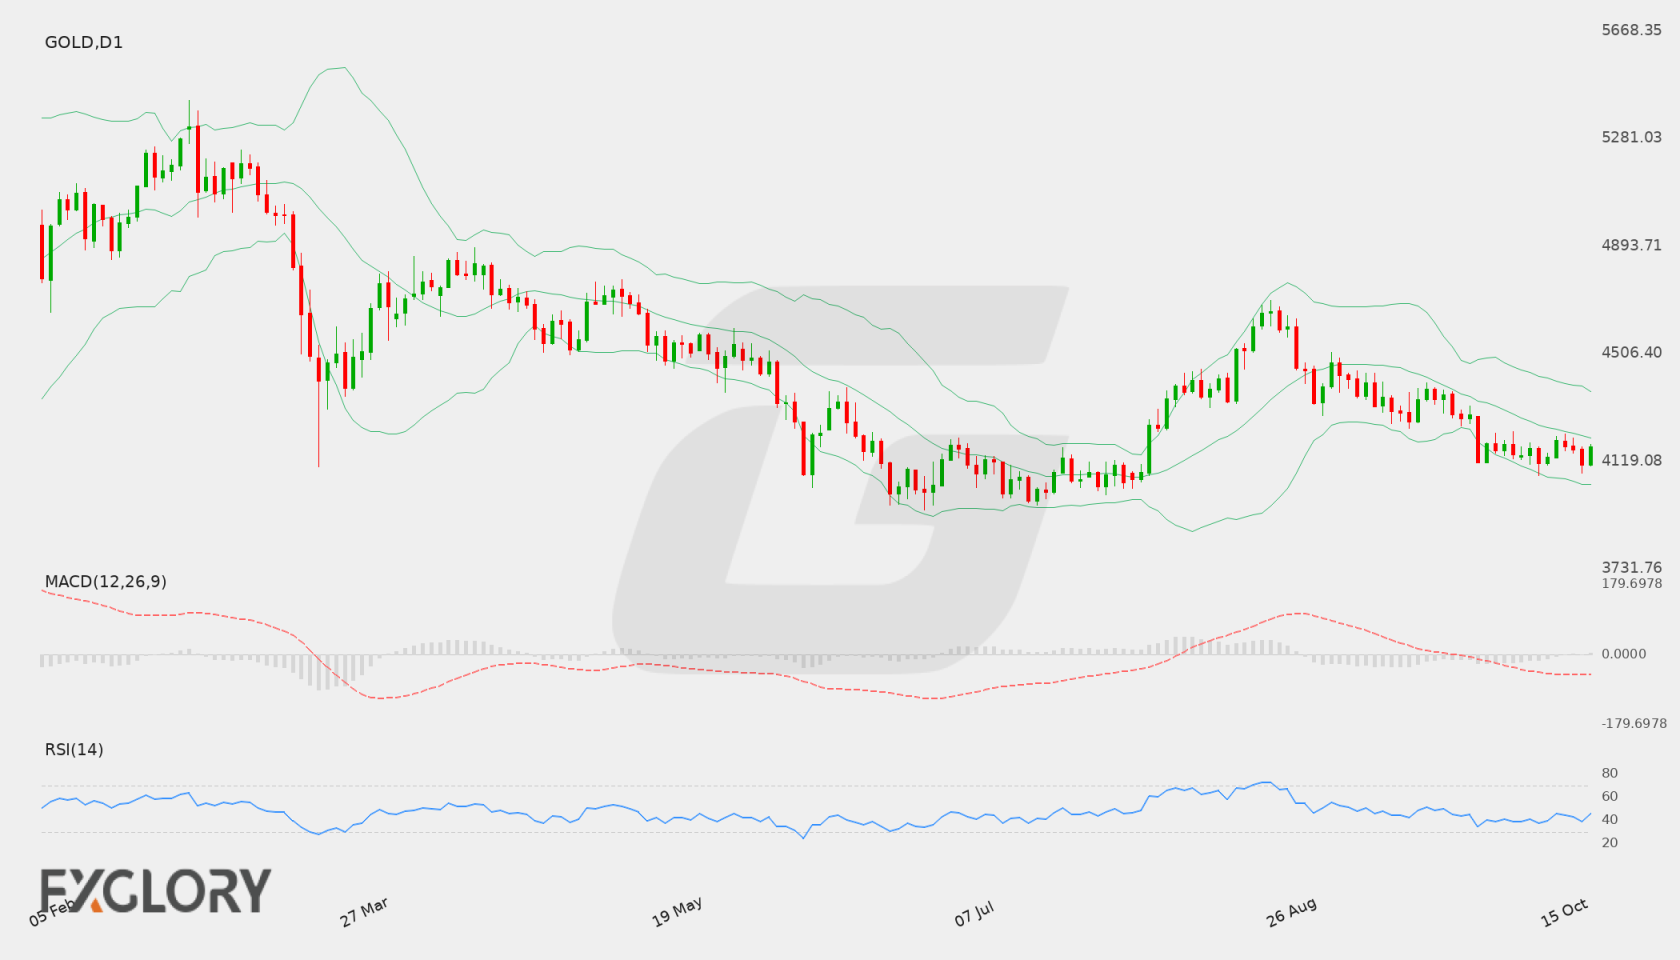
Gold has a bearish weekly bias, although bullish H4 momentum and mixed D1 evidence leave room for consolidation before any directional extension.
The weekly thesis remains bearish because D1 trend and both listed long-term moving-average slopes point lower, while MACD remains below its signal with a negative histogram. The reference close of 4193.8 is below the D1 EMA20 at 4222.44179 and the primary resistance at 4276.02563, keeping the broader structure pressured.
The counterweight is tactical: H4 is bullish, with positive MACD positioning, positive histogram structure and price above its EMA20 and EMA50. That conflict means a recovery toward 4276.02563 or higher resistance cannot be dismissed, but the weekly thesis would require stronger D1 evidence before treating such a move as a structural reversal.
GOLD D1 technical-analysis context for the weekly forecast. Chart data captured 16 October 2026.
Gold (GOLD) trading dynamics continue to be shaped by broader economic conditions, monetary policy expectations, and safe-haven flows. Market participants remain focused on incoming macroeconomic reports and central bank policy sentiment to assess future price direction.
Price Action:
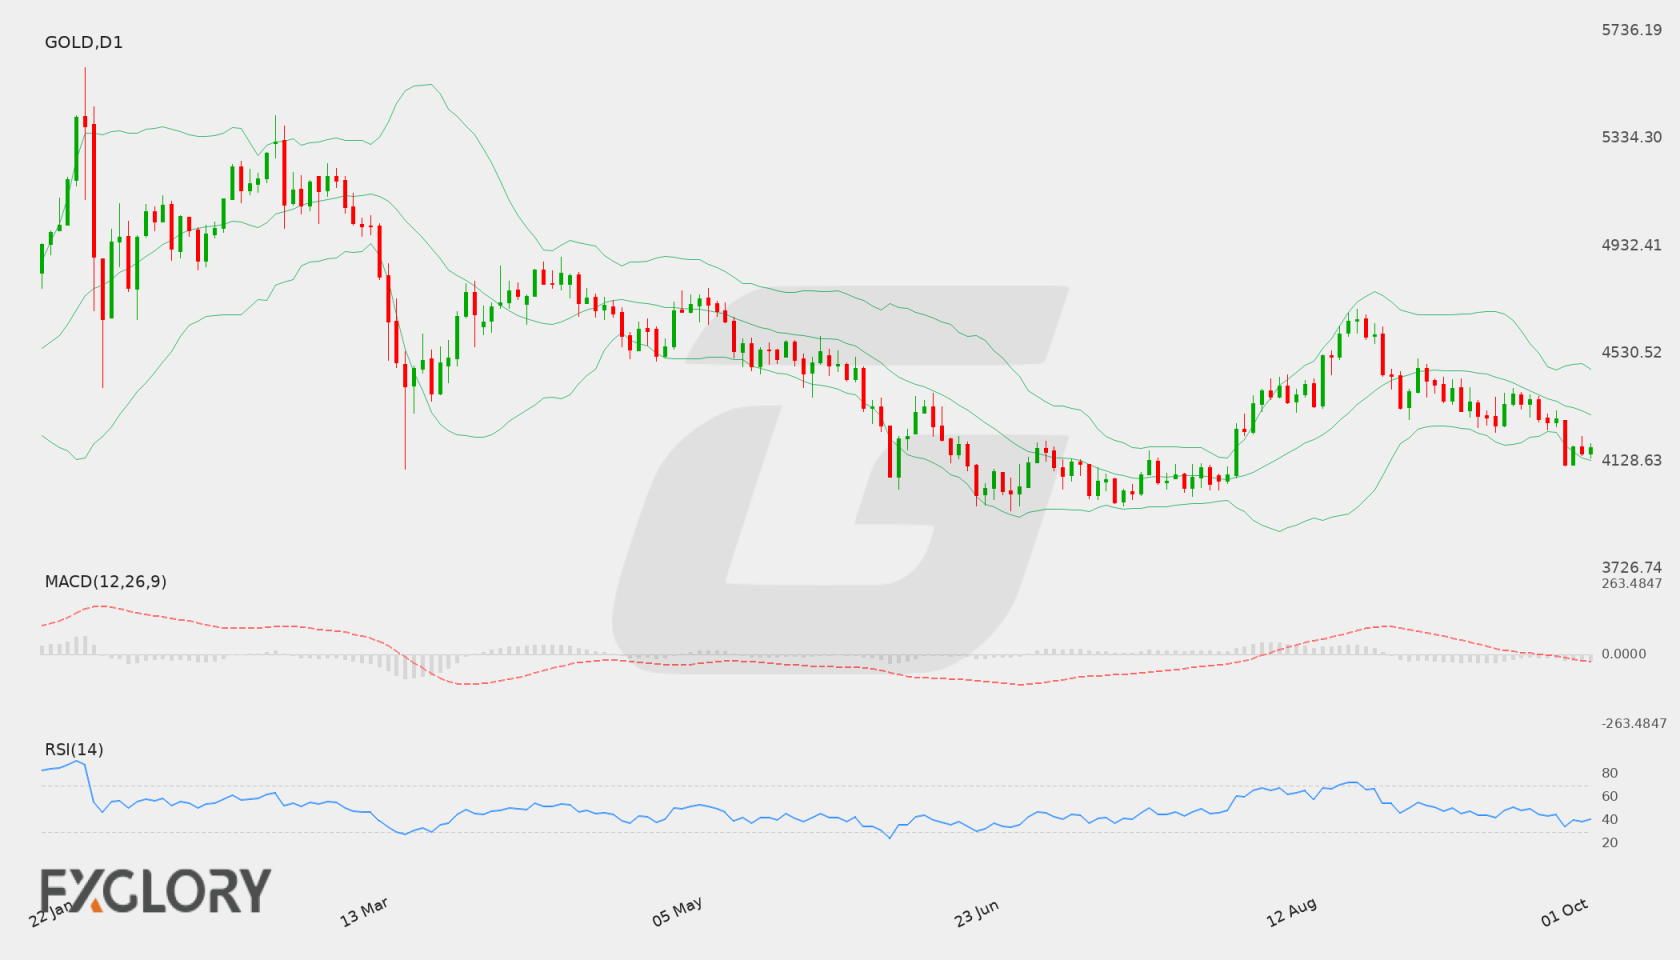
Gold (GOLD) recently rebounded from a daily low of 4110.73 to finish at a last close of 4177.45. The price action demonstrates short-term stabilization following an extended decline from higher levels recorded earlier in the chart series.
Key Technical Indicators:
Bollinger Bands: On the daily chart, the Bollinger Bands middle line sits at 4301.00, with the upper band at 4471.29 and the lower band at 4130.71. With Gold (GOLD) closing at 4177.45, price is trading in the lower half of the band structure just above the lower band boundary.
RSI: The 14-day Relative Strength Index (RSI) is positioned at 40.61, indicating a subdued momentum environment below the midpoint while staying outside of oversold territory.
MACD: The MACD indicator is currently recorded at -51.07, remaining below the zero threshold and reflecting lingering negative momentum across the daily timeframe.
Support and Resistance:
Key technical reference points for Gold (GOLD) include daily support at 3959.49 and daily resistance at 4696.65.
News to Watch for GOLD This Week:
ISM Services PMI: This release measures business conditions in the services sector and can drive volatility in Gold.
FOMC Meeting Minutes: Insights from monetary policymakers could influence interest rate outlooks and valuation for Gold.
Unemployment Claims: Weekly jobless figures provide insight into economic resilience and safe-haven flows for Gold.
Prelim UoM Inflation Expectations: Changing inflation views can shape sentiment around Gold demand.
Prelim UoM Consumer Sentiment: Household confidence metrics may alter market risk appetite and precious metal positioning.
Weekly Outlook and Consideration:
The weekly outlook for Gold (GOLD) remains guarded as the daily MACD at -51.07 and RSI at 40.61 signal ongoing downside pressure. Price closed at 4177.45, maintaining a position below the Bollinger middle band of 4301.00 yet holding above the lower band at 4130.71. If buyers maintain traction above the lower band, price could attempt a consolidation move toward the 4301.00 middle boundary. Conversely, prolonged weakness could lead to tests of deeper technical support at 3959.49. To shift the broader technical picture, price would need to regain substantial ground toward the primary resistance level of 4696.65. High-impact economic releases this week may provide further catalysts for price behavior.
Disclaimer: The analysis provided for Gold is for informational purposes only and does not constitute investment advice. Traders are encouraged to perform their own analysis and research before making any trading decisions. Market conditions can change quickly, so staying informed with the latest data is essential.
Broader macroeconomic conditions and market sentiment continue to influence Gold (GOLD). Shifting economic forecasts and inflation expectations may impact investor appetite for precious metals in the coming trading sessions.
Price Action:
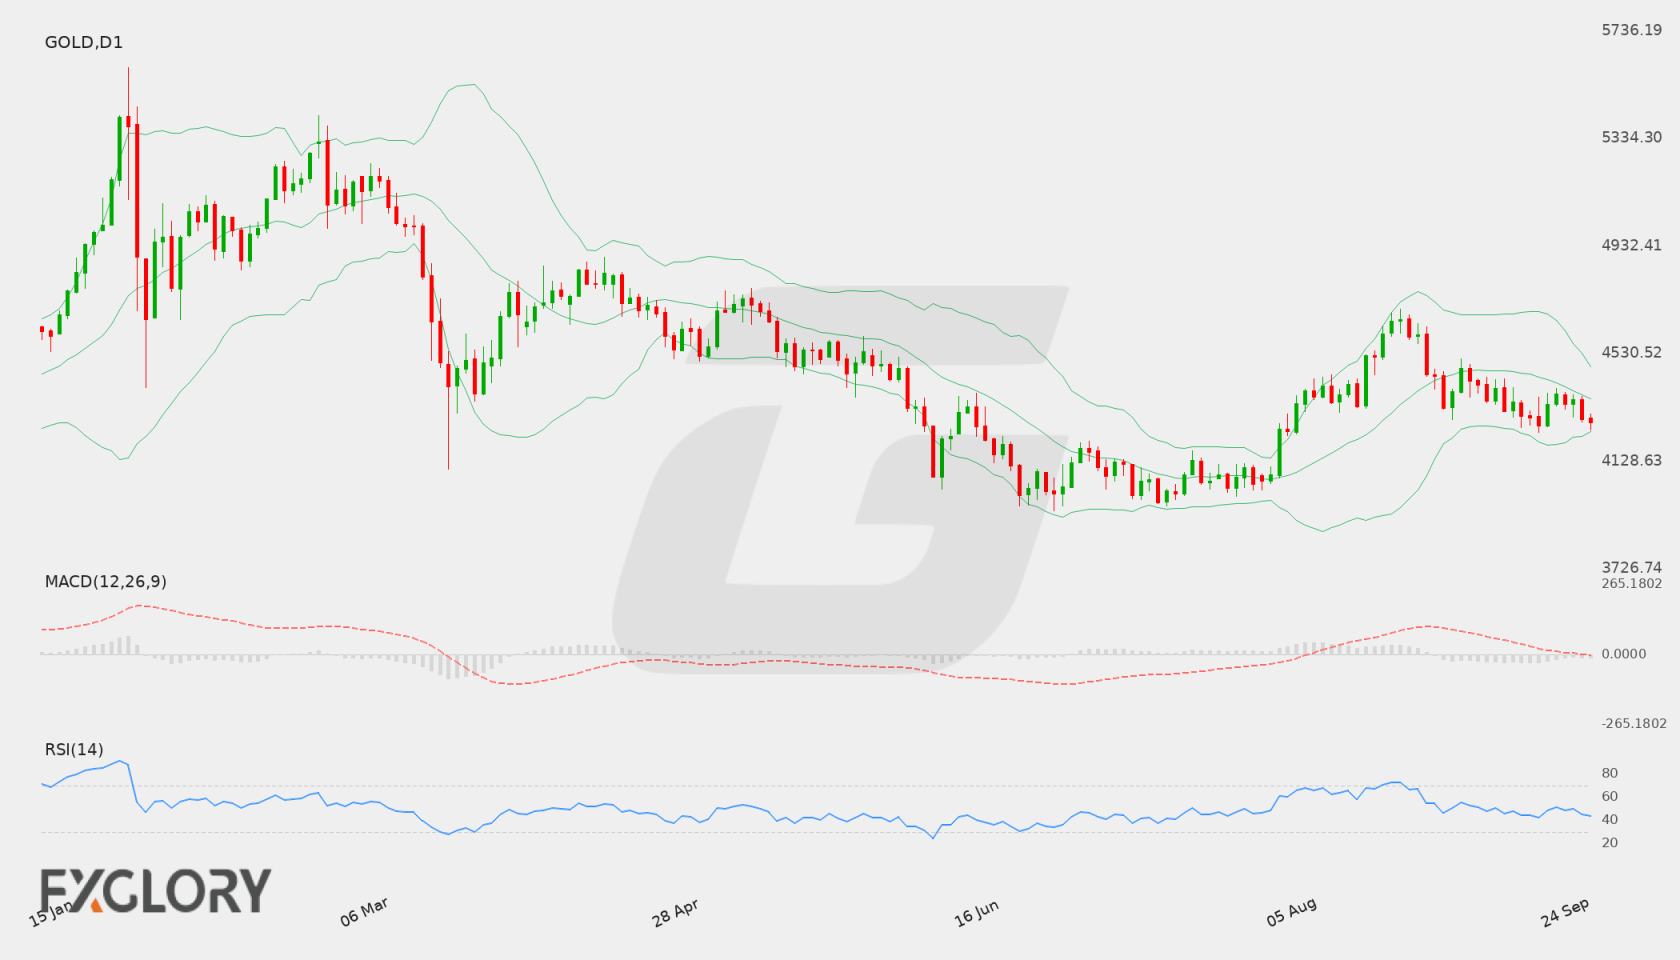
On the daily (D1) chart, Gold (GOLD) closed at 4274.89, following a gradual decline from recent highs near 4377.75. The recent daily candlesticks demonstrate persistent selling pressure as the asset trades closer to its lower boundary.
Key Technical Indicators:
Bollinger Bands: The D1 Bollinger Bands show the middle band at 4359.71, the upper band at 4481.26, and the lower band at 4238.17. Gold (GOLD) is trading below the middle band and approaching the lower band at its last close of 4274.89, reflecting downside momentum within the current volatility range.
RSI: The 14-day Relative Strength Index (RSI) stands at 43.71. Being below the 50 mark, this indicator signals moderate bearish sentiment without crossing into oversold conditions.
MACD: The D1 MACD indicator is currently reading -17.48. Remaining below zero, the negative value indicates ongoing bearish momentum across recent daily periods.
Support and Resistance:
Key technical levels on the daily chart show main support at 3959.49 and primary resistance at 4696.65. Price movement near these thresholds could determine the next significant trend direction.
News to Watch for GOLD This Week:
ISM Manufacturing PMI: This indicator assesses manufacturing sector health and may influence market sentiment regarding economic growth.
ISM Manufacturing Prices: This metric reflects cost pressures in manufacturing which can impact inflation outlooks and precious metal valuation.
Weekly Outlook and Consideration:
Gold (GOLD) approaches the new trading week under moderate bearish pressure, closing at 4274.89 below its daily Bollinger middle band of 4359.71. Technical indicators support a cautious outlook, with the RSI at 43.71 and MACD at -17.48. If downward momentum persists, price may move toward the primary support level at 3959.49. Alternatively, a move above the middle band could see price testing resistance toward 4696.65.
Disclaimer: The analysis provided for Gold is for informational purposes only and does not constitute investment advice. Traders are encouraged to perform their own analysis and research before making any trading decisions. Market conditions can change quickly, so staying informed with the latest data is essential.
Gold (GOLD) traders face a pivotal week dominated by significant economic indicators. Broader market interest rate expectations and economic sentiment remain primary drivers, as market participants closely monitor upcoming data releases for potential shifts in valuation.
Price Action:
Gold (GOLD) closed its recent daily trading session at 4341.16, moving higher from a daily low of 4257.39 and peaking at 4381.06. Price action shows a modest recovery after declining from prior highs above 4650, indicating a period of stabilization around the 4300 to 4340 level.
Key Technical Indicators:
Bollinger Bands: On the daily chart, the Bollinger Bands display a middle band at 4433.01, an upper band at 4677.70, and a lower band at 4188.31. Gold (GOLD) is trading below the middle band, reflecting persistent mild downward pressure within the channel.
RSI: The 14-day Relative Strength Index (RSI) stands at 48.39, holding in neutral territory and indicating a balance between buying and selling pressure without entering overbought or oversold zones.
MACD: The Daily MACD indicator for Gold (GOLD) is at -11.39, remaining beneath the zero threshold and indicating active bearish momentum despite the recent upward day.
Support and Resistance:
Primary technical levels for Gold (GOLD) feature major support at 3943.33 and major resistance at 4696.65. Dynamic levels are anchored by the lower Bollinger band at 4188.31 and the middle band at 4433.01.
News to Watch for GOLD This Week:
CB Consumer Confidence: Tracks consumer economic sentiment which can influence US Dollar strength and precious metals pricing.
JOLTS Job Openings: Measures labor market demand and shifts general market risk preference.
ADP Non-Farm Employment Change: Provides key private sector employment insights that sway market expectations ahead of official labor data.
Core PCE Price Index m/m: Serves as a vital inflation metric that impacts monetary policy expectations for non-yielding assets.
Final GDP q/q: Indicates overall economic growth and reflects broader economic stability.
ISM Manufacturing PMI: Assesses manufacturing sector activity to gauge macroeconomic strength.
Average Hourly Earnings m/m: Reflects wage inflation trends that influence future central bank interest rate decisions.
Non-Farm Employment Change: Details net employment shifts that drive substantial volatility across asset classes.
Unemployment Rate: Highlights overall labor market health and guides broad market sentiment.
Weekly Outlook and Consideration:
The weekly outlook for Gold (GOLD) remains neutral to cautious while price holds below the daily Bollinger middle band of 4433.01. With the MACD in negative territory at -11.39 and RSI balanced at 48.39, a sustained move above 4433.01 could open the path toward resistance at 4696.65. Conversely, renewed selling pressure could drive price back down toward the lower Bollinger band at 4188.31 and key support at 3943.33.
Disclaimer: The analysis provided for Gold is for informational purposes only and does not constitute investment advice. Traders are encouraged to perform their own analysis and research before making any trading decisions. Market conditions can change quickly, so staying informed with the latest data is essential.