Current weekly forecast: This outlook covers 11–17 October 2026 and remains valid until 17 October 2026, unless its stated invalidation condition is triggered earlier.
In brief
USD/ZAR has a bullish weekly bias, supported by D1 momentum, although bearish H4 conditions and mixed D1 closes keep continuation conditional.
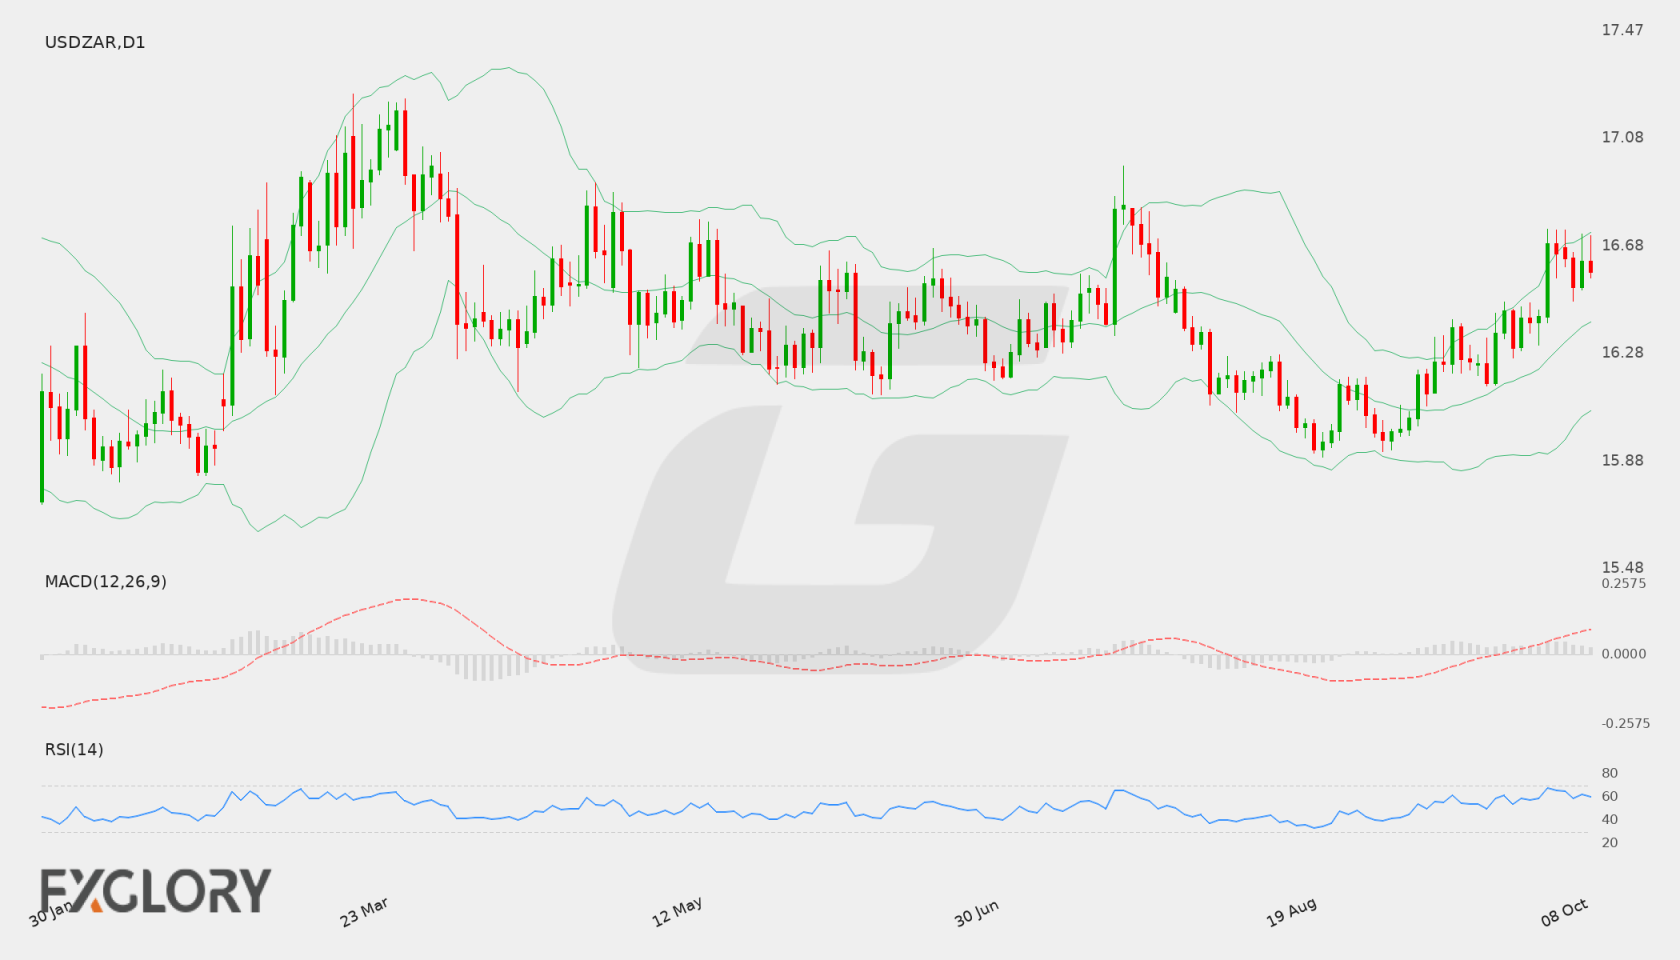
The weekly case is led by the bullish D1 trend state and positive momentum. The 16.58158 D1 close is above the 16.47136 primary support and below the 16.72706 primary resistance, leaving those levels as the immediate structural boundaries for the week.
The counterweight is tactical: H4 is bearish, with negative MACD conditions and a lower H4 close relative to its middle Bollinger level. That conflict does not replace the D1 thesis, but it raises the possibility of hesitation or a support test before any directional development.
USD/ZAR D1 technical-analysis context for the weekly forecast. Chart data captured 11 October 2026.
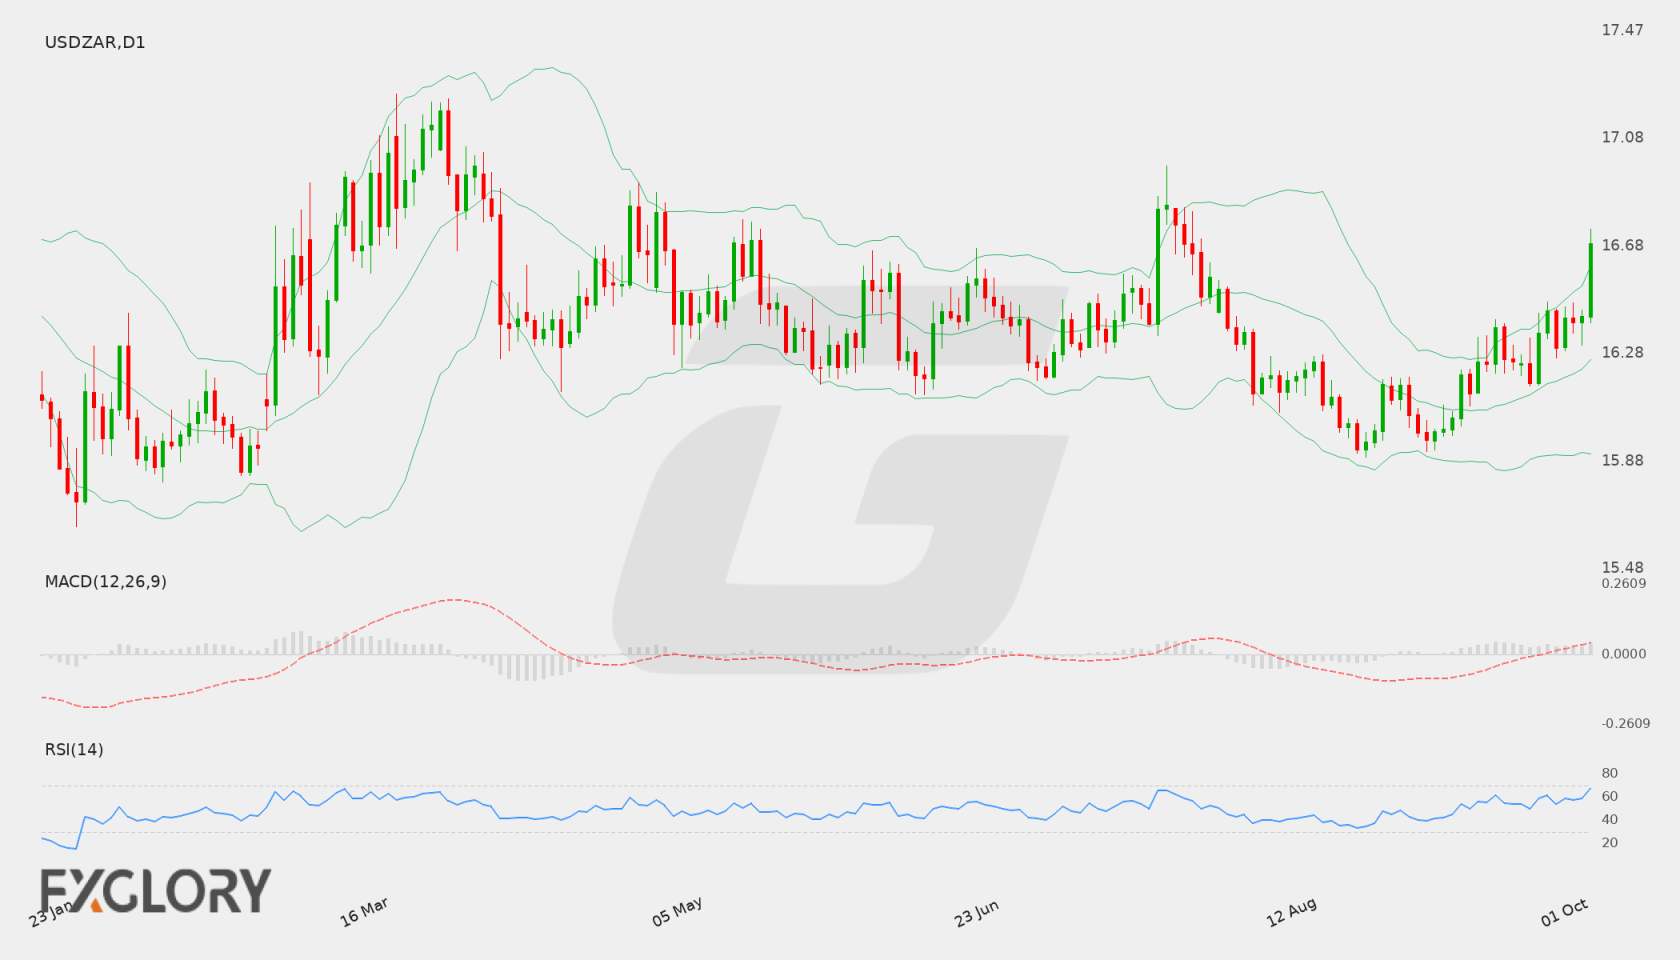
USD/ZAR maintains a bullish bias toward 16.83936 while holding above support at 16.37628.
USD/ZAR closed the prior session at 16.40765, positioned firmly above the D1 200 SMA at 16.37628. Bullish alignment across daily and four-hour moving averages supports a continued move toward primary resistance at 16.46856 and secondary resistance at 16.83936.
Downside risks remain contained while the pair stays above primary support at 16.37628 and secondary support at 16.26193. A breach below these levels would expose lower targets at 16.18889 and 16.11946.
USD/ZAR D1 technical-analysis context for the weekly forecast. Chart data captured 2 October 2026.
The USD/ZAR currency pair remains sensitive to economic data trends and global risk sentiment. High-impact US releases, including GDP updates, inflation gauges, and comprehensive labor market data, serve as major catalysts for US Dollar valuations. Market participants continue to gauge underlying economic resilience and interest rate expectations, which directly influence flows into emerging market currencies like the South African Rand.
Price Action:
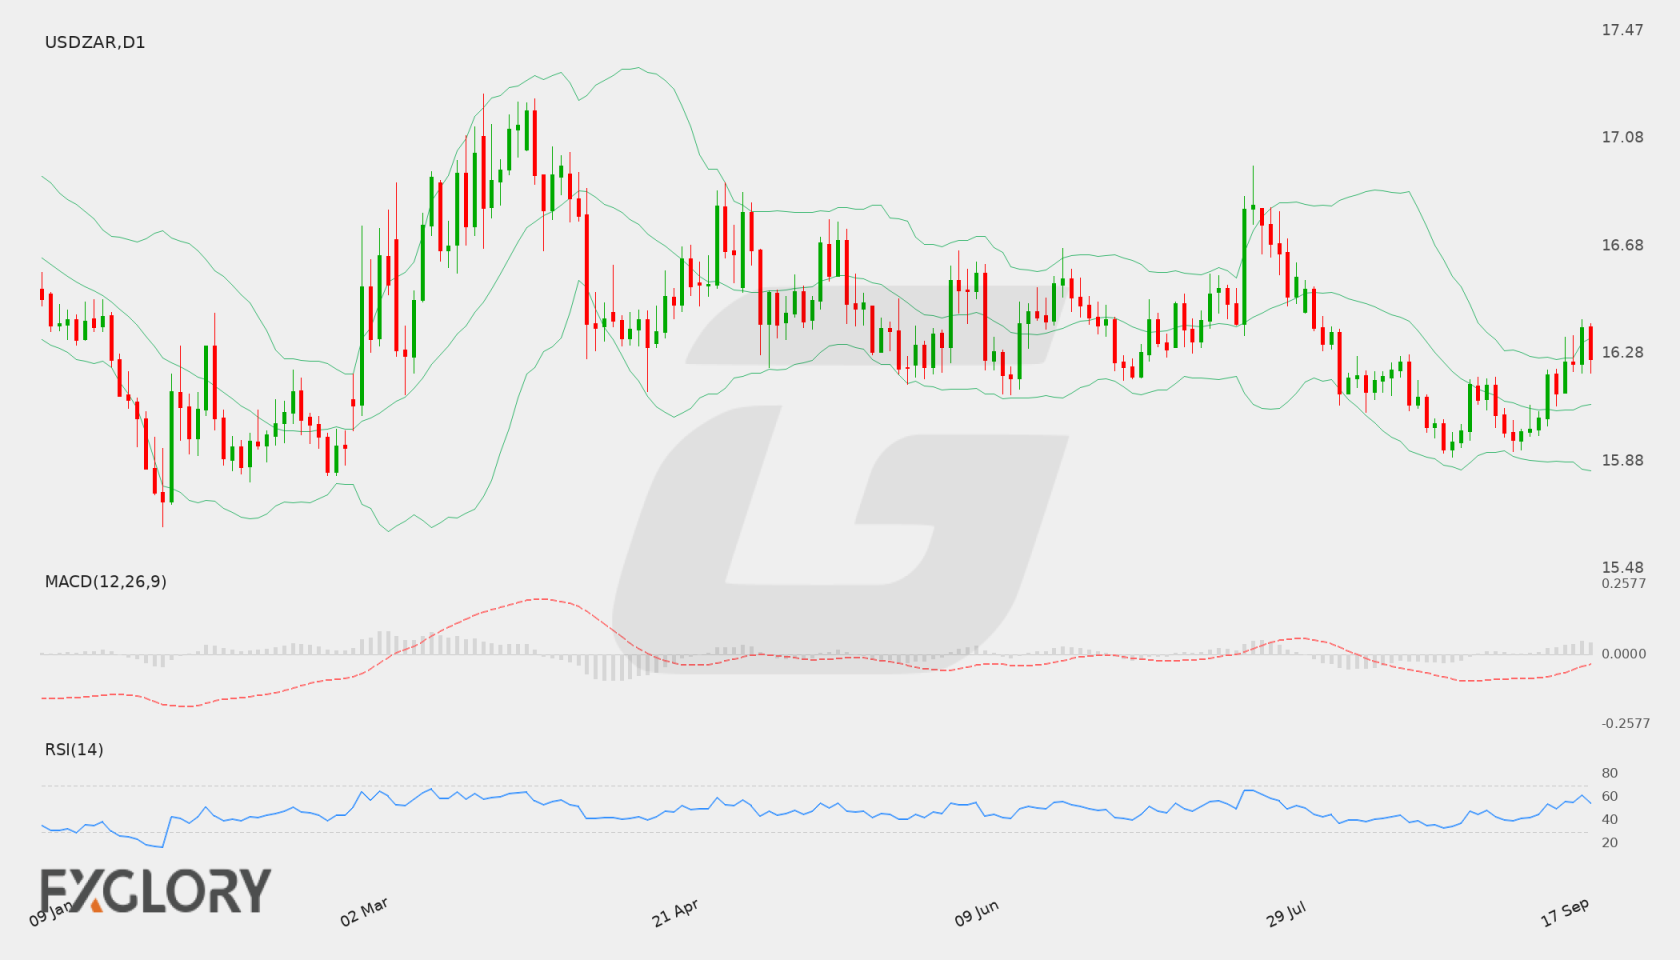
On the daily (D1) chart, USD/ZAR (USDZAR) recently closed at 16.25807, consolidating after a brief rise toward the 16.3746 level. The pair continues to trade within a broader structure defined by a key support zone at 15.89213 and an upper resistance level at 16.97254. Recent daily candles display a mix of modest upward pushes and pullbacks, reflecting balanced trading conditions.
Key Technical Indicators:
Bollinger Bands: The Bollinger Bands indicator shows a middle band (20-day moving average) at 16.08876, an upper band at 16.33481, and a lower band at 15.84272. With the last close at 16.25807, USD/ZAR is trading above the middle line and near the upper boundary, indicating that recent price action has leaned toward the upper half of the band envelope.
RSI: The 14-period Relative Strength Index (RSI) stands at 54.49. Positioned slightly above the neutral 50 level, the RSI reflects a balanced market with a slight bias toward buyers, remaining well clear of overbought or oversold territories.
MACD: The Moving Average Convergence Divergence (MACD) indicator records a reading of 0.00858. Operating above the zero mark, the positive MACD value suggests mild bullish momentum, although the histogram signal remains moderate.
Support and Resistance:
Key technical levels for USD/ZAR include immediate support around 15.89213, reinforced by the lower Bollinger Band area. On the upside, major resistance is established at 16.97254, which bounds potential bullish rallies.
News to Watch for USDZAR This Week:
CB Consumer Confidence: Shifts in consumer sentiment can impact economic outlooks and influence dollar demand.
JOLTS Job Openings: High job openings reflect labor market strength, which can alter rate expectations.
Core PCE Price Index m/m: Key inflation metrics guide central bank decisions on monetary policy adjustments.
Final GDP q/q: Growth data provides confirmation on overall economic expansion and currency strength.
ISM Manufacturing PMI: Manufacturing sector health reflects broad economic activity and business sentiment.
Average Hourly Earnings m/m: Wage growth trends feed into underlying inflationary pressures and policy outlooks.
Non-Farm Employment Change: Broader employment data significantly influences market volatility and currency trends.
Unemployment Rate: Joblessness metrics help gauge labor market slack and economic stability.
Weekly Outlook and Consideration:
The weekly outlook for USD/ZAR (USDZAR) presents a neutral-to-slightly bullish technical setup on the daily timeframe. Price trades at 16.25807 above the 16.08876 middle Bollinger Band, supported by a modest positive MACD of 0.00858 and an RSI of 54.49. While technicals point to mild constructive momentum within the 15.89213 support and 16.97254 resistance corridor, market momentum will largely depend on incoming economic releases and risk sentiment.
Disclaimer: The analysis provided for USD/ZAR is for informational purposes only and does not constitute investment advice. Traders are encouraged to perform their own analysis and research before making any trading decisions. Market conditions can change quickly, so staying informed with the latest data is essential.
USD/ZAR remains sensitive to scheduled market events and broader risk sentiment. Traders should watch high-impact calendar releases and USD movement where relevant before forming a directional view.
Price Action:
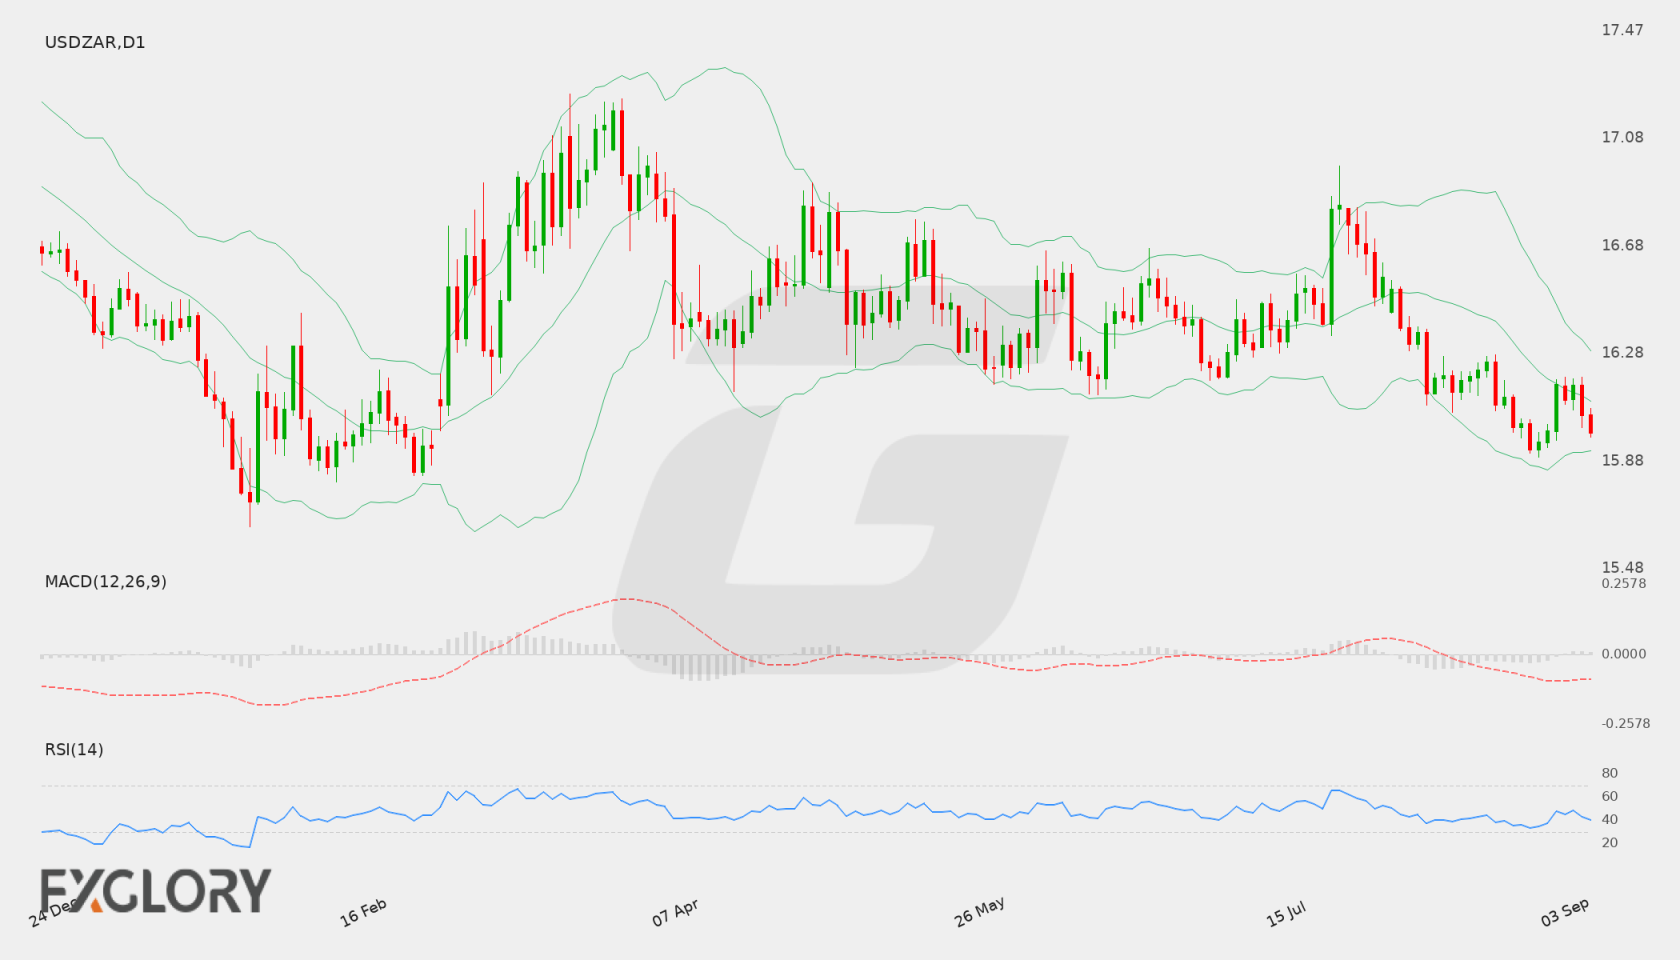
USDZAR is trading near 15.98489, with current daily movement framed by nearby support and resistance.
Key Technical Indicators:
Bollinger Bands: Price is being assessed against the 20-period Bollinger Bands, with middle band near 16.101828, upper band near 16.288598905721, and lower band near 15.915057094279.
RSI: RSI(14) is near 40.343629860654, suggesting traders should watch whether momentum holds, reaches overbought pressure, or weakens toward oversold territory.
MACD: MACD is near -0.085689995376899, so momentum should be watched for continuation or loss of strength on the daily chart.
Support and Resistance:
Key support is near 15.89213, while key resistance is near 16.97254.
News to Watch for USDZAR This Week:
Watch scheduled high-impact releases, central bank comments, and broader risk sentiment this week; no specific calendar events are available in current plugin data.
Weekly Outlook and Consideration:
USD/ZAR may remain guided by daily price action, support and resistance reactions, momentum indicators, and supplied calendar events. Traders should wait for confirmation around key levels and avoid assuming that current conditions guarantee the next move.
Disclaimer: The analysis provided for USD/ZAR is for informational purposes only and does not constitute investment advice. Traders are encouraged to perform their own analysis and research before making any trading decisions. Market conditions can change quickly, so staying informed with the latest data is essential.
The USD/ZAR currency pair remains largely influenced by broad US dollar sentiment and overall risk appetite across emerging markets. Upcoming economic announcements from the United States, particularly regarding employment and manufacturing sectors, are poised to impact trader expectations and drive short-term price movements in USD/ZAR.
Price Action:
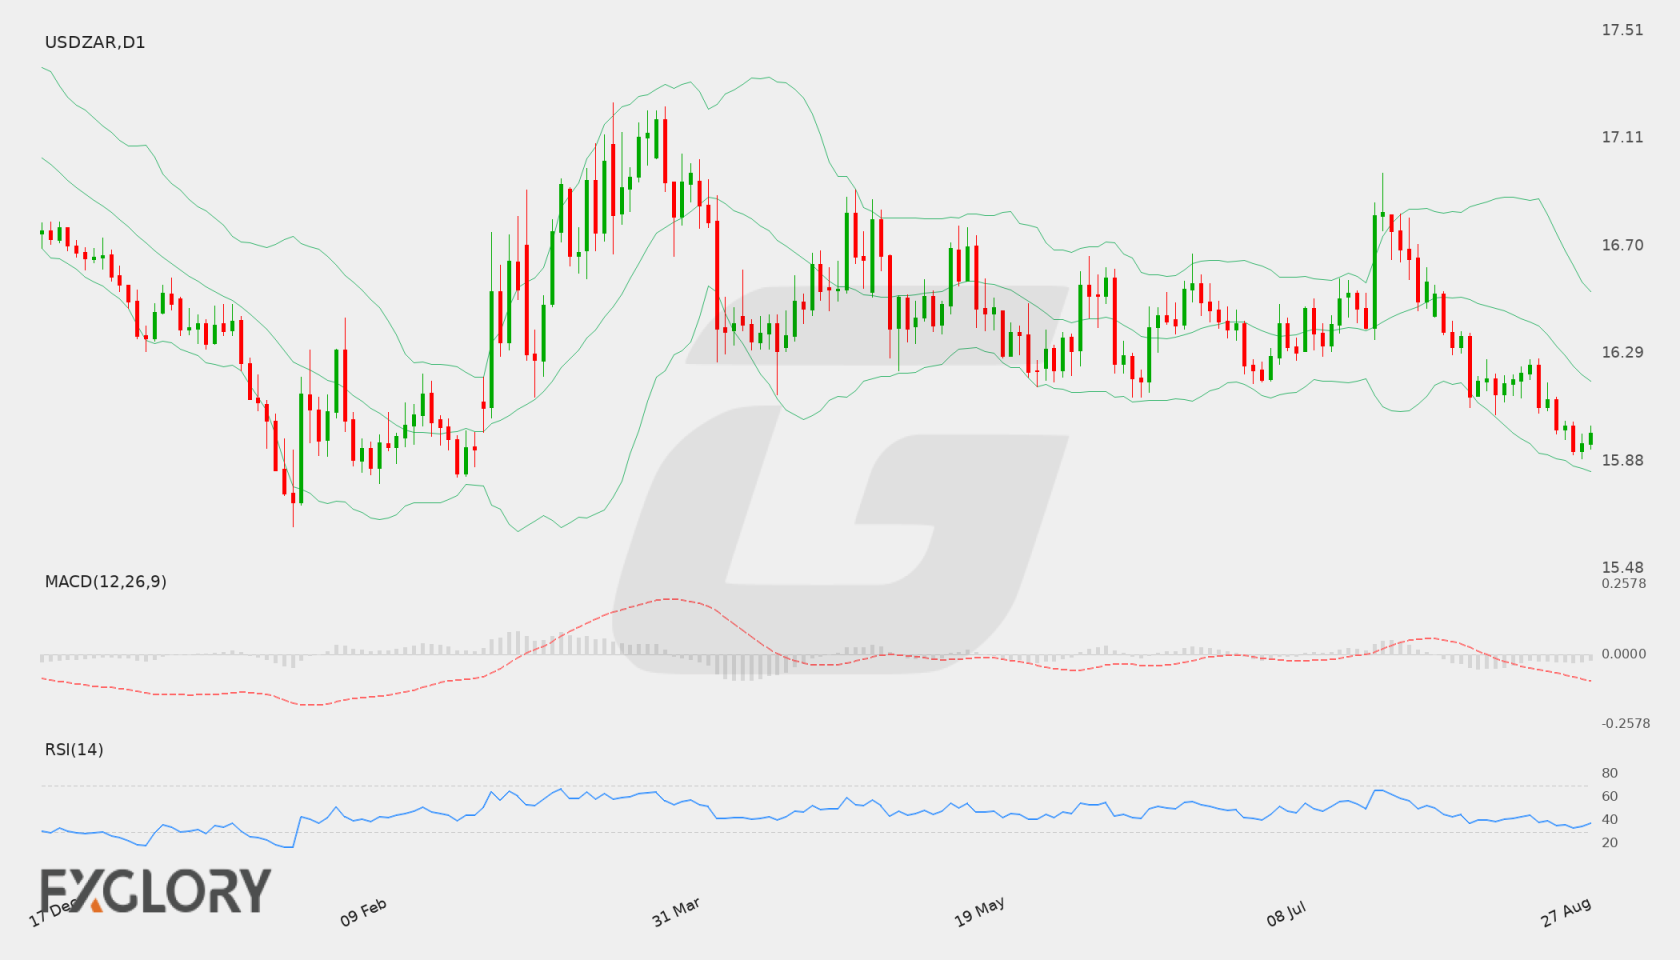
On the Daily (D1) chart, USD/ZAR has experienced sustained selling pressure, with the price trending downward to close at 15.98954. Recent daily candles demonstrate a pattern of lower highs and lower lows, pressing the price near recent local support levels.
Key Technical Indicators:
Bollinger Bands: The Bollinger Bands display a downward tilt as USD/ZAR trades near the lower band at 15.84433. The middle band (20-period moving average) sits at 16.18481, acting as dynamic overhead resistance, while the upper band is located at 16.52530.
RSI: The 14-day Relative Strength Index (RSI) stands at 37.41. This reading indicates bearish momentum without entering oversold territory below 30, suggesting sellers currently retain market control.
MACD: The MACD indicator reinforces the prevailing bearish momentum, registering a value of -0.12090. Positioned below the zero line, the technical oscillator shows that downside momentum continues to guide the pair on the daily timeframe.
Support and Resistance:
Key technical levels for USD/ZAR include a primary support level at 15.89213, backed by the lower Bollinger Band at 15.84433. To the upside, main resistance is established at 16.97254, with intermediate resistance near the middle Bollinger Band at 16.18481.
News to Watch for USDZAR This Week:
ISM Manufacturing PMI: Measures manufacturing economic activity which can influence broader US dollar valuation.
JOLTS Job Openings: Indicates total job openings and labor demand trends across the economy.
ISM Manufacturing Prices: Tracks price inflation experienced by manufacturers during production processes.
ADP Non-Farm Employment Change: Provides an early indicator of private sector employment performance.
ISM Services PMI: Evaluates growth conditions within the services sector to gauge economic momentum.
Unemployment Rate: Details the percentage of unemployed individuals actively seeking work.
Average Hourly Earnings m/m: Assesses wage growth trends which directly influence consumer inflation.
Weekly Outlook and Consideration:
The D1 outlook for USD/ZAR reflects a firm bearish trend supported by an RSI of 37.41 and a negative MACD value of -0.12090. If the current downward pressure persists, the pair may test key support at 15.89213. Conversely, if buyers regain footing, a corrective move toward the middle Bollinger Band around 16.18481 could materialize, with broader resistance capped near 16.97254. Market participants will watch incoming economic releases for directional clarity.
Disclaimer: The analysis provided for USD/ZAR is for informational purposes only and does not constitute investment advice. Traders are encouraged to perform their own analysis and research before making any trading decisions. Market conditions can change quickly, so staying informed with the latest data is essential.