Time Zone: GMT +3
Time Frame: Daily (D1) / Weekly Outlook
Weekly Fundamental Overview:
The USD/SEK currency pair reflects ongoing economic interactions between the United States and Sweden. Market sentiment remains influenced by interest rate expectations, inflation updates, and broader risk appetite across global markets. Upcoming macroeconomic data releases from the US could influence market expectations and drive short-term price adjustments in USDSEK.
Price Action:
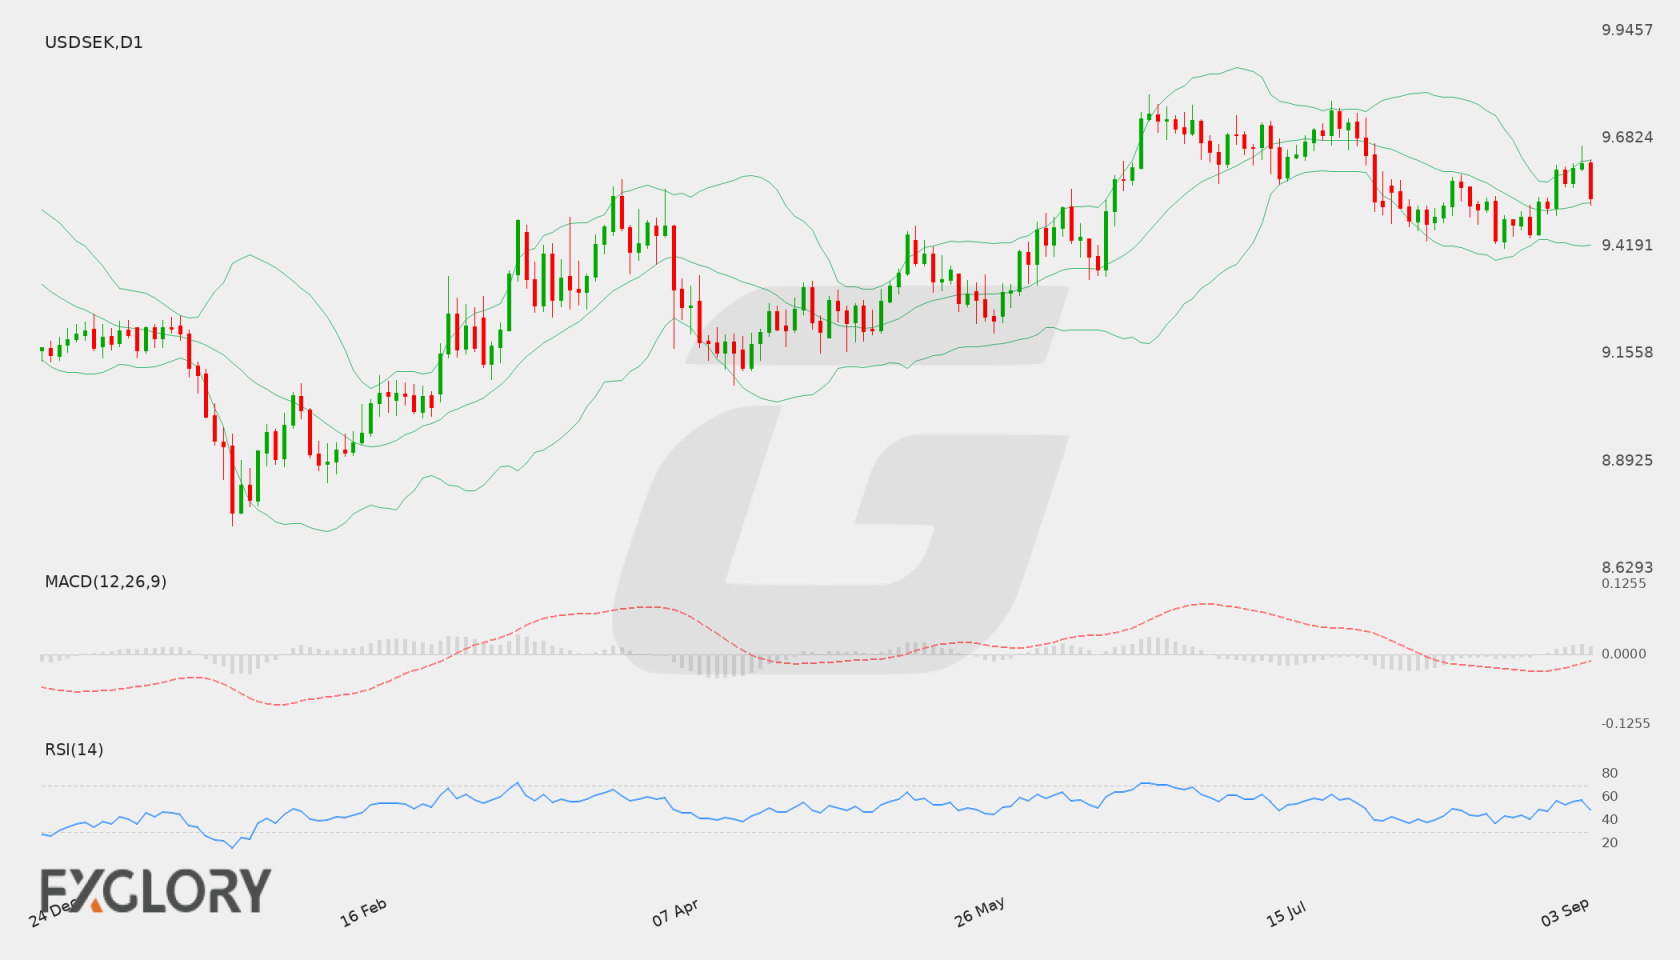
On the Daily (D1) chart, USD/SEK recently settled at 9.53546 following recent fluctuations between high and low daily ranges. Price action indicates a period of consolidation as the pair trades near its mid-range technical levels. A sustained push past recent swing highs could trigger bullish momentum, while a breach of recent lower boundaries may open room for downside testing.
Key Technical Indicators:
Bollinger Bands: The daily Bollinger Bands reveal a middle band at 9.52394, an upper band at 9.62769, and a lower band at 9.42018. With USD/SEK closing at 9.53546, price sits slightly above the middle band, reflecting a neutral structure with equal distance toward upper and lower volatility bounds.
RSI: The 14-day Relative Strength Index (RSI) stands at 48.72, placing the indicator firmly in neutral territory. This value shows neither overbought nor oversold market conditions, signaling potential for movement in either direction based on emerging sentiment.
MACD: The MACD indicator records a reading of 0.00065, reflecting a flat to mildly positive momentum signal. This modest value suggests a lack of aggressive trending bias, leaving the market in a state of balance ahead of potential new catalysts.
Support and Resistance:
Key technical levels for USD/SEK highlight strong support at 9.3369 and key resistance at 9.78994. In the immediate term, the middle Bollinger Band around 9.52394 acts as local support, whereas the upper band at 9.62769 offers dynamic resistance.
News to Watch for USDSEK This Week:
- PPI m/m: This producer inflation metric offers insight into wholesale price pressures affecting overall economic trends.
- Core PPI m/m: Excluding volatile components, this measure highlights underlying supply-side price pressures.
- Unemployment Claims: This release provides a weekly update on labor market health and potential shifts in employment conditions.
- Core CPI m/m: Tracking underlying consumer prices, this data helps gauge monthly inflationary persistence.
- CPI y/y: Measuring annual consumer price shifts, this key figure reflects broader cost-of-living trends.
- Core CPI y/y: Highlighting long-term inflation dynamics, this reading measures underlying consumer price trends over the past year.
- CPI m/m: This monthly metric tracks changes in headline consumer prices to evaluate short-term inflation momentum.
- Prelim UoM Inflation Expectations: Surveying consumer outlooks, this indicator shows public expectations regarding future price shifts.
- Prelim UoM Consumer Sentiment: Reflecting household optimism, this reading provides insight into consumer spending expectations.
Weekly Outlook and Consideration:
The weekly outlook for USD/SEK points toward a balanced, range-bound scenario based on Daily technical indicators. Closing at 9.53546 above the 9.52394 middle Bollinger Band with a neutral RSI of 48.72, the pair lacks clear directional impulse. A break above 9.62769 could clear the pathway toward primary resistance at 9.78994, while a drop below 9.52394 may direct focus toward major support at 9.3369.
Disclaimer: The analysis provided for USD/SEK is for informational purposes only and does not constitute investment advice. Traders are encouraged to perform their own analysis and research before making any trading decisions. Market conditions can change quickly, so staying informed with the latest data is essential.