Time Zone: GMT +3
Time Frame: Daily (D1) / Weekly Outlook
Weekly Fundamental Overview:
USD/JPY trading dynamics are driven by incoming high-impact economic data from the United States, including key inflation metrics, employment reports, and manufacturing sentiment. Market participants remain focused on potential interest rate differentials and broad market risk sentiment impacting the pair.
Price Action:
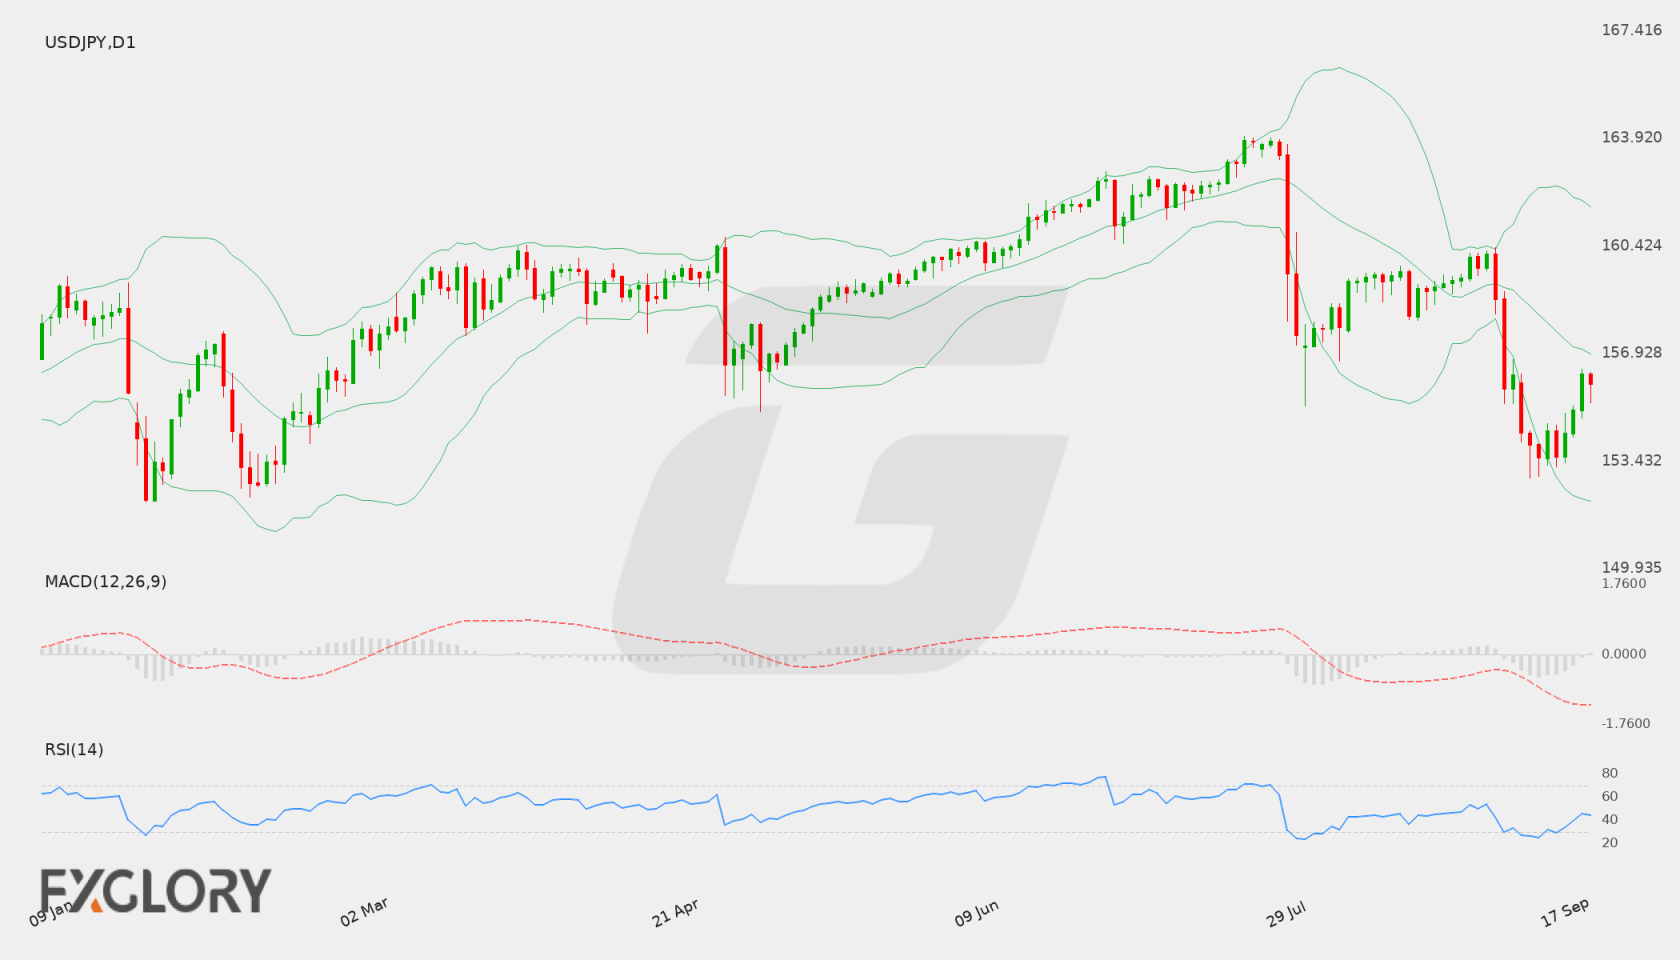
Daily chart analysis reveals USD/JPY recently rebounded from lower levels near 152.878 toward 156.25 before settling around 155.956. The pair has experienced a pullback from recent peaks near 163.973, showing mixed momentum as buyers attempt to establish stability above key support zones.
Key Technical Indicators:
Bollinger Bands: The Bollinger Bands on the D1 chart show a middle band at 156.904, with an upper band at 161.691 and a lower band at 152.116. Price action at 155.956 remains positioned just below the middle boundary, indicating mild downside bias within the wider band range.
RSI: The 14-day Relative Strength Index (RSI) stands at 44.36, placing USD/JPY in neutral territory below the 50 midpoint. This indicates slight bearish bias without entering oversold conditions.
MACD: The D1 MACD indicator posts a reading of -1.234, remaining below the zero signal threshold. This negative value reflects recent bearish momentum, though stabilizing price action suggests potential slowing in downside pressure.
Support and Resistance:
Key technical levels for USD/JPY include primary support at 152.878 and major resistance at 163.973. On the daily timeframe, additional reference points are defined by the lower Bollinger band at 152.116 and the upper band at 161.691.
News to Watch for USDJPY This Week:
- CB Consumer Confidence: Assesses household confidence, influencing expectations for domestic spending and overall market sentiment.
- JOLTS Job Openings: Offers insights into labor market tightness, potentially driving currency demand.
- ADP Non-Farm Employment Change: Provides an early indicator of private-sector job creation ahead of official employment figures.
- Core PCE Price Index m/m: Measures core inflation trends, which closely align with central bank policy considerations.
- Final GDP q/q: Reflects finalized economic growth figures that can alter broader economic assessments.
- ISM Manufacturing PMI: Gauges manufacturing sector activity and overall business environment conditions.
- Average Hourly Earnings m/m: Highlights wage inflation dynamics affecting overall price pressure trends.
- Non-Farm Employment Change: Provides key payroll figures that heavily impact broader economic expectations.
- Unemployment Rate: Measures labor force unemployment levels, serving as a vital indicator of economic health.
Weekly Outlook and Consideration:
USD/JPY enters the weekly session trading near 155.956, positioned slightly below its 20-day Bollinger middle band of 156.904. With the daily RSI at 44.36 and MACD at -1.234, indicators signal prevailing bearish momentum alongside recent stabilization above key support at 152.878. A sustained move above the middle band could open room toward resistance near 163.973, whereas a breakdown below support would focus attention toward the lower Bollinger band at 152.116. Major upcoming economic data releases may serve as primary catalysts for near-term directional breakout.
Disclaimer: The analysis provided for USD/JPY is for informational purposes only and does not constitute investment advice. Traders are encouraged to perform their own analysis and research before making any trading decisions. Market conditions can change quickly, so staying informed with the latest data is essential.