Current weekly forecast: This outlook covers 11–17 October 2026 and remains valid until 17 October 2026, unless its stated invalidation condition is triggered earlier.
In brief
GBP/USD has a bearish weekly bias, supported by D1 structure and negative momentum, while mixed closes and neutral H4 conditions leave room for consolidation.
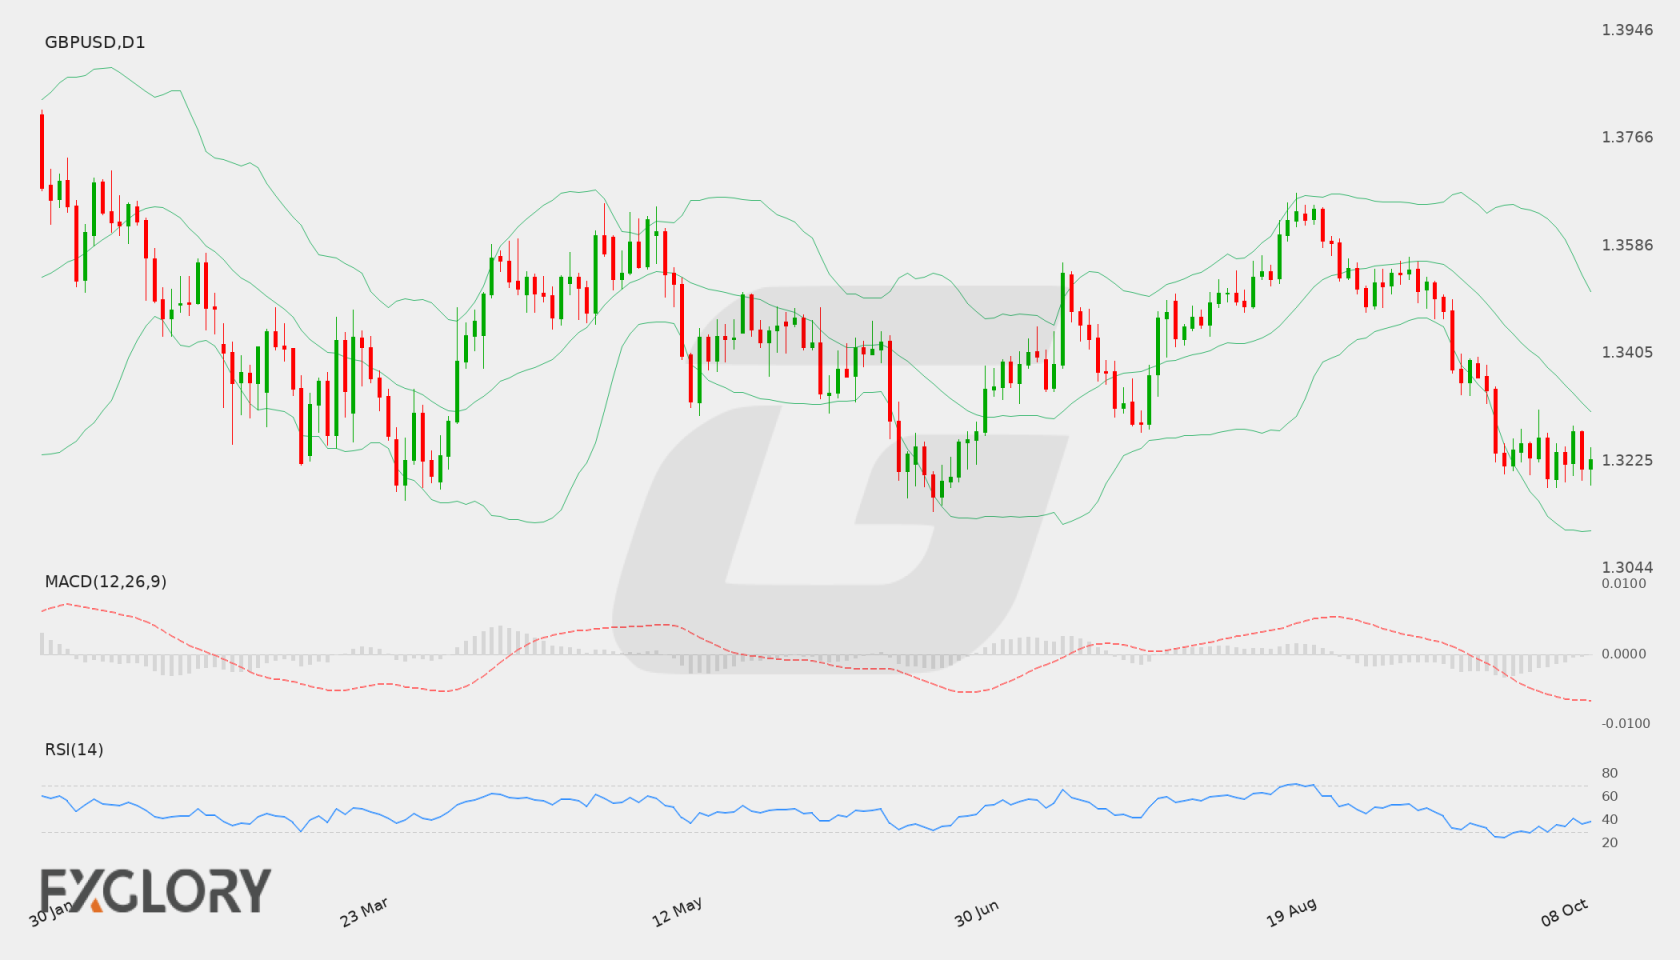
The weekly thesis is led by a bearish D1 trend state and negative momentum. The 1.32267 D1 close is below the 1.32713 primary resistance and the 1.33077 Bollinger middle band, while the falling EMA50 and SMA200 slopes reinforce the broader downside structure.
The setup is not one-sided: D1 closes are mixed, and H4 is neutral with a positive MACD histogram despite a near-50 RSI. That combination can delay directional follow-through, making 1.31803 and 1.31392 the important downside reference levels and 1.32713 to 1.33077 the key recovery area.
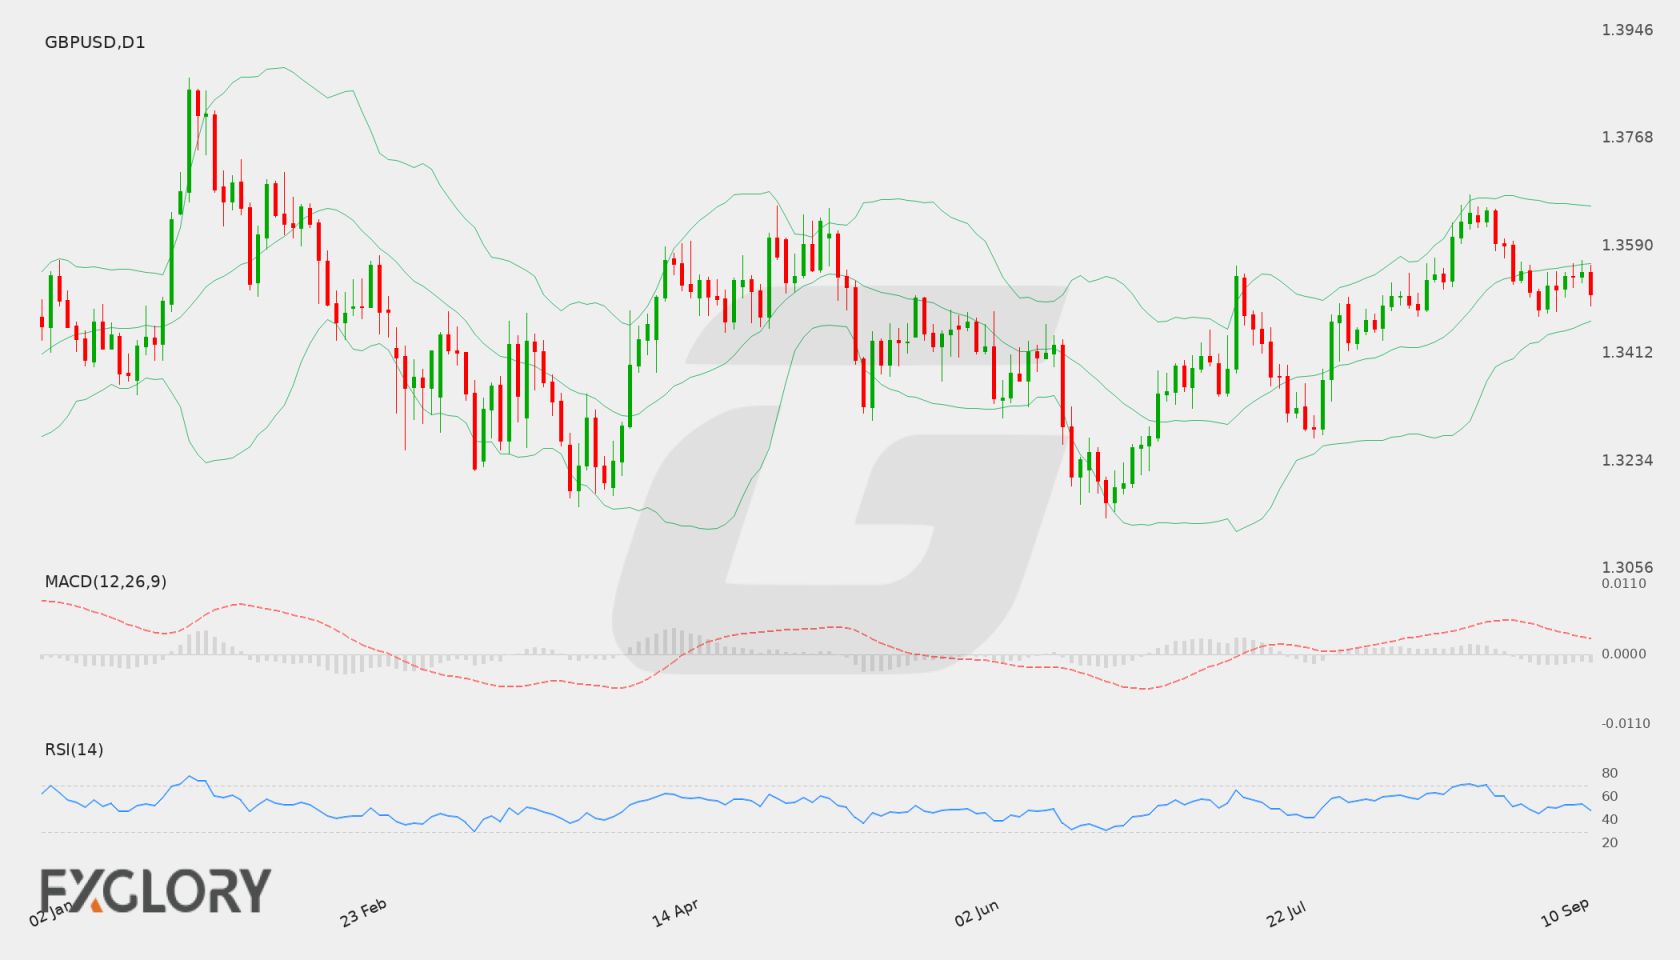
GBP/USD D1 technical-analysis context for the weekly forecast. Chart data captured 11 October 2026.
Macroeconomic dynamics for GBP/USD (GBPUSD) are set to be influenced by upcoming United States economic indicators. Market participants will gauge economic momentum, monetary policy deliberations, labor market trends, and consumer sentiment to assess the fundamental trajectory of the currency pair.
Price Action:
GBP/USD (GBPUSD) has maintained a clear downward trend on the daily timeframe, extending its decline from recent peaks to finish the session at a close of 1.31958. The market tested an intraday low of 1.31794, reflecting sustained selling pressure and leaving the pair positioned near the bottom of its recent trading range.
Key Technical Indicators:
Bollinger Bands: On the daily chart, GBP/USD (GBPUSD) trades well below the middle Bollinger Band at 1.33817, closing at 1.31958. Price action is pressing near the lower band at 1.31320, while the upper band is positioned at 1.36315, highlighting ongoing downside volatility and bearish distribution.
RSI: The 14-day RSI for GBP/USD (GBPUSD) sits at 29.37, pushing beneath the standard threshold into oversold territory. While this reading demonstrates severe downward pressure, it also points to the potential for selling momentum to moderate if buyers attempt a technical defense.
MACD: The daily MACD for GBP/USD (GBPUSD) registers at -0.00765, remaining positioned in negative territory. This placement confirms that downward momentum is firmly intact without immediate technical evidence of a bullish divergence.
Support and Resistance:
Technical parameters for GBP/USD (GBPUSD) on the daily chart identify immediate support at 1.31794 and overhead resistance at 1.36742. A break below the support boundary could confirm further directional weakness, whereas the resistance level represents a substantial ceiling against upside pullbacks.
News to Watch for GBPUSD This Week:
ISM Services PMI: Shifts in services sector activity can influence market expectations for economic growth and monetary policy.
FOMC Meeting Minutes: Detailed insights from the policy meeting may provide clues regarding future interest rate trajectories.
Unemployment Claims: Weekly jobless figures reflect labor market conditions and can affect broader risk sentiment.
Prelim UoM Inflation Expectations: Changes in consumer inflation outlooks could shift monetary policy expectations.
Prelim UoM Consumer Sentiment: Consumer confidence measures offer insight into household spending appetite and economic resilience.
Weekly Outlook and Consideration:
Heading into the new trading week, GBP/USD (GBPUSD) maintains a bearish bias following its close at 1.31958. The negative MACD at -0.00765 and price positioning near the lower Bollinger Band of 1.31320 reinforce the dominant downward structure. Nonetheless, with the daily RSI at 29.37 registering oversold conditions, price behavior around the 1.31794 support level will be pivotal. Sustained movement beneath 1.31794 could lead to extended declines, whereas stabilization above this mark may open the door for a corrective pause toward the middle band at 1.33817. The 1.36742 resistance mark remains the primary long-term barrier. Scheduled high-impact data releases, including the ISM Services PMI, FOMC Meeting Minutes, Unemployment Claims, Prelim UoM Inflation Expectations, and Prelim UoM Consumer Sentiment, are likely to dictate volatility.
Disclaimer: The analysis provided for GBP/USD is for informational purposes only and does not constitute investment advice. Traders are encouraged to perform their own analysis and research before making any trading decisions. Market conditions can change quickly, so staying informed with the latest data is essential.
The fundamental backdrop for GBP/USD (GBPUSD) is shaped by shifting macroeconomic sentiment surrounding economic activity and central bank monetary policy expectations. Market participants continue to weigh broader risk appetite alongside upcoming macroeconomic releases that could influence interest rate outlooks and currency strength.
Price Action:
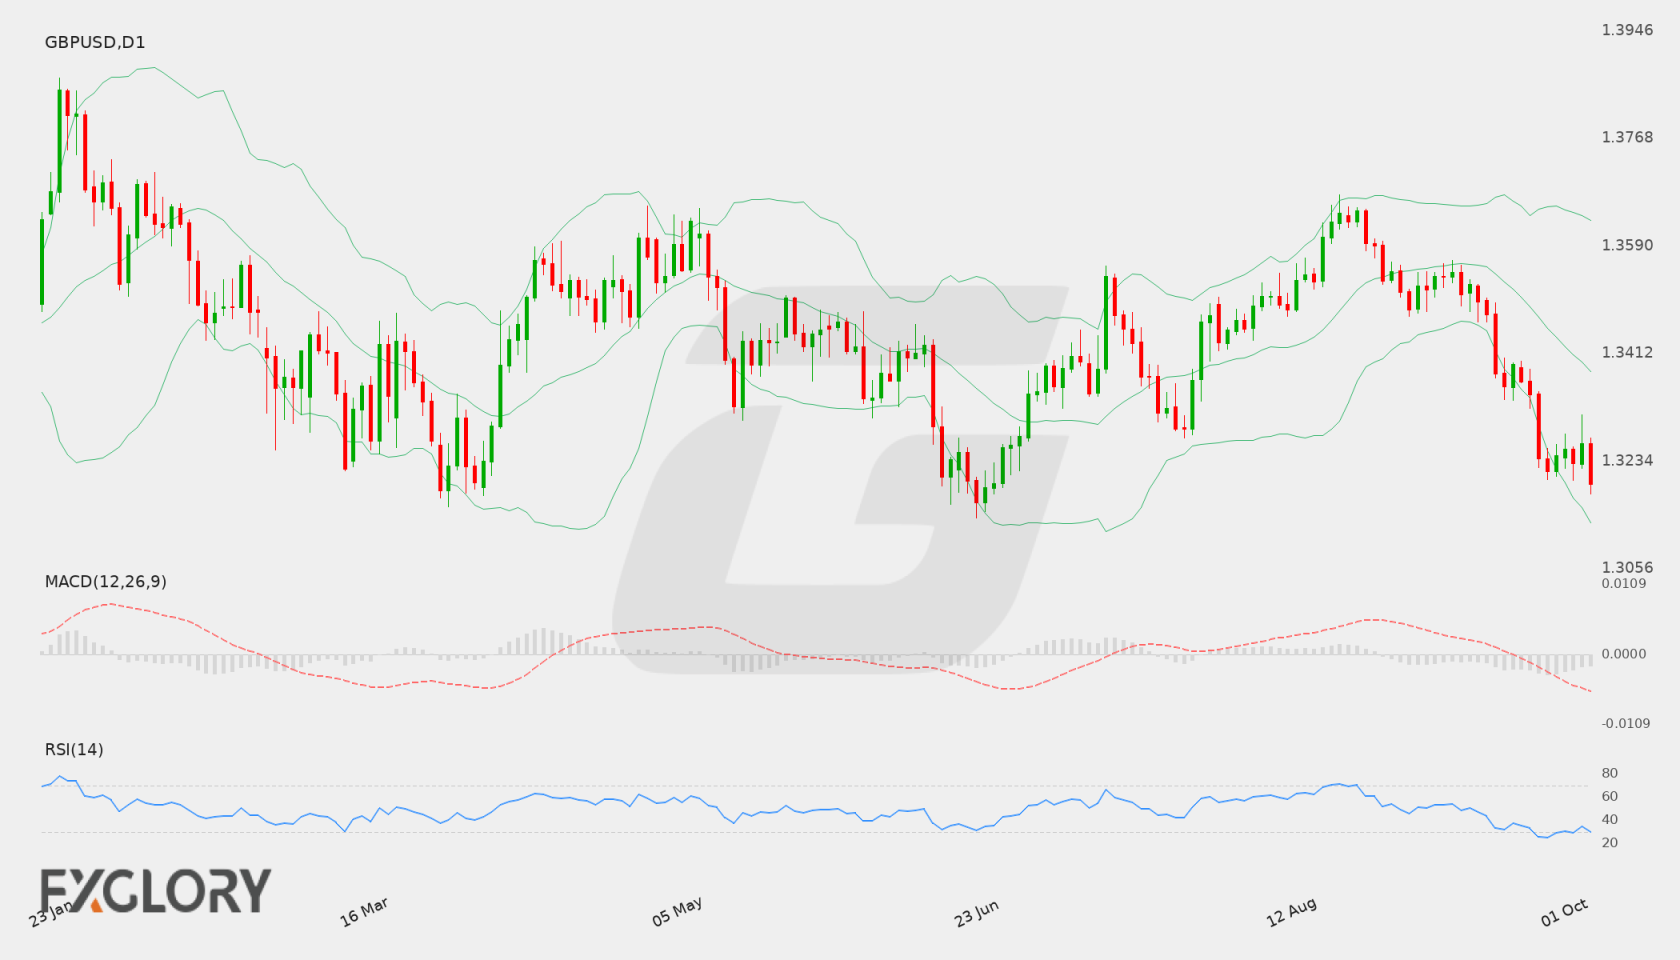
On the daily D1 timeframe, GBP/USD has displayed a prominent downward trajectory over recent sessions, declining to a close of 1.32176. The sustained selling pressure has driven the pair closer to major lower technical boundaries, reflecting dominant bearish sentiment in recent price movements.
Key Technical Indicators:
Bollinger Bands: The daily price close at 1.32176 has pushed below the lower Bollinger Band at 1.32510, highlighting an expansion in market volatility and intense downside momentum. The middle band sits at 1.34526 while the upper band stands at 1.36541.
RSI: The 14-day Relative Strength Index (RSI) is currently reading 24.60. This places the indicator deep within oversold territory below 30, suggesting extreme selling pressure that may precede potential short-term consolidation or corrective bounces.
MACD: The MACD indicator on the D1 chart remains in negative territory with a reading of -0.00608. This ongoing negative posture confirms that short-term bearish momentum continues to prevail over bullish attempts.
Support and Resistance:
Key technical levels for GBP/USD include immediate support around 1.32032, which serves as a critical floor for price action. On the upside, major resistance is located near 1.36742.
News to Watch for GBPUSD This Week:
ISM Manufacturing PMI: This release provides key insights into the health of US manufacturing and can impact USD strength.
ISM Manufacturing Prices: This event tracks price pressures within the manufacturing sector and offers signals on broader inflation trends.
Weekly Outlook and Consideration:
The weekly outlook for GBP/USD (GBPUSD) indicates a predominantly bearish technical environment following recent declines down to 1.32176. With price trading below the lower Bollinger Band (1.32510) and the MACD at -0.00608, sellers maintain control. However, an oversold RSI of 24.60 indicates the potential for volatile price swings or a temporary pause near the key support level at 1.32032. Upside moves will face resistance around 1.36742, while upcoming economic data releases may dictate short-term directional flow.
Disclaimer: The analysis provided for GBP/USD is for informational purposes only and does not constitute investment advice. Traders are encouraged to perform their own analysis and research before making any trading decisions. Market conditions can change quickly, so staying informed with the latest data is essential.
The GBP/USD pair enters the week influenced by a dense slate of economic indicators that could dictate sentiment surrounding the US Dollar while the British Pound responds to broader risk trends. Macroeconomic updates covering consumer sentiment, growth, inflation, and employment will serve as primary catalysts for price movement across the pair.
Price Action:
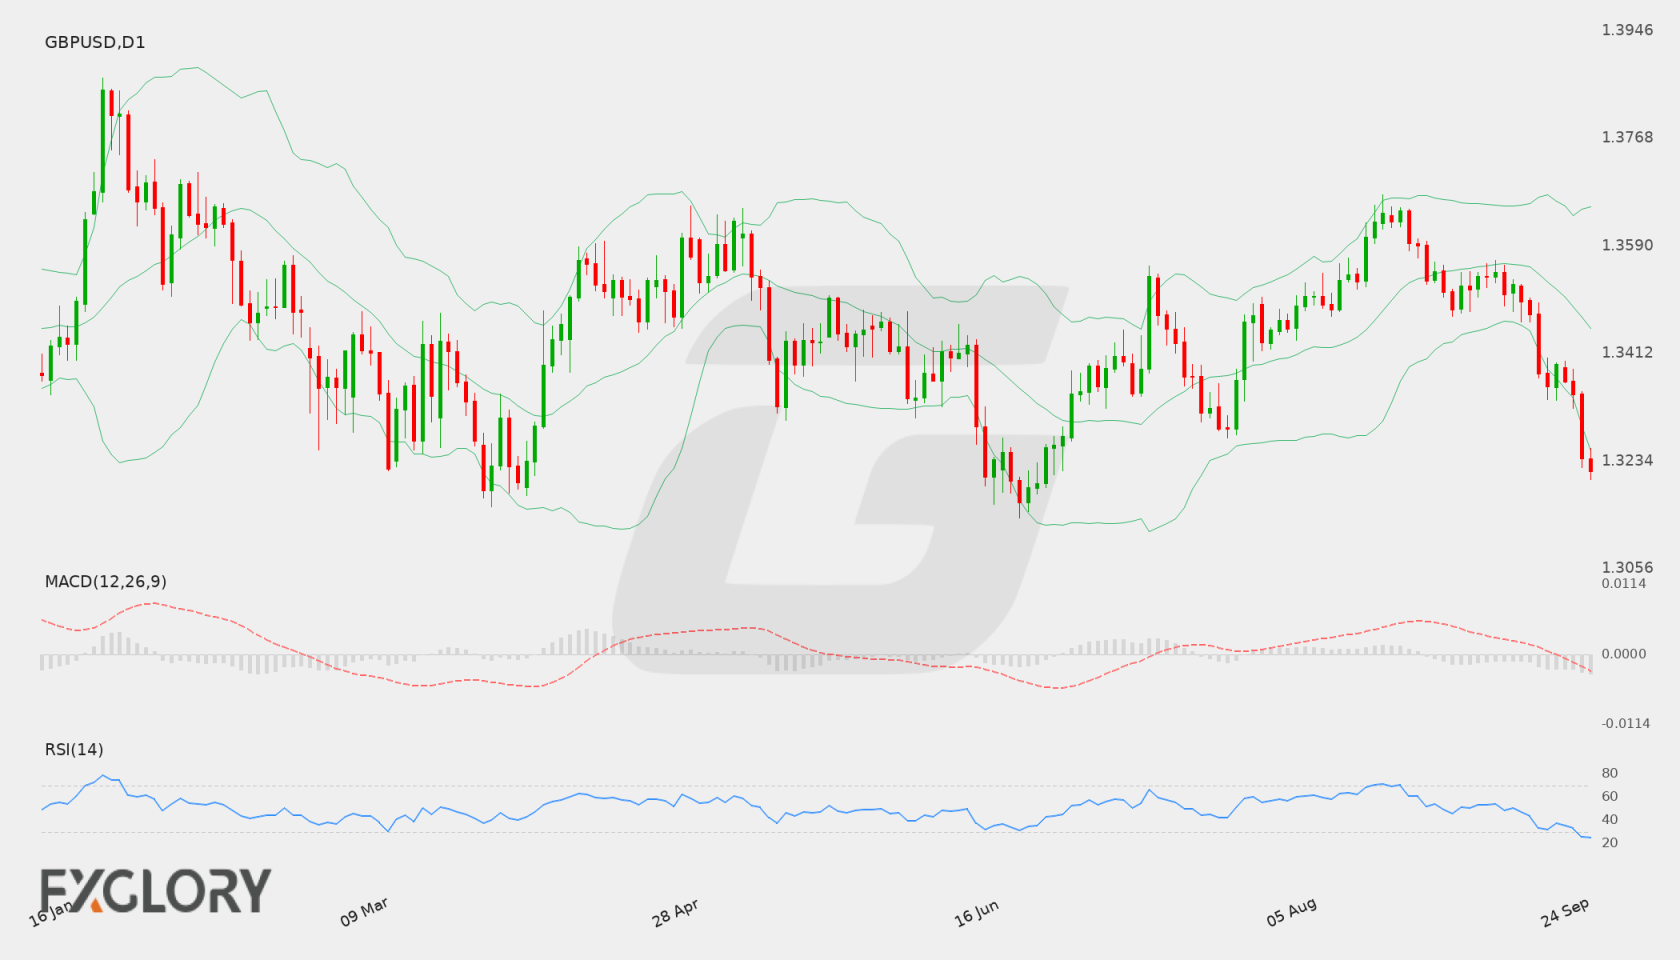
On the daily (D1) chart, GBP/USD has demonstrated clear downside momentum, slipping from recent trading ranges around 1.3500 to close at 1.33575. Consecutive lower closes highlight consistent selling pressure, bringing price action closer to lower technical boundary areas.
Key Technical Indicators:
Bollinger Bands: The daily Bollinger Bands indicate heightened downside pressure for GBP/USD. With a middle band (20-day simple moving average) at 1.35300 and an upper band at 1.36746, the recent close at 1.33575 sits beneath the lower band at 1.33853, pointing to potential oversold conditions or accelerated volatility.
RSI: The 14-day Relative Strength Index (RSI) stands at 31.47. This reading approaches oversold territory, indicating heavy selling activity while signaling that downside momentum could consolidate if buying interest re-emerges near key support.
MACD: The MACD indicator on the daily timeframe remains negative at -0.001945, reflecting sustained bearish momentum as the signal lines remain slanted downward below the neutral threshold.
Support and Resistance:
Technical chart analysis outlines critical support for GBP/USD at 1.31792. On the upside, major technical resistance is situated at 1.36742, with the intermediate 20-day moving average near 1.35300 offering dynamic resistance.
News to Watch for GBPUSD This Week:
CB Consumer Confidence: This index offers insights into household sentiment and spending capacity that can impact dollar demand.
JOLTS Job Openings: Higher or lower job availability provides clues regarding labor market tightness and overall economic health.
ADP Non-Farm Employment Change: Private payroll trends serve as a preliminary gauge for broader employment conditions.
Core PCE Price Index m/m: As a key inflation gauge, this reading influences interest rate expectations.
Final GDP q/q: Comprehensive economic growth figures provide clear momentum signals for the underlying economy.
ISM Manufacturing PMI: Factory activity data reflects economic health and business conditions driving currency valuation.
Average Hourly Earnings m/m: Wage growth trends indicate underlying inflationary pressures in the labor market.
The weekly outlook for GBP/USD remains cautious to bearish based on daily technical indicators. With the last close at 1.33575 below the lower Bollinger Band and an RSI near oversold levels at 31.47, price action may either extend toward key support at 1.31792 or experience short-term consolidation. Traders should monitor resistance around 1.36742 alongside incoming high-impact economic releases that could shift market volatility.
Disclaimer: The analysis provided for GBP/USD is for informational purposes only and does not constitute investment advice. Traders are encouraged to perform their own analysis and research before making any trading decisions. Market conditions can change quickly, so staying informed with the latest data is essential.
The GBP/USD pair enters the week in a cautious stance ahead of critical central bank developments from both the Federal Reserve and the Bank of England. Market participants are monitoring underlying economic data from the UK and US to gauge future interest rate trajectories, which remain the primary macro driver for the currency pair.
Price Action:
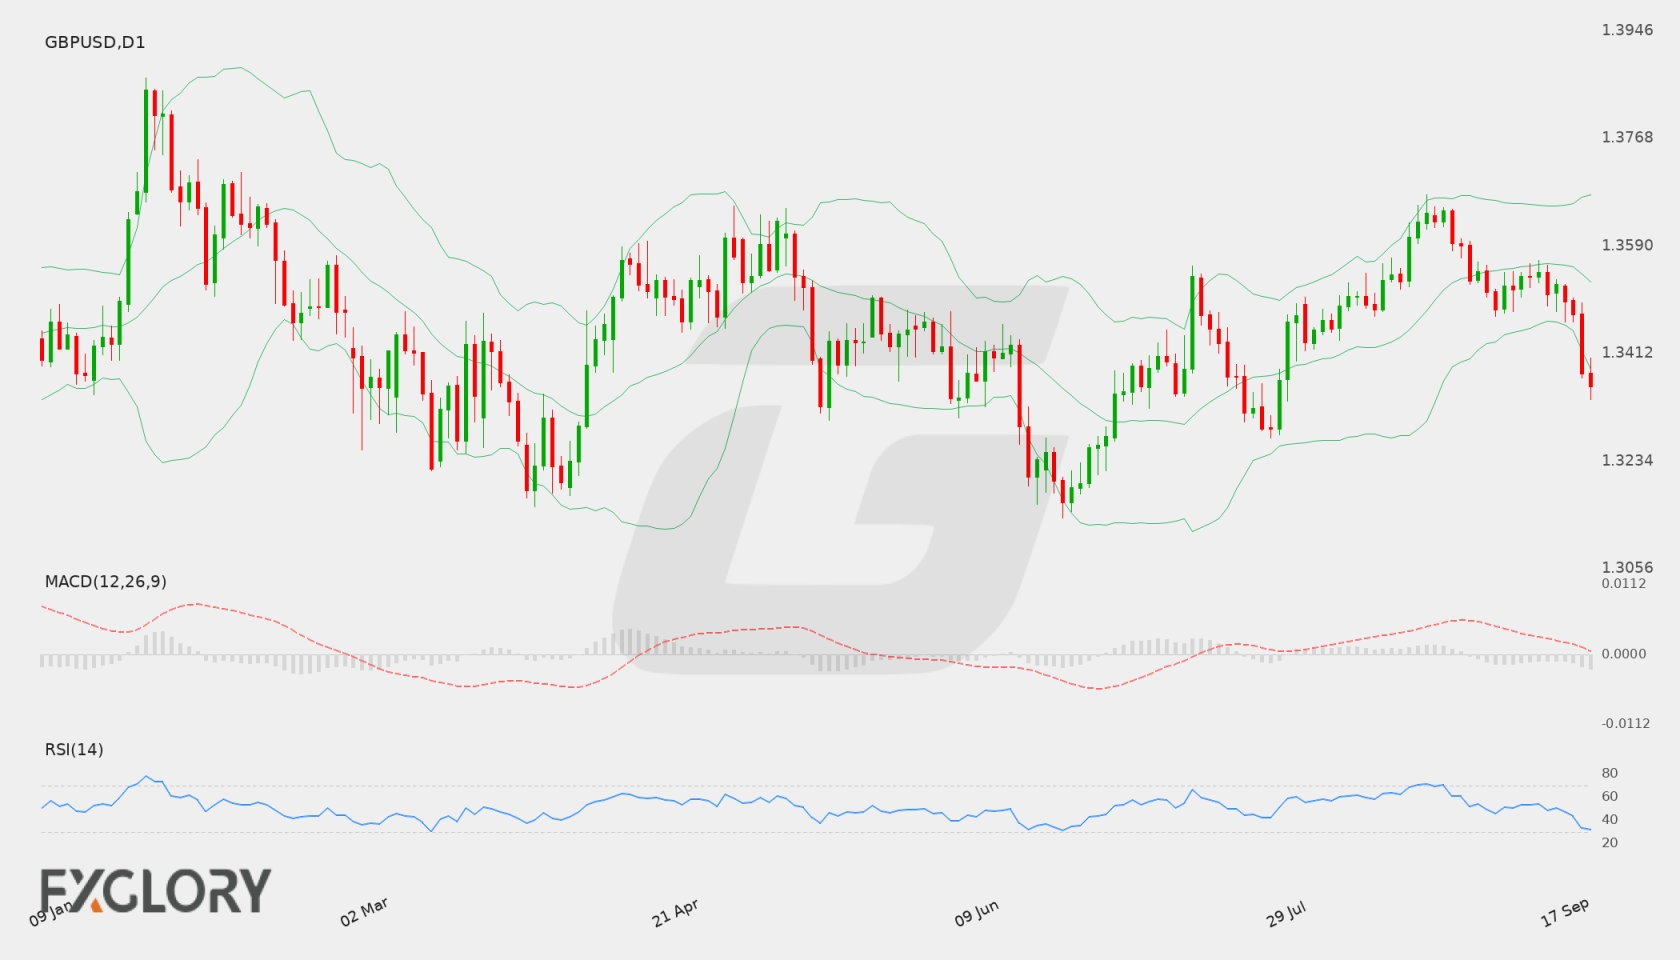
On the Daily (D1) chart, GBP/USD recently pulled back from higher levels toward 1.36476, closing at 1.35105. Recent candles show short-term consolidation as price action moves slightly below the mid-range of recent fluctuations.
Key Technical Indicators:
Bollinger Bands: The D1 Bollinger Bands depict a middle band at 1.35601, an upper band at 1.36555, and a lower band at 1.34647. With the last close at 1.35105, GBPUSD trades just under the middle line, suggesting a slightly soft intraday bias within a defined volatility envelope.
RSI: The 14-period Daily RSI is currently reading 48.30. Positioned near the neutral 50 threshold, the indicator reflects a balanced market state without immediate overbought or oversold signals.
MACD: The D1 MACD indicator currently stands at 0.00129. While remaining in positive territory, the value is relatively flat, signaling limited bullish momentum and indicating potential range-bound movement in the near term.
Support and Resistance:
Key technical references for GBPUSD show major daily support at 1.31392 and major daily resistance at 1.36742. Additional short-term reference points align near the Bollinger upper band at 1.36555 and lower band at 1.34647.
News to Watch for GBPUSD This Week:
Claimant Count Change: Tracks shifts in UK unemployment figures that influence domestic economic sentiment.
Average Earnings Index 3m/y: Measures UK wage growth trends that directly impact domestic inflation pressures.
Retail Sales m/m: Measures broad US retail spending to evaluate overall economic strength.
FOMC Economic Projections: Details Federal Reserve growth and interest rate projections over coming quarters.
FOMC Statement: Communicates official Federal Reserve monetary policy decisions and views.
Federal Funds Rate: Discloses the targeted short-term interest rate setting for the US economy.
FOMC Press Conference: Provides leadership commentary on Federal Reserve rate decisions and policy outlook.
Official Bank Rate: Establishes the benchmark UK policy interest rate.
MPC Official Bank Rate Votes: Reveals internal Bank of England voting distribution regarding rate policy.
Monetary Policy Summary: Explains the rationale behind the Bank of England rate stance and economic guidance.
Weekly Outlook and Consideration:
The weekly outlook for GBP/USD (GBPUSD) indicates a neutral to consolidating market structure around the 1.35105 mark. Indicators such as the D1 RSI at 48.30 and MACD at 0.00129 show balanced momentum. Price action remains bounded between support at 1.31392 and resistance at 1.36742, with central bank releases likely serving as key volatility triggers.
Disclaimer: The analysis provided for GBP/USD is for informational purposes only and does not constitute investment advice. Traders are encouraged to perform their own analysis and research before making any trading decisions. Market conditions can change quickly, so staying informed with the latest data is essential.