Time Zone: GMT +3
Time Frame: Daily (D1) / Weekly Outlook
Weekly Fundamental Overview:
The GBP/CHF currency pair reflects broader macroeconomic trends and market risk sentiment affecting the British pound and Swiss franc. Traders monitor central bank guidance and key economic updates to evaluate the relative strength between the two currencies. Broader market risk dynamics and upcoming economic releases continue to shape trading conditions for GBPCHF.
Price Action:
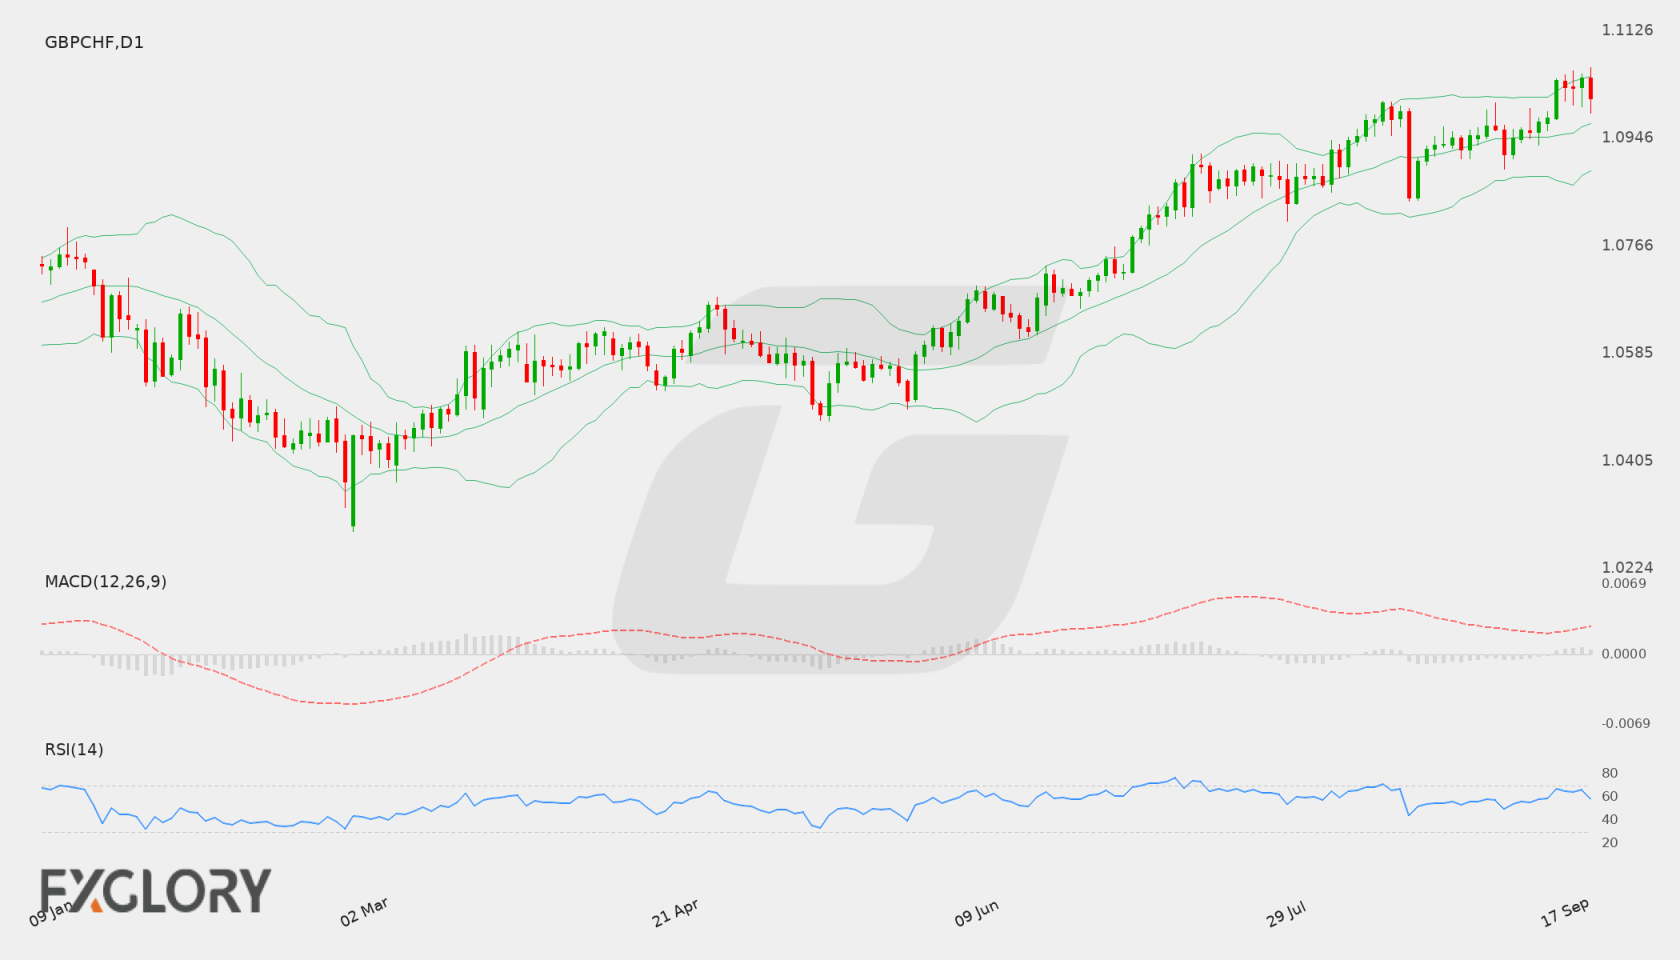
On the Daily (D1) chart, GBP/CHF has demonstrated strong upward movement from recent swing lows, pushing toward a high near 1.10642 before closing at 1.10130. Price action reflects sustained buying pressure over recent sessions, though a mild pullback from the multi-session high indicates minor consolidation below key resistance.
Key Technical Indicators:
Bollinger Bands: The Bollinger Bands on the D1 chart show a middle band at 1.09703, an upper band at 1.10496, and a lower band at 1.08909. With the last close at 1.10130, GBPCHF trades in the upper band channel above the middle band, reflecting heightened bullish volatility and positive price momentum.
RSI: The 14-day Relative Strength Index (RSI) stands at 58.78. Situated above the neutral 50 level, the reading points to steady bullish momentum while remaining comfortably below overbought territory.
MACD: The MACD indicator reports a positive value of 0.003197 on the Daily chart. This positive configuration signals an active bullish bias, suggesting ongoing upward momentum in the short term.
Support and Resistance:
Key technical levels for GBP/CHF on the Daily timeframe include resistance at 1.10642 and support at 1.06600. The pair’s recent close of 1.10130 places price action within proximity of the resistance barrier.
News to Watch for GBPCHF This Week:
- CPI m/m: This inflation release offers insight into consumer price trends in Switzerland and can impact Swiss National Bank policy expectations.
Weekly Outlook and Consideration:
The weekly outlook for GBP/CHF remains constructively bullish based on D1 technical indicators. Price trades above the daily middle Bollinger Band of 1.09703 with the RSI at 58.78 and a positive MACD value of 0.003197. A sustained push past resistance at 1.10642 could open space for further gains, whereas a rejection near resistance may trigger a retest of lower support levels around 1.09703 or lower support at 1.06600.
Disclaimer: The analysis provided for GBP/CHF is for informational purposes only and does not constitute investment advice. Traders are encouraged to perform their own analysis and research before making any trading decisions. Market conditions can change quickly, so staying informed with the latest data is essential.