Current weekly forecast: This outlook covers 11–17 October 2026 and remains valid until 17 October 2026, unless its stated invalidation condition is triggered earlier.
Daily check — 12 October 2026: GBP/CHF is at 1.09997 as of 12 Oct 2026 12:00 GMT+3. The latest completed D1 close was 1.09854 on 9 October 2026. It remains above the lower formal invalidation level 1.09341; the upper calibrated boundary 1.10828 is an extension/confirmation boundary. The authored weekly thesis remains valid.
In brief
GBP/CHF has a bullish weekly bias, although neutral momentum and bearish H4 pressure make continuation conditional rather than immediate.
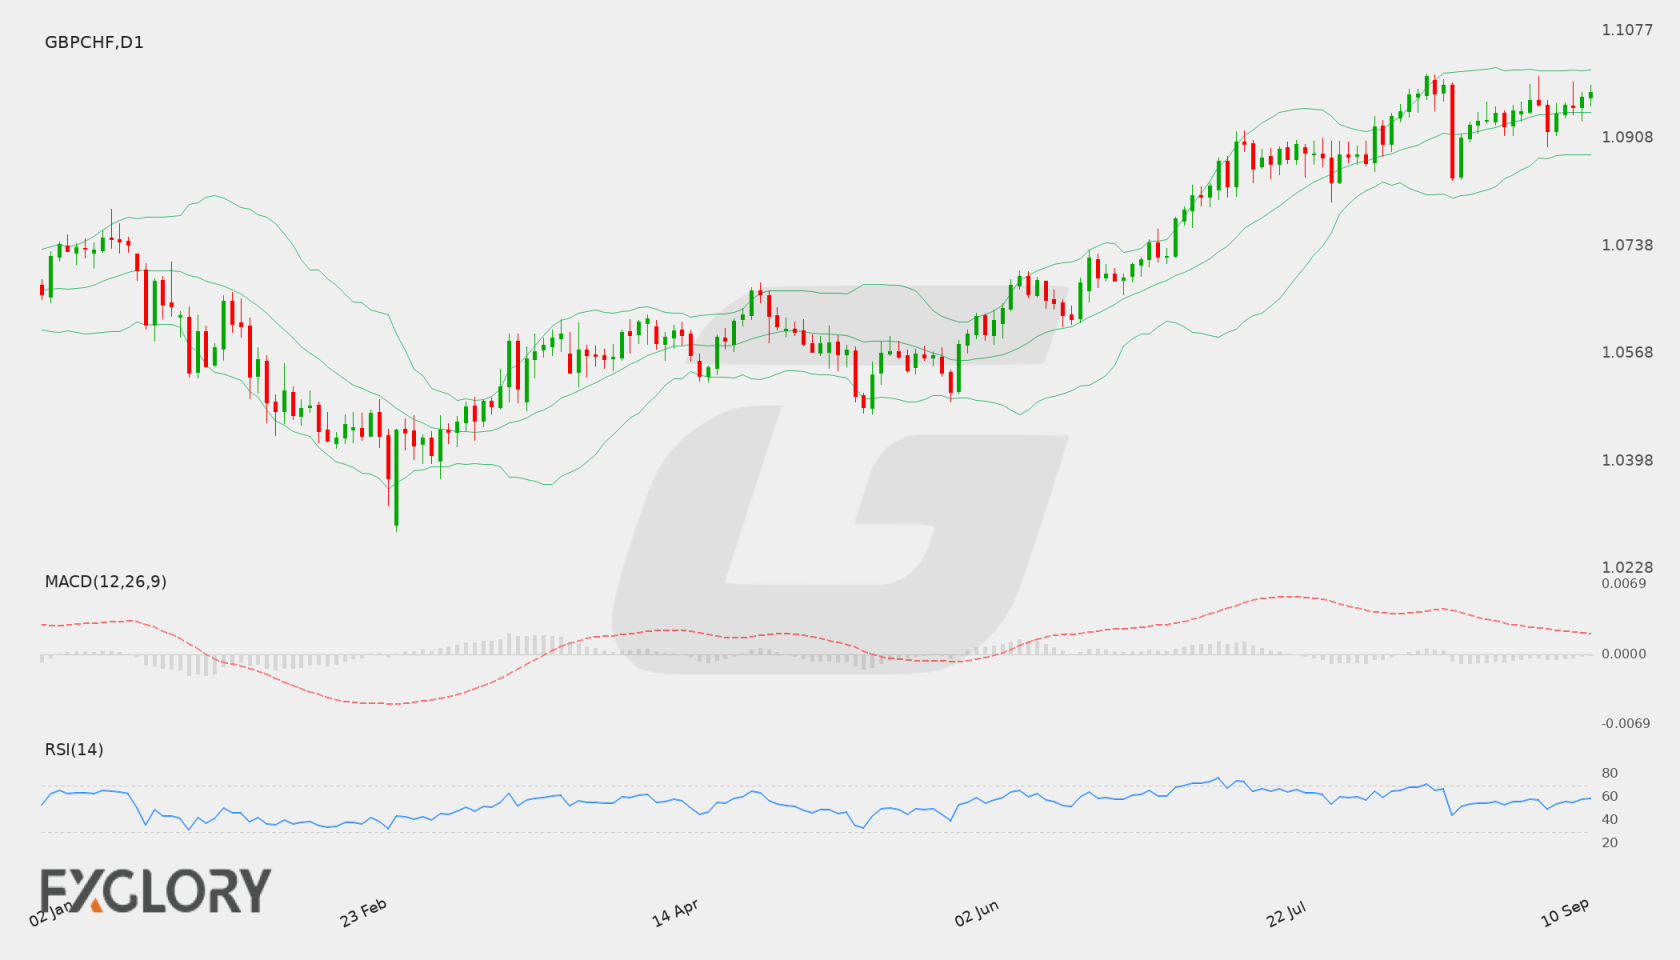
The D1 trend remains bullish, with the reference close at 1.09995 above the EMA20 at 1.09931, EMA50 at 1.09499 and SMA200 at 1.07055. Rising EMA50 and SMA200 slopes add structural support, but the mixed close sequence means the trend is not progressing in a uniformly directional manner.
Momentum is neutral rather than strongly confirming the D1 trend, while H4 is bearish and its close at 1.09794 sits below the H4 EMA20 at 1.1 and EMA50 at 1.10007. That tactical pressure can delay or complicate a move toward 1.10442 and 1.10828; a move through the support framework would instead raise attention toward 1.09206 and 1.08874.
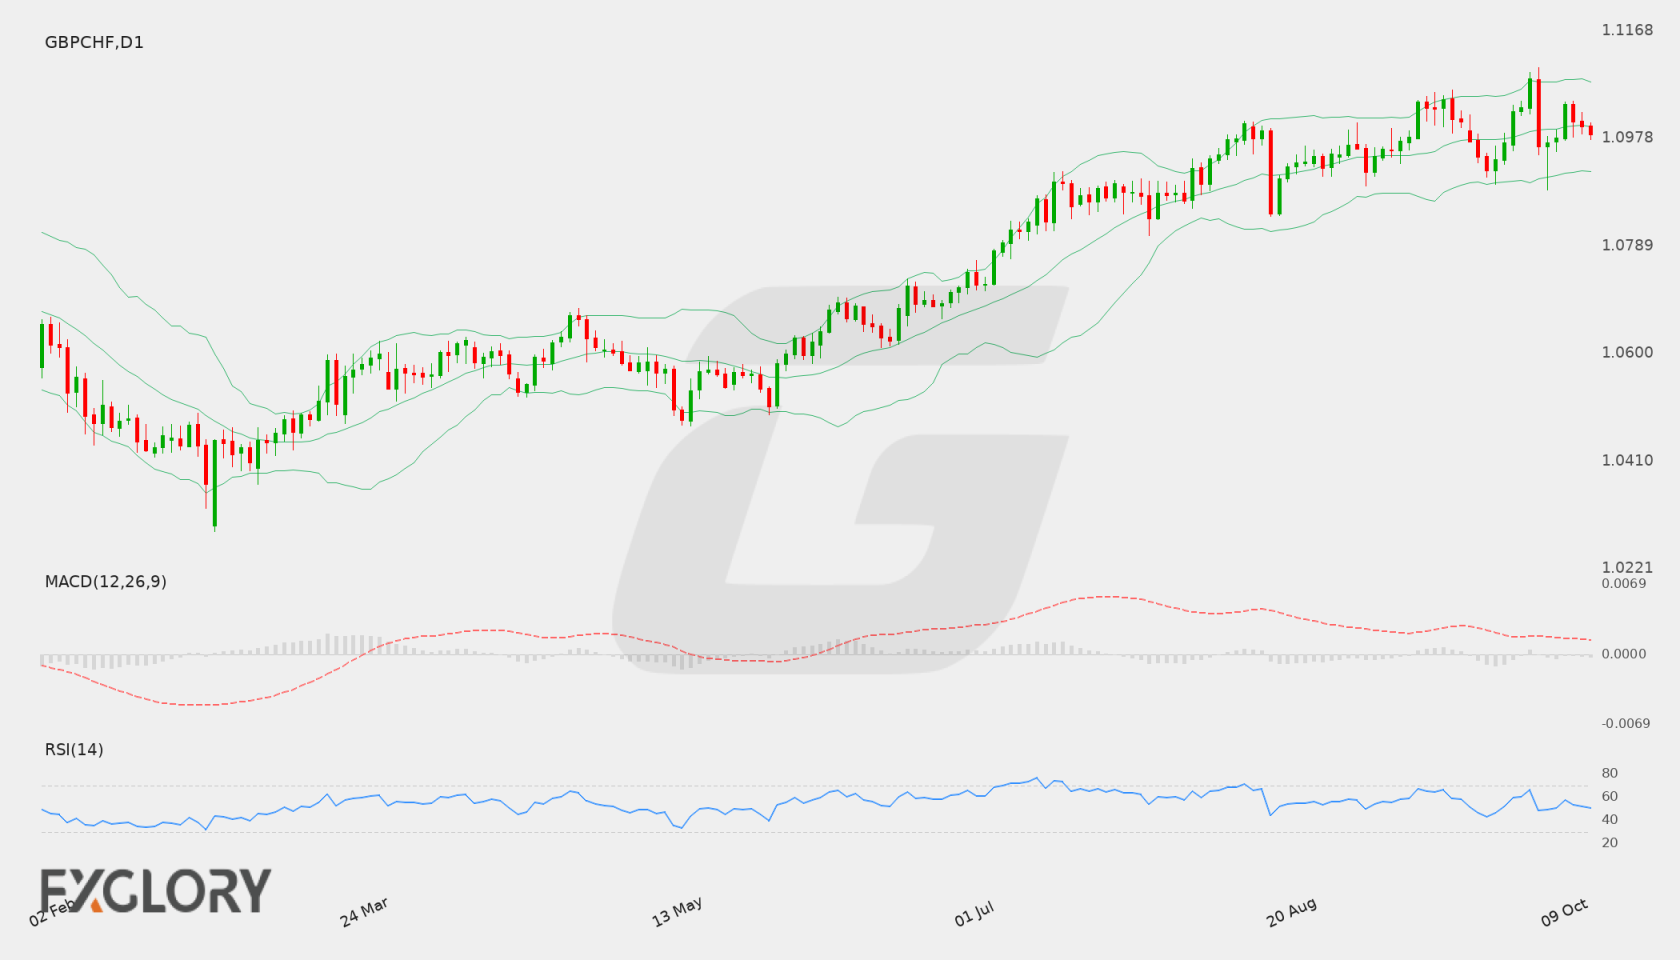
GBP/CHF D1 technical-analysis context for the weekly forecast. Chart data captured 12 October 2026.
The fundamental backdrop for GBP/CHF remains centered around upcoming UK economic releases and broader market risk dynamics. Traders are monitoring economic data closely to gauge the trajectory of the British pound, while the Swiss franc continues to be sensitive to global sentiment shifts. With major economic indicators on the schedule, sterling’s performance will likely hinge on incoming activity and labor data.
Price Action:
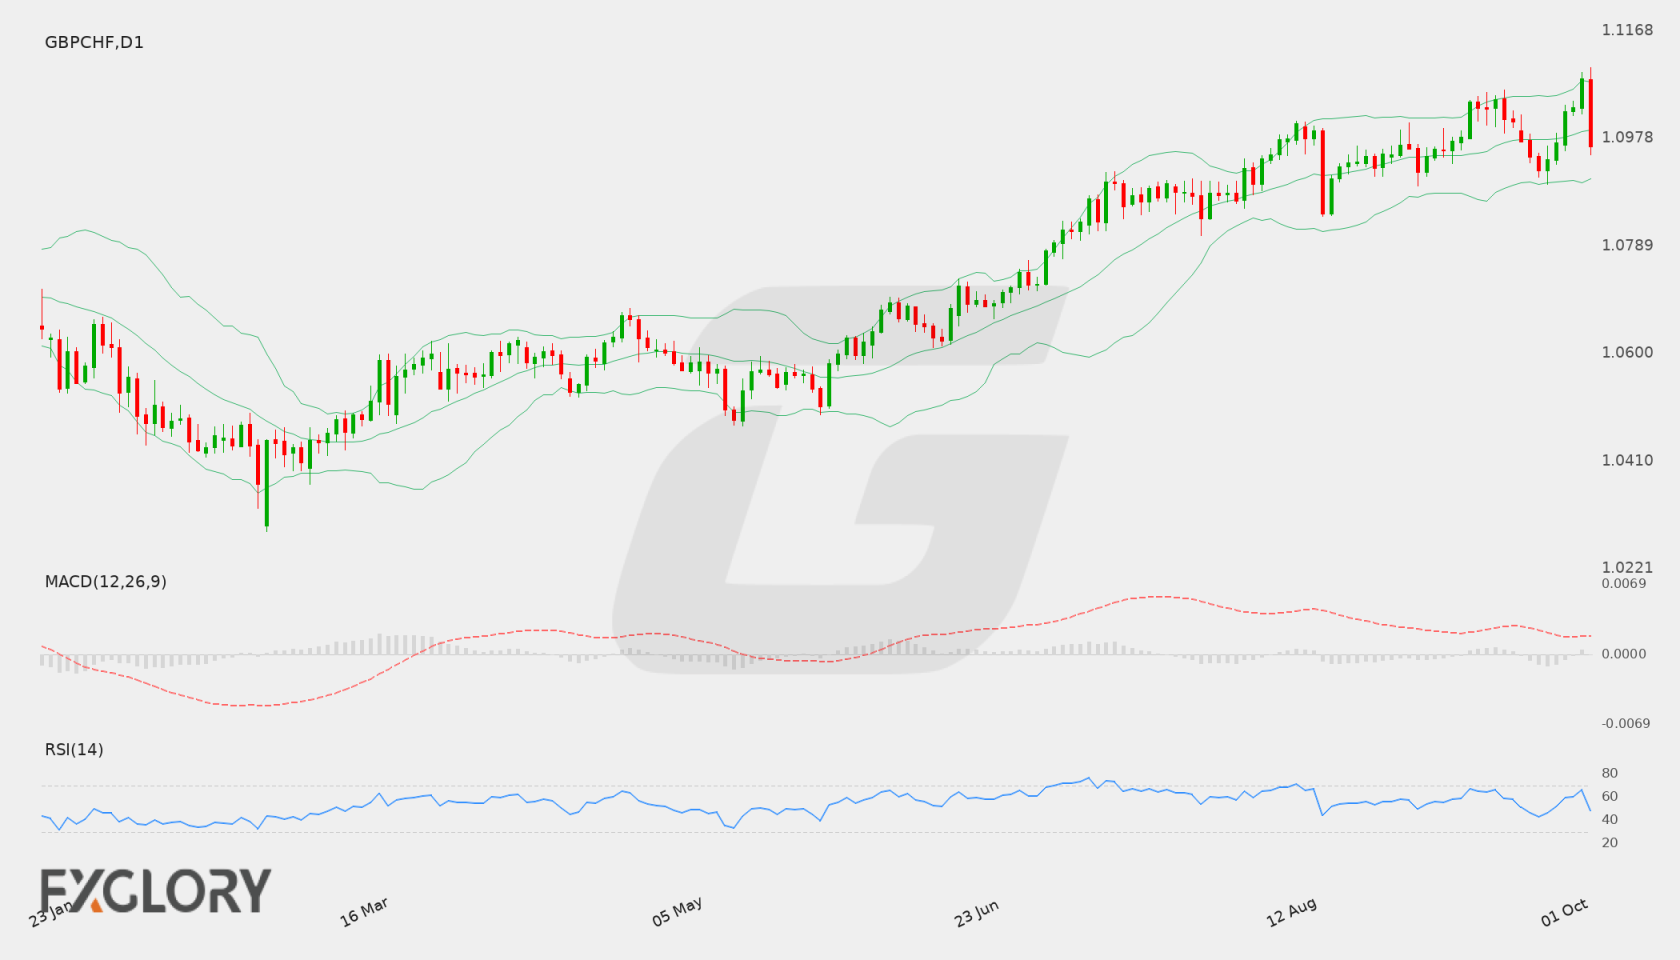
GBP/CHF experienced a notable pullback toward the close of the recent daily session, retreating from a high of 1.11025 down to a closing level of 1.09645. This sharp daily decline followed a rally toward the upper boundaries of recent trading, indicating that selling pressure emerged at higher price levels. Current daily candles reflect consolidation as the pair attempts to stabilize above recent daily lows.
Key Technical Indicators:
Bollinger Bands: On the daily chart, GBP/CHF is trading between the middle and lower Bollinger Bands, with the last close at 1.09645 positioned below the middle band of 1.09927. The upper band is located at 1.10781, while the lower band stands at 1.09072, establishing the current dynamic range for volatility and potential trend continuation.
RSI: The 14-period Daily RSI for GBP/CHF is registered at 48.30, holding in neutral territory just below the midpoint line of 50. This reading indicates a balanced momentum environment without overbought or oversold extremes, leaving room for price movement in either direction.
MACD: The daily MACD indicator for GBPCHF currently reads at 0.00172, remaining slightly above the zero mark. Although this indicates that broader positive momentum is still technically present, the relatively low absolute value highlights muted momentum that could easily flatten if bearish pressure persists.
Support and Resistance:
The primary daily technical levels for GBPCHF show immediate resistance defined at 1.11025, which capped the latest upward attempt. On the downside, primary daily support is identified at 1.07992, serving as a critical floor for price stability should selling momentum resume.
News to Watch for GBPCHF This Week:
Claimant Count Change: Changes in unemployment claim figures can alter monetary policy expectations and prompt volatility in the British pound.
GDP m/m: Monthly gross domestic product data reveals the pace of economic expansion and directly affects sterling valuation.
Average Earnings Index 3m/y: Growth in wage levels offers critical clues regarding domestic inflationary pressures.
Weekly Outlook and Consideration:
The weekly outlook for GBP/CHF leans neutral to cautious following the retreat from the daily resistance zone at 1.11025 down to the last close of 1.09645. Price remains contained within the daily Bollinger Bands bounded by 1.09072 on the downside and 1.10781 on the upside, while the RSI at 48.30 confirms the absence of an immediate directional bias. If the pair remains below the middle band of 1.09927, technical pressure may steer action toward key support at 1.07992. Conversely, a sustained break above 1.10781 and the 1.11025 resistance would be necessary to restore an upward trajectory, with upcoming UK economic data likely to serve as the primary catalyst.
Disclaimer: The analysis provided for GBP/CHF is for informational purposes only and does not constitute investment advice. Traders are encouraged to perform their own analysis and research before making any trading decisions. Market conditions can change quickly, so staying informed with the latest data is essential.
GBP/CHF price dynamics continue to be influenced by macroeconomic conditions and risk sentiment surrounding the British Pound and the Swiss Franc. In the absence of scheduled economic calendar data, market participants remain focused on broader economic expectations and sentiment shifts.
Price Action:
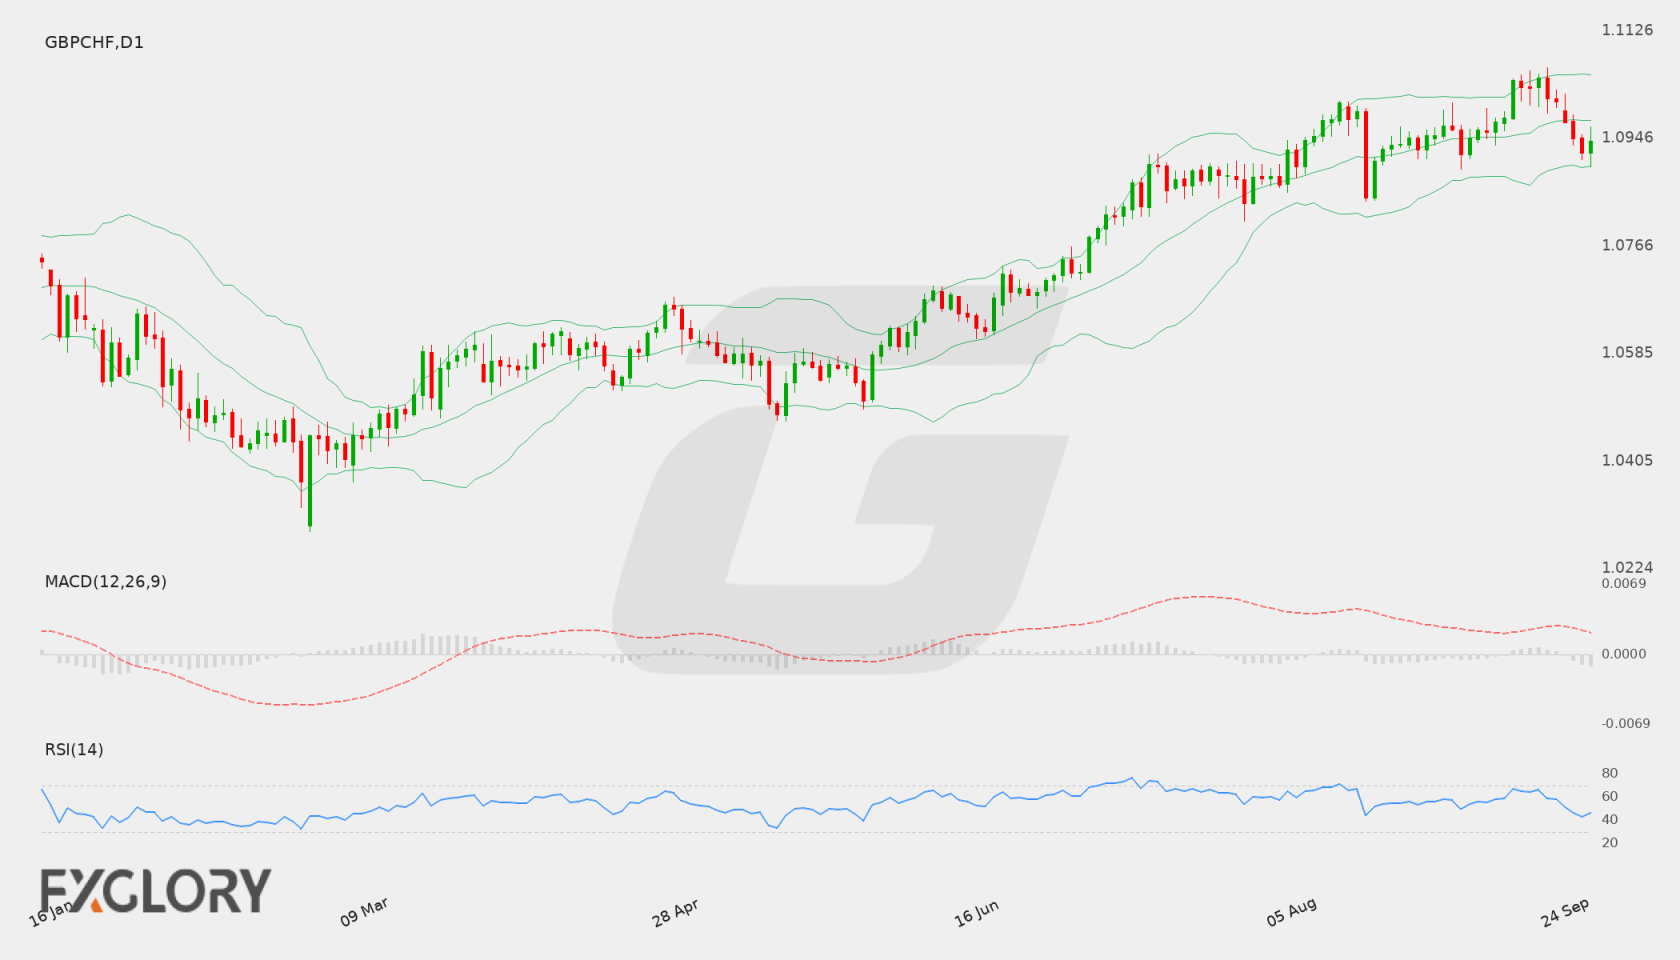
The Daily (D1) chart shows GBP/CHF retreating from recent high levels near the 1.1064 resistance region. After pressing above 1.1040, the pair experienced a mild pullback, eventually closing at 1.0941 to reflect short-term consolidation within its broader range.
Key Technical Indicators:
Bollinger Bands: The Bollinger Bands on the D1 timeframe show a middle simple moving average at 1.0976, an upper band at 1.1053, and a lower band at 1.0900. With the recent close at 1.0941, price action is currently fluctuating beneath the middle band, signaling neutral to slight downside pressure toward the lower band.
RSI: The 14-period Relative Strength Index (RSI) stands at 46.27, placing it in neutral territory below the 50 centerline. This reading indicates a balanced market environment without oversold or overbought extremes.
MACD: The MACD indicator registers a reading of 0.00095, holding slightly above the zero line. This indicates that underlying bullish momentum from prior advances persists, although the recent price dip points to easing upward momentum.
Support and Resistance:
Key technical parameters on the daily chart highlight substantial resistance at 1.10642 and primary structural support at 1.07094.
News to Watch for GBPCHF This Week:
Economic Calendar: No specific events are available for this period, so traders should monitor generic high-impact releases, central bank comments, and broader risk sentiment.
Weekly Outlook and Consideration:
The weekly technical outlook for GBP/CHF indicates a neutral trading environment following the pullback to 1.0941. With the RSI at 46.27 and MACD at 0.00095, the pair displays mixed technical signals. A potential recovery above the 20-day middle Bollinger Band at 1.0976 could pave the way toward testing resistance at 1.10642. Alternatively, if selling pressure holds price below 1.0976, the lower Bollinger Band around 1.0900 and main support at 1.07094 remain key downside levels to watch.
Disclaimer: The analysis provided for GBP/CHF is for informational purposes only and does not constitute investment advice. Traders are encouraged to perform their own analysis and research before making any trading decisions. Market conditions can change quickly, so staying informed with the latest data is essential.
The GBP/CHF currency pair reflects broader macroeconomic trends and market risk sentiment affecting the British pound and Swiss franc. Traders monitor central bank guidance and key economic updates to evaluate the relative strength between the two currencies. Broader market risk dynamics and upcoming economic releases continue to shape trading conditions for GBPCHF.
Price Action:
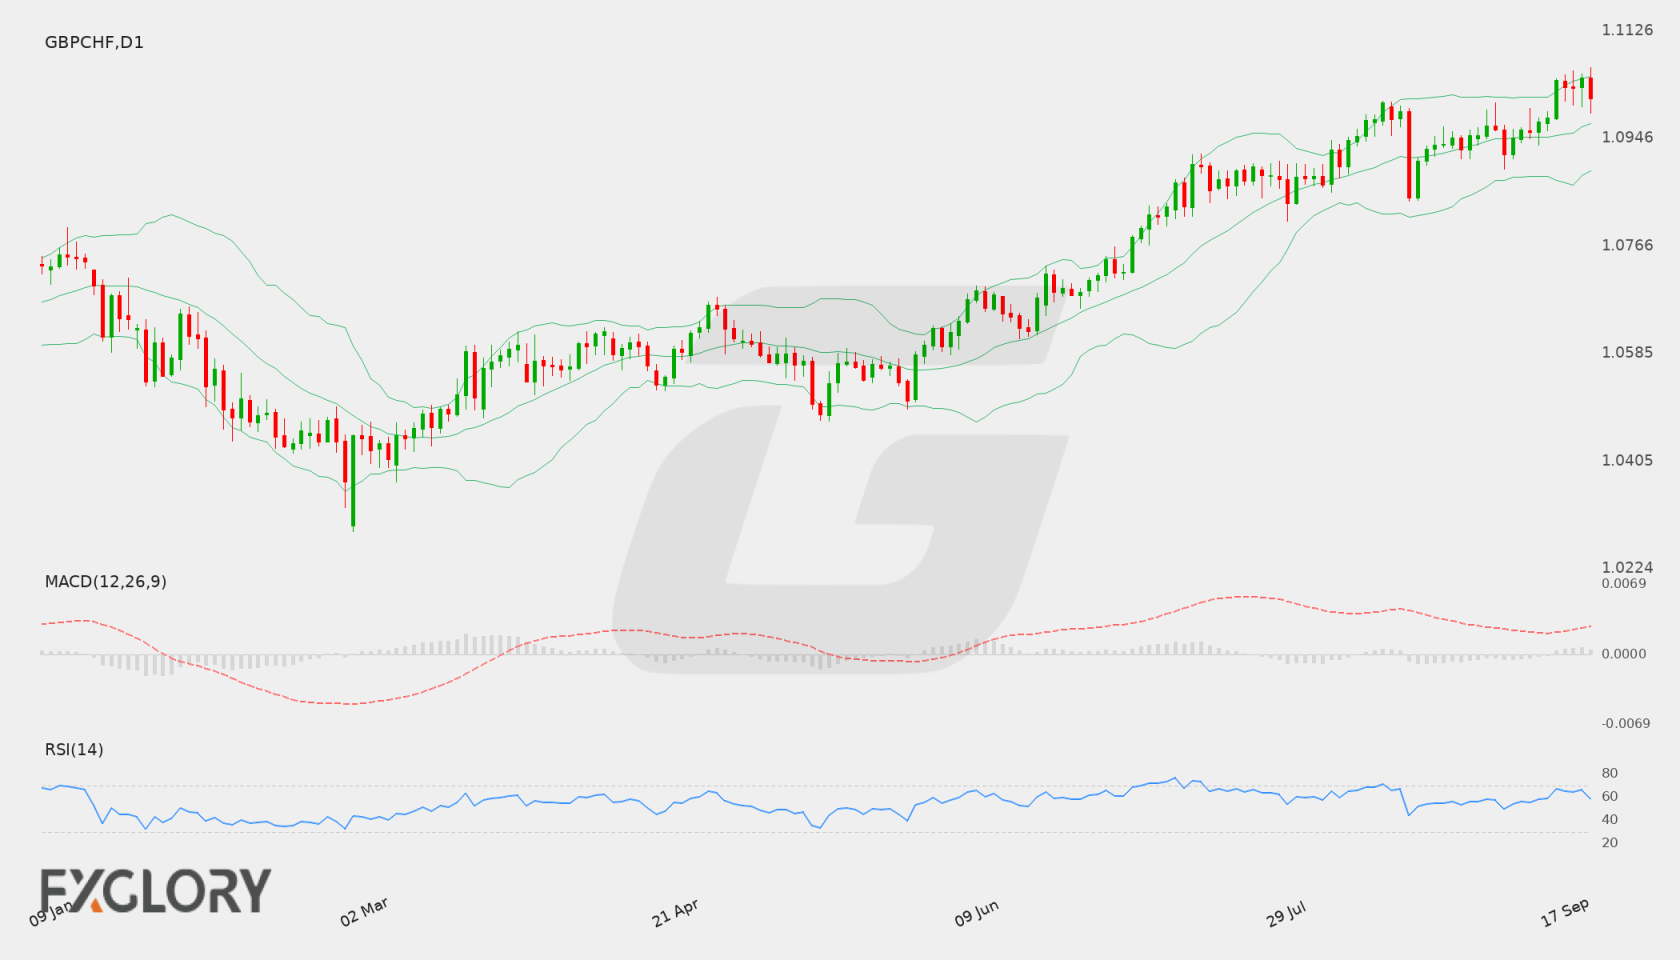
On the Daily (D1) chart, GBP/CHF has demonstrated strong upward movement from recent swing lows, pushing toward a high near 1.10642 before closing at 1.10130. Price action reflects sustained buying pressure over recent sessions, though a mild pullback from the multi-session high indicates minor consolidation below key resistance.
Key Technical Indicators:
Bollinger Bands: The Bollinger Bands on the D1 chart show a middle band at 1.09703, an upper band at 1.10496, and a lower band at 1.08909. With the last close at 1.10130, GBPCHF trades in the upper band channel above the middle band, reflecting heightened bullish volatility and positive price momentum.
RSI: The 14-day Relative Strength Index (RSI) stands at 58.78. Situated above the neutral 50 level, the reading points to steady bullish momentum while remaining comfortably below overbought territory.
MACD: The MACD indicator reports a positive value of 0.003197 on the Daily chart. This positive configuration signals an active bullish bias, suggesting ongoing upward momentum in the short term.
Support and Resistance:
Key technical levels for GBP/CHF on the Daily timeframe include resistance at 1.10642 and support at 1.06600. The pair’s recent close of 1.10130 places price action within proximity of the resistance barrier.
News to Watch for GBPCHF This Week:
CPI m/m: This inflation release offers insight into consumer price trends in Switzerland and can impact Swiss National Bank policy expectations.
Weekly Outlook and Consideration:
The weekly outlook for GBP/CHF remains constructively bullish based on D1 technical indicators. Price trades above the daily middle Bollinger Band of 1.09703 with the RSI at 58.78 and a positive MACD value of 0.003197. A sustained push past resistance at 1.10642 could open space for further gains, whereas a rejection near resistance may trigger a retest of lower support levels around 1.09703 or lower support at 1.06600.
Disclaimer: The analysis provided for GBP/CHF is for informational purposes only and does not constitute investment advice. Traders are encouraged to perform their own analysis and research before making any trading decisions. Market conditions can change quickly, so staying informed with the latest data is essential.
The GBP/CHF pair enters the week with attention focused on major economic releases from both the United Kingdom and Switzerland. Key inflation, labor market, and central bank interest rate decisions from the UK, along with producer price index data from Switzerland, are expected to influence sentiment surrounding the British Pound and Swiss Franc. Market participants will monitor monetary policy guidance to assess potential trends.
Price Action:
On the daily (D1) chart, GBP/CHF has demonstrated an upward trajectory over recent sessions, moving from lower levels near 1.0500 up toward recent session highs near 1.09910. The pair closed the latest D1 period at 1.09798, continuing to trade in proximity to recent local highs.
Key Technical Indicators:
Bollinger Bands: The Bollinger Bands indicator shows a middle band at 1.094839, an upper band at 1.101519, and a lower band at 1.088159. The latest close of 1.09798 places price action above the middle baseline and within the upper region of the band structure, indicating sustained buying pressure.
RSI: The 14-period Relative Strength Index (RSI) stands at 58.81, reflecting moderate bullish momentum while remaining below overbought thresholds.
MACD: The MACD indicator registers a positive value of 0.001959, reflecting a bullish momentum bias on the daily timeframe as the histogram remains in positive territory.
Support and Resistance:
Key technical reference points on the daily timeframe show established support at 1.06156 and overhead resistance at 1.10089.
News to Watch for GBPCHF This Week:
PPI m/m: Reflects producer price trends in Switzerland that may influence Swiss Franc demand.
Claimant Count Change: Measures changes in UK unemployment claims to indicate labor market strength.
Average Earnings Index 3m/y: Tracks wage growth in the United Kingdom to evaluate underlying inflation pressures.
CPI y/y: Provides essential consumer price inflation figures for the UK economy.
Official Bank Rate: Details the primary interest rate decision determined by the Bank of England.
MPC Official Bank Rate Votes: Reveals the vote breakdown among Bank of England monetary policy members.
Monetary Policy Summary: Explains economic perspectives and future policy stance from the Bank of England.
Retail Sales m/m: Measures UK consumer spending activity to gauge retail sector health.
Weekly Outlook and Consideration:
GBP/CHF shows moderate bullish strength on the D1 chart, with the latest close at 1.09798 situated above the middle Bollinger Band of 1.094839 and approaching major resistance at 1.10089. With MACD at 0.001959 and RSI at 58.81, technical indicators suggest sustained upward momentum. Traders will monitor whether price action can test the upper Bollinger Band at 1.101519 or pull back toward support at 1.06156 amid upcoming UK monetary policy and Swiss economic data releases.
Disclaimer: The analysis provided for GBP/CHF is for informational purposes only and does not constitute investment advice. Traders are encouraged to perform their own analysis and research before making any trading decisions. Market conditions can change quickly, so staying informed with the latest data is essential.