Current weekly forecast: This outlook covers 11–17 October 2026 and remains valid until 17 October 2026, unless its stated invalidation condition is triggered earlier.
Daily check — 12 October 2026: GBP/AUD is at 1.89751 as of 12 Oct 2026 11:55 GMT+3. The latest completed D1 close was 1.89475 on 9 October 2026. It remains between the formal invalidation levels 1.88856 and 1.91079. The authored weekly thesis remains valid.
In brief
GBP/AUD has a neutral weekly outlook as positive D1 momentum is offset by mixed structure and bearish H4 pressure.
The daily framework is balanced around the 1.90095 reference close. Price is above the primary support at 1.89526 and below the primary resistance at 1.909, while the mixed D1 close sequence limits the strength of either directional interpretation. Positive momentum and a rising EMA50 slope provide constructive evidence, but the falling SMA200 slope and the nearby moving-average structure keep the broader picture conditional.
H4 pressure complicates the daily backdrop: its bearish tactical state, negative MACD configuration and RSI at 42.49 place short-term emphasis on the H4 support at 1.89496 and resistance at 1.89769. That pressure can influence the path through the weekly range, but it does not replace the neutral D1 thesis. Stable volatility suggests that level interaction may remain orderly unless scheduled GBP events produce repricing.
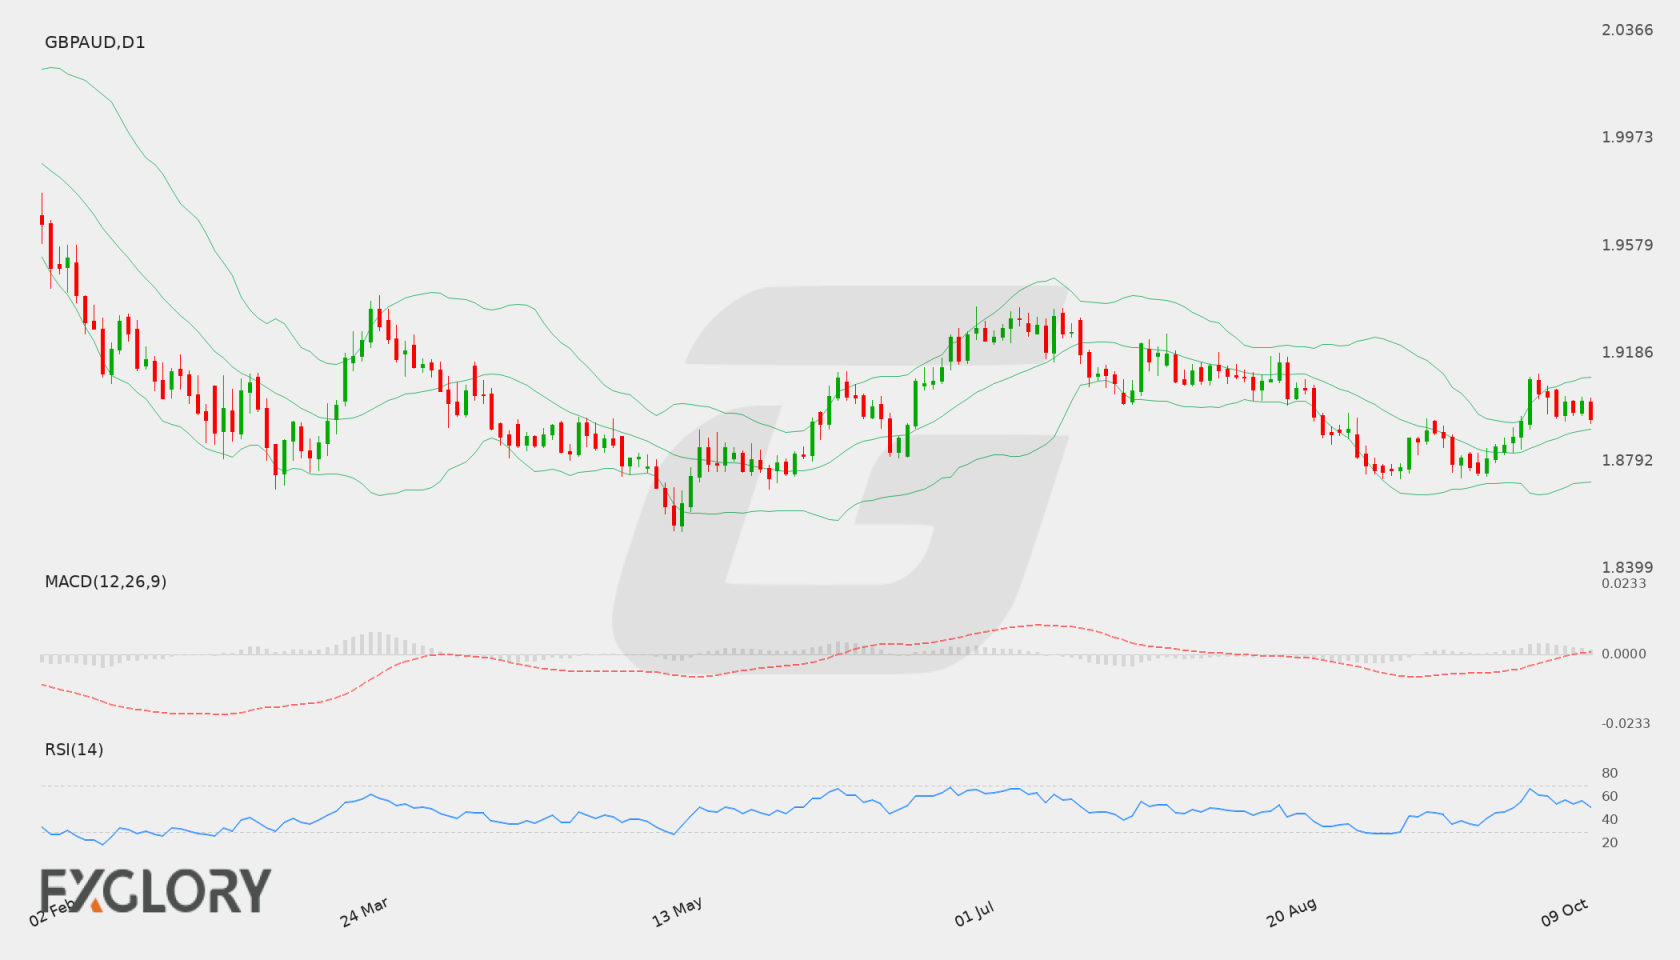
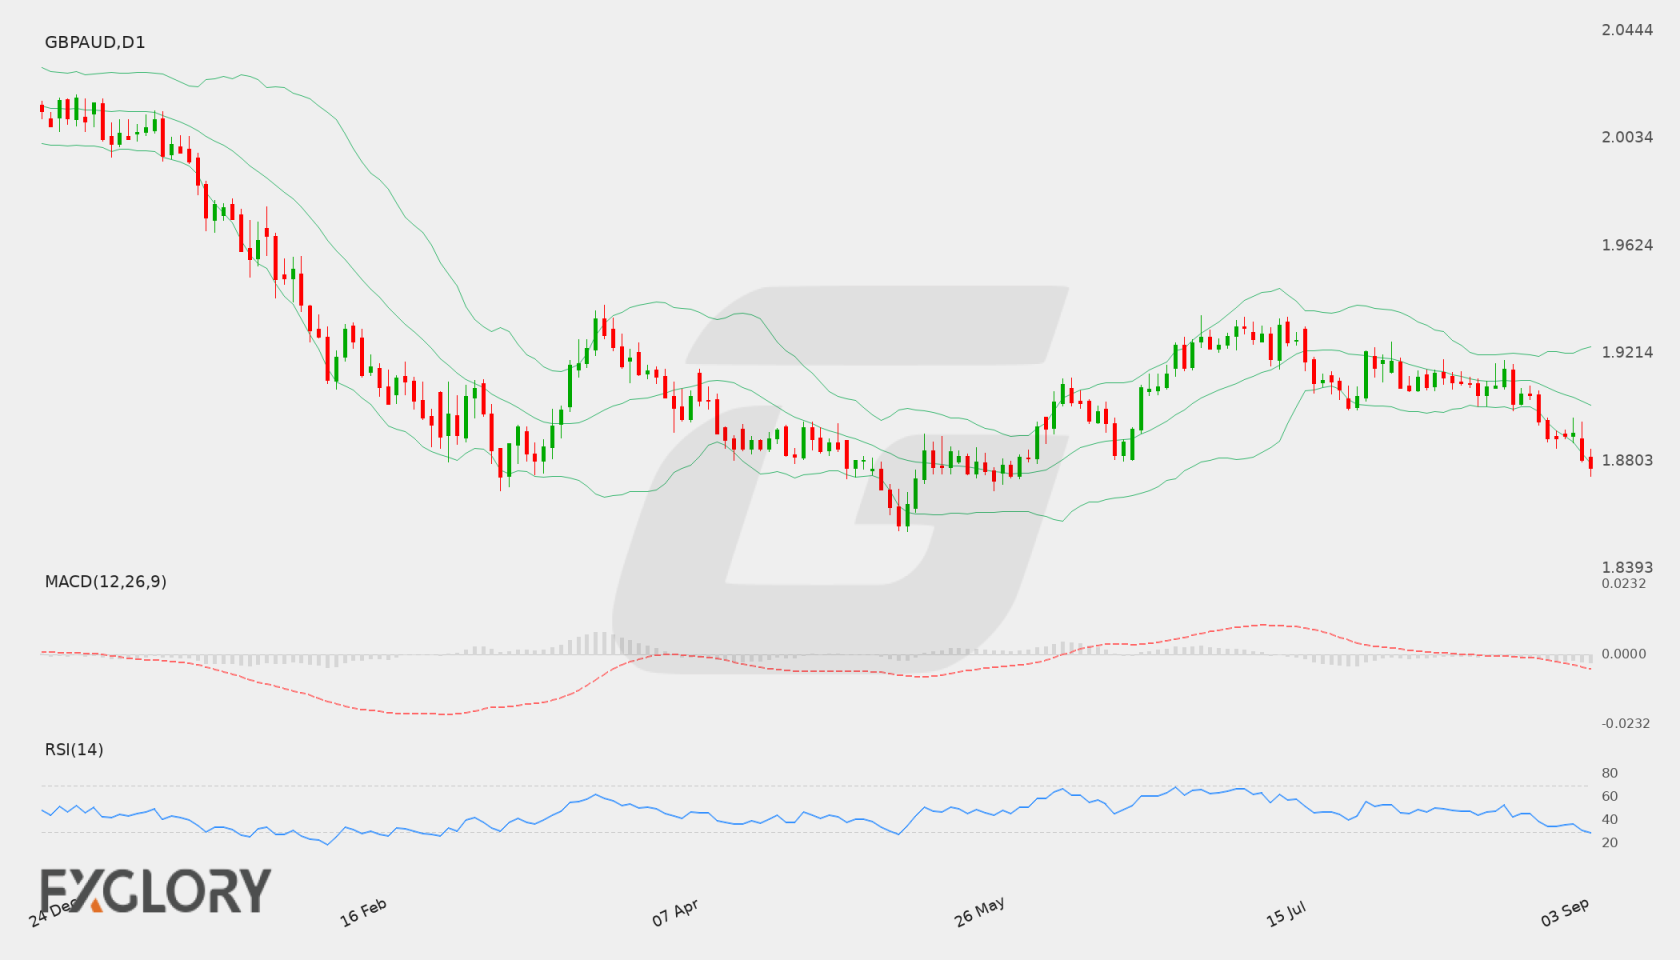
GBP/AUD D1 technical-analysis context for the weekly forecast. Chart data captured 12 October 2026.
The fundamental outlook for GBP/AUD is influenced by scheduled macroeconomic developments from both Australia and the United Kingdom. With upcoming updates covering employment metrics from both regions alongside UK growth and wage indicators, market participants are monitoring potential shifts in economic momentum and monetary policy expectations.
Price Action:
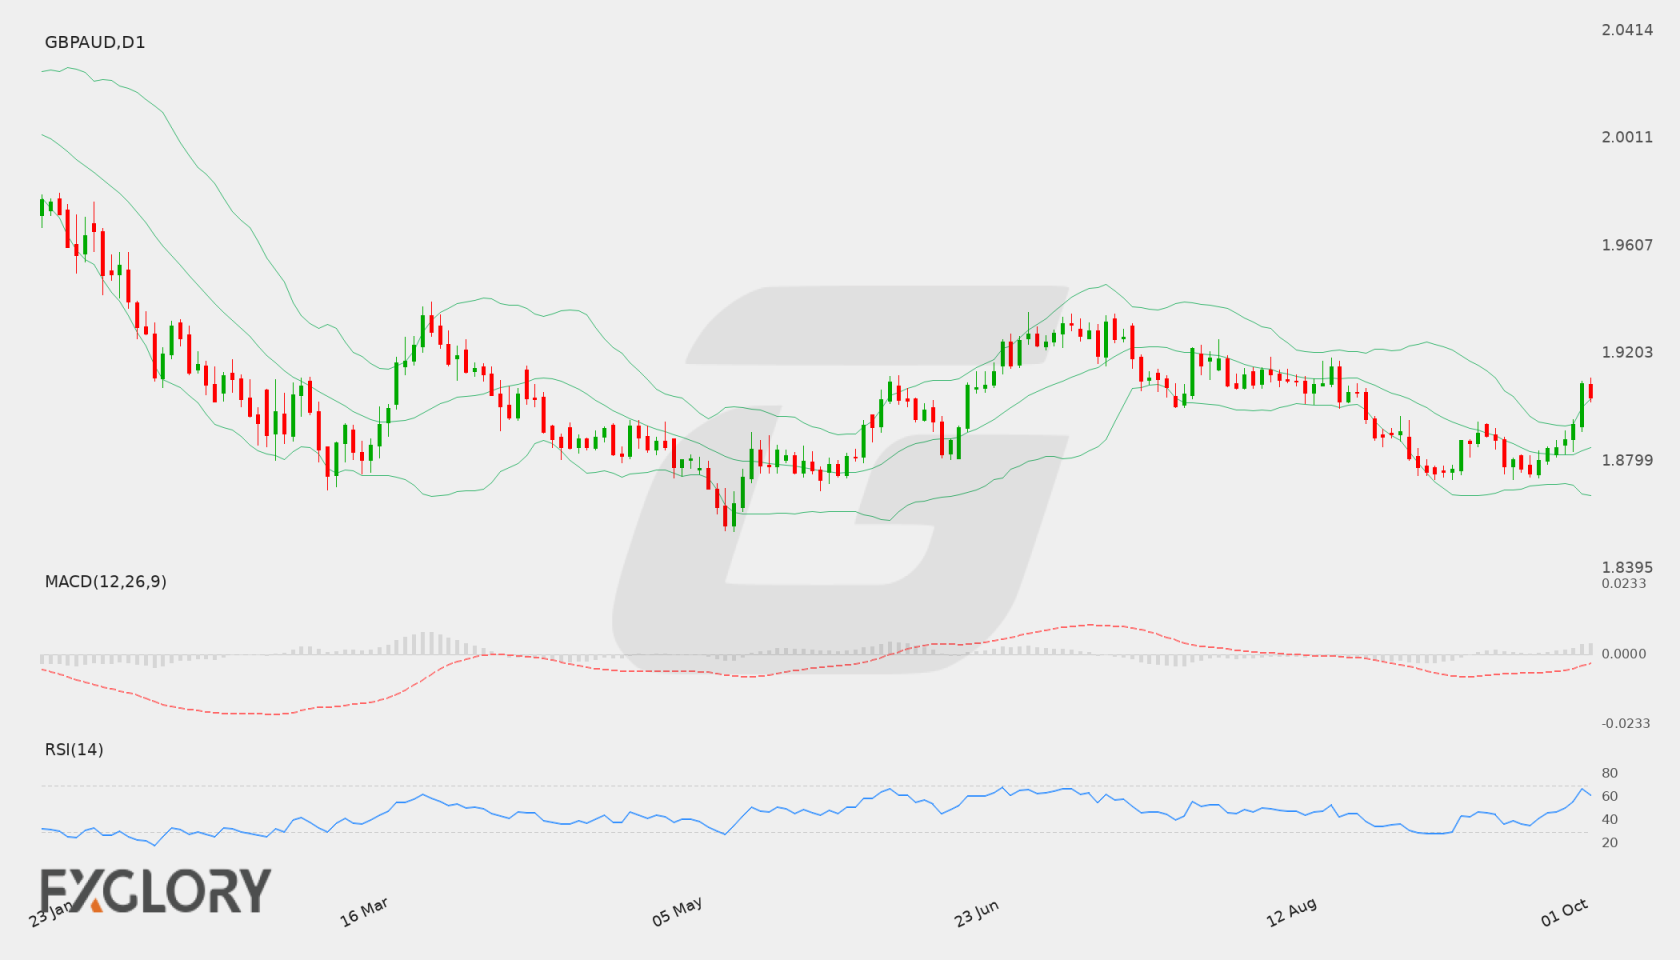
On the daily chart, GBP/AUD has advanced from recent consolidations near the 1.8800–1.8850 area, pushing to an intraday high of 1.91105 before concluding at a last close of 1.90392. The sequence of higher closes indicates sustained buying interest across recent trading sessions.
Key Technical Indicators:
Bollinger Bands: The daily Bollinger Bands are defined by a middle band at 1.88503, a lower band at 1.86680, and an upper band at 1.90326. The latest close at 1.90392 sits just above the upper band, reflecting an extended upward move relative to the 20-period moving average.
RSI: The 14-period Relative Strength Index (RSI) registers at 61.40, indicating firm upside momentum while remaining comfortably below the overbought threshold.
MACD: The MACD indicator is slightly positive at 0.000627, holding above the zero threshold to signal constructive underlying momentum on the daily timeframe.
Support and Resistance:
Identified technical boundaries for GBP/AUD place primary support at 1.87275 and key resistance at 1.93502, framing the broader daily trading range.
News to Watch for GBPAUD This Week:
Unemployment Rate: Australian unemployment figures indicate labor market tightness and can sway domestic currency valuation.
Employment Change: The net shift in Australian employment offers insight into economic vitality and domestic growth.
Claimant Count Change: Jobless claim figures in the United Kingdom reflect domestic employment conditions and sentiment toward the pound.
GDP m/m: Monthly gross domestic product data provides a benchmark for UK economic expansion or contraction.
Average Earnings Index 3m/y: British wage growth readings indicate wage-driven inflationary trends affecting interest rate projections.
Weekly Outlook and Consideration:
GBP/AUD enters the upcoming sessions with a bullish posture on the daily chart, underpinned by a close of 1.90392 above the Bollinger middle band of 1.88503, an RSI of 61.40, and a positive MACD of 0.000627. If the pair maintains traction above the upper Bollinger boundary, price action may attempt further advancement toward resistance at 1.93502. Conversely, any consolidation or pullback would look to find stability above support at 1.87275.
Disclaimer: The analysis provided for GBP/AUD is for informational purposes only and does not constitute investment advice. Traders are encouraged to perform their own analysis and research before making any trading decisions. Market conditions can change quickly, so staying informed with the latest data is essential.
The GBP/AUD pair is influenced by shifting policy expectations between the Bank of England and the Reserve Bank of Australia, alongside broader market risk sentiment. Market participants remain focused on incoming Australian inflation figures and interest rate decisions, which could alter interest rate expectations. Sterling dynamics against commodity-linked currencies like the Australian Dollar reflect ongoing macroeconomic adjustments and risk appetite in global financial markets.
Price Action:
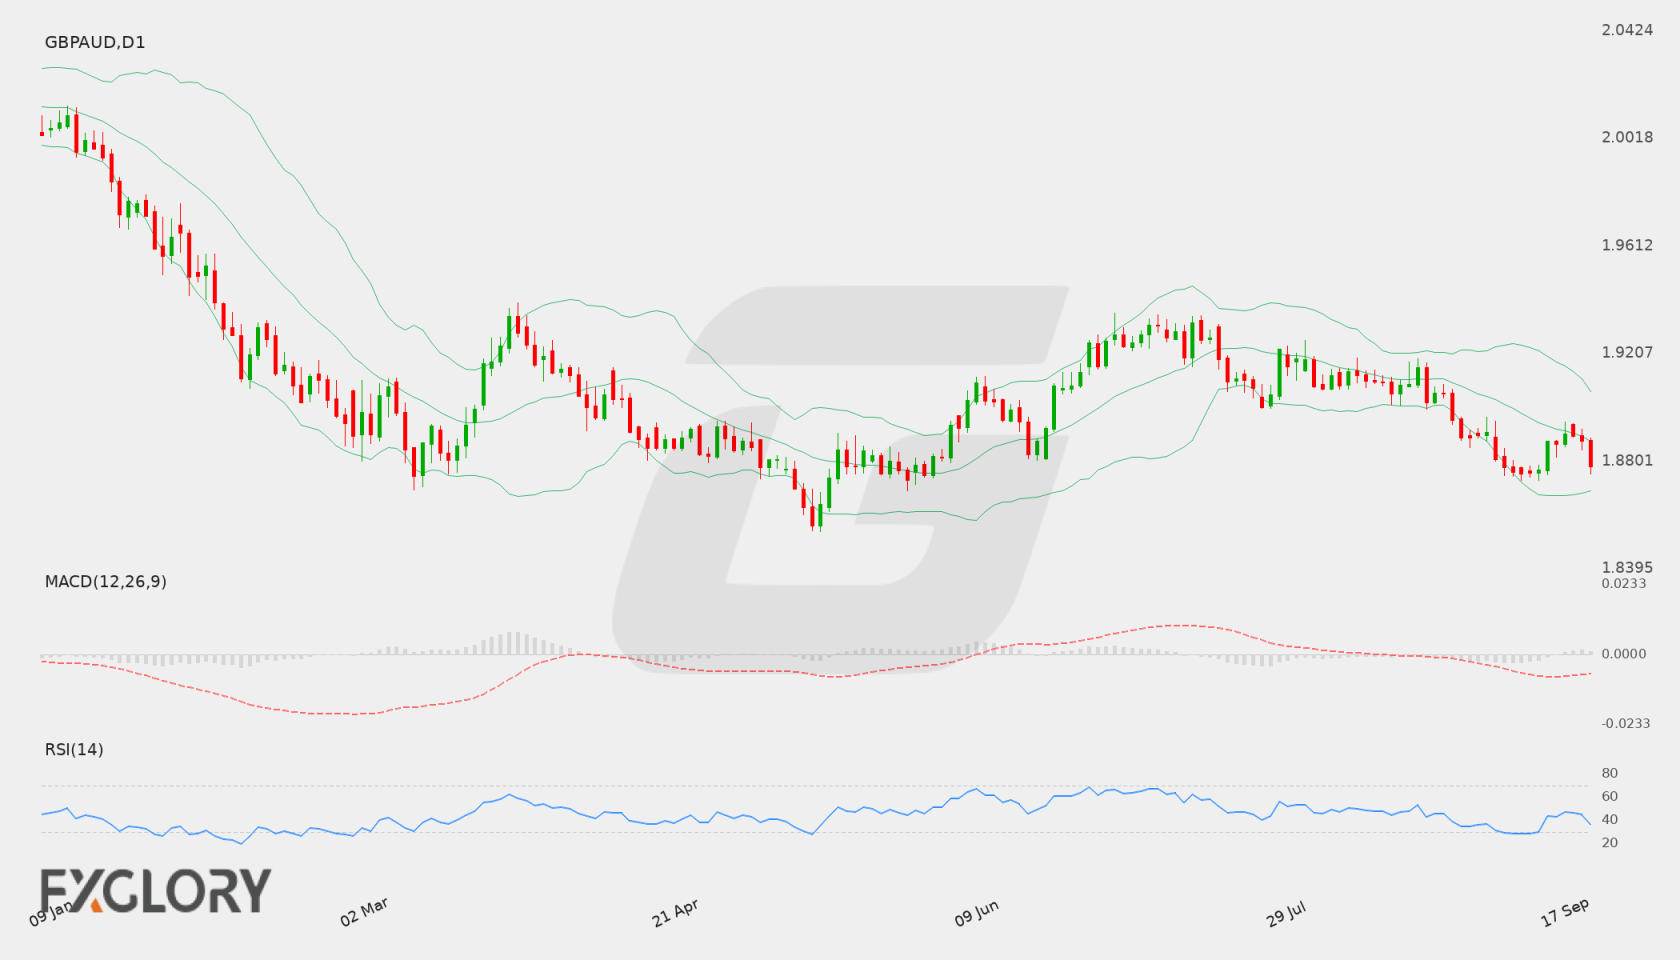
Daily price action for GBP/AUD demonstrates a sustained move lower, with recent trading sessions pushing the pair down from the 1.9000 region toward the latest close at 1.87814. Price movements indicate persistent selling pressure, pushing the exchange rate closer to lower structural boundaries as bears maintain control over short-term trends.
Key Technical Indicators:
Bollinger Bands: The daily Bollinger Bands place the middle band at 1.88752, with the upper band at 1.90615 and lower band at 1.86890. Trading at 1.87814 puts GBP/AUD below its 20-period middle line, suggesting an active downward bias that keeps price moving toward the lower boundary band.
RSI: The 14-day Relative Strength Index (RSI) is currently positioned at 36.53. This value reflects a bearish bias while remaining above the traditional oversold threshold of 30, signaling that sellers currently dominate market sentiment.
MACD: The daily MACD indicator stands at -0.00570, remaining in negative territory. This negative reading indicates that short-term momentum favors sellers over buyers, reflecting ongoing downward momentum on the daily timeframe.
Support and Resistance:
Key technical support for GBP/AUD is defined at 1.87275, with additional lower coverage near the lower Bollinger Band at 1.86890. Primary resistance is situated higher up at 1.93568, while the 1.88752 middle Bollinger Band serves as an immediate overhead resistance level.
News to Watch for GBPAUD This Week:
Cash Rate: Dictates the monetary policy stance of the Reserve Bank of Australia and directly impacts Australian Dollar valuation.
RBA Rate Statement: Provides official guidance regarding economic conditions and future interest rate projections.
RBA Press Conference: Offers detailed commentary from central bank leadership regarding economic outlooks and policy choices.
CPI y/y: Measures annual consumer price changes to gauge underlying inflation trends in the domestic economy.
Trimmed Mean CPI m/m: Tracks core monthly inflation dynamics by stripping out extreme price movements.
CPI m/m: Reflects short-term changes in consumer prices that can influence upcoming monetary policy decisions.
Weekly Outlook and Consideration:
The weekly outlook for GBP/AUD remains tilted toward the downside as technical indicators align below neutral thresholds. With price trading below the 1.88752 middle Bollinger Band, an RSI of 36.53, and a negative MACD of -0.00570, the pair continues to test lower bounds. A sustained move below the 1.87275 support could invite further downside toward 1.86890, while any corrective bounces may encounter overhead resistance near the middle band.
Disclaimer: The analysis provided for GBP/AUD is for informational purposes only and does not constitute investment advice. Traders are encouraged to perform their own analysis and research before making any trading decisions. Market conditions can change quickly, so staying informed with the latest data is essential.
The fundamental backdrop for GBP/AUD revolves around key UK economic releases, including employment indicators, inflation metrics, and the upcoming central bank rate decision. Market participants will evaluate these figures alongside global risk appetite to gauge directional momentum for the pair.
Price Action:
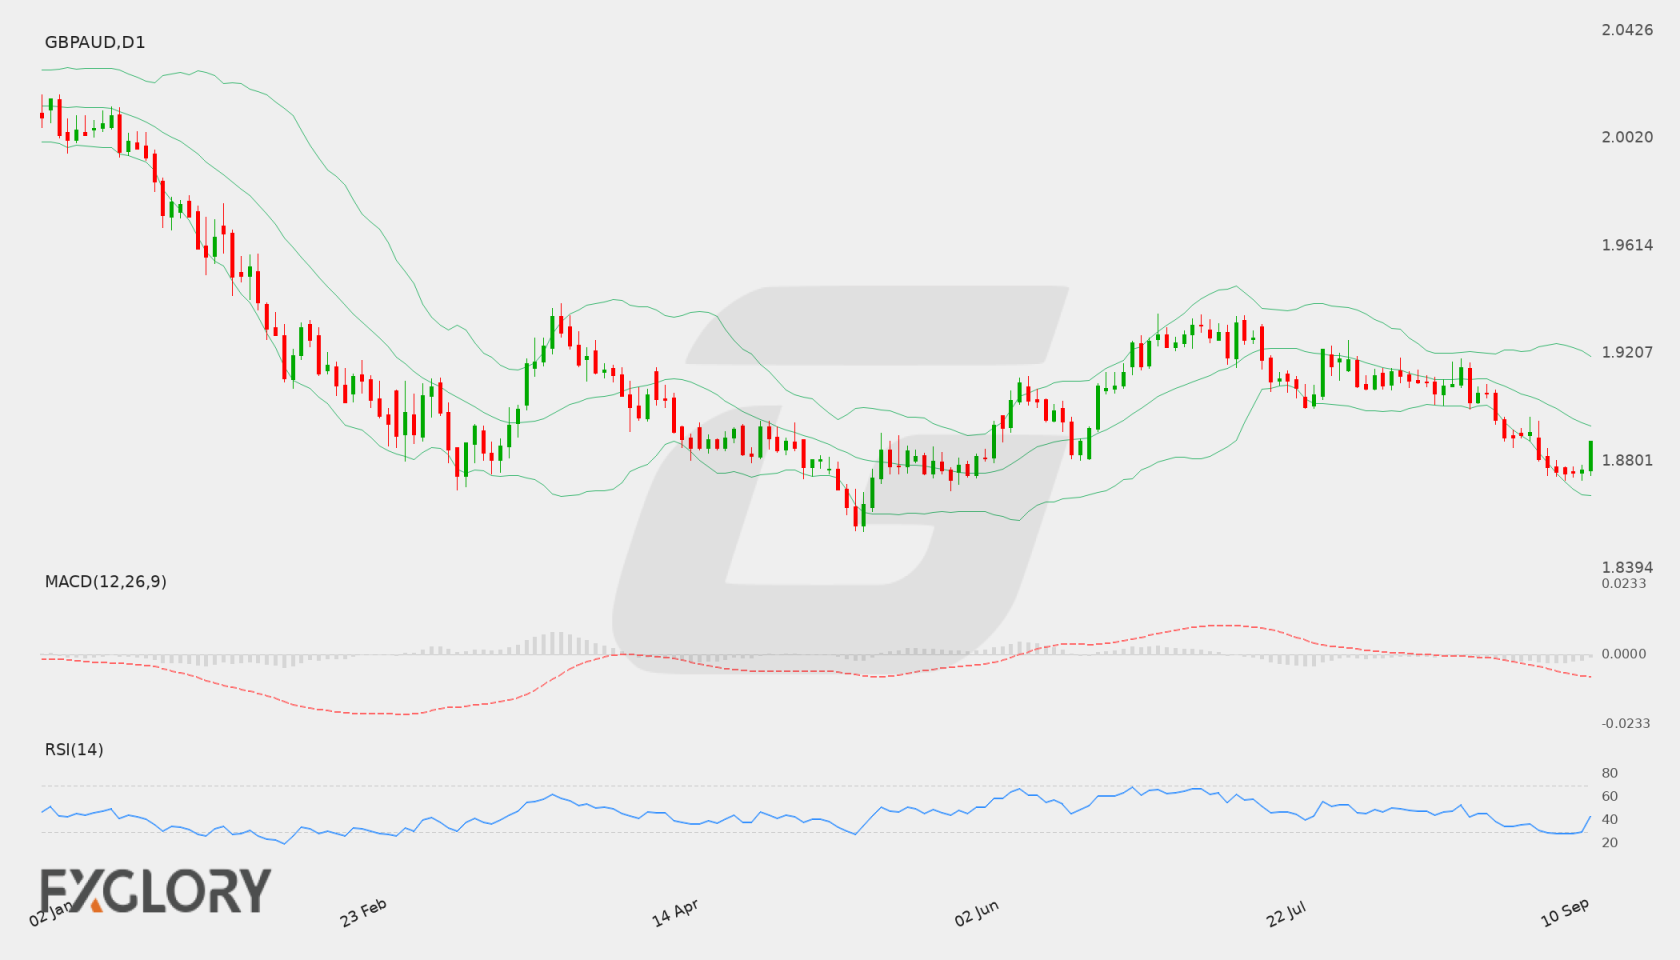
Daily (D1) price action for GBP/AUD shows the pair settling at 1.8875 after bouncing off recent daily lows around 1.8754. The broader structure demonstrates a recent downward move followed by a slight short-term consolidation.
Key Technical Indicators:
Bollinger Bands: Bollinger Bands on the D1 timeframe show a middle line at 1.8933, an upper band at 1.9196, and a lower band at 1.8670. The latest close at 1.8875 trades below the middle band, reflecting ongoing downward bias within the channel.
RSI: The 14-period RSI sits at 43.67, pointing to moderate bearish sentiment while staying above oversold conditions.
MACD: The MACD indicator is currently reading -0.0084, maintaining a position below the zero line and signalling negative momentum.
Support and Resistance:
Key technical levels for GBPAUD indicate primary support at 1.87275 and key resistance at 1.93568.
News to Watch for GBPAUD This Week:
Claimant Count Change: Shifts in unemployment claims can influence market sentiment regarding UK labor market strength.
Average Earnings Index 3m/y: Wage growth data provides key insight into underlying inflationary pressures.
CPI y/y: Headline consumer price inflation impacts expectations for central bank interest rate trajectories.
Official Bank Rate: The benchmark interest rate decision directly drives domestic currency valuation.
MPC Official Bank Rate Votes: The voting split among policymakers highlights internal monetary policy agreement or division.
Monetary Policy Summary: Official statements provide context on economic conditions and upcoming policy directions.
Retail Sales m/m: Consumer spending updates reflect the relative health of domestic retail activity.
Weekly Outlook and Consideration:
Looking ahead, GBP/AUD trades at 1.8875 with momentum indicators such as the RSI at 43.67 and MACD at -0.0084 reflecting a cautious market stance. Price remains below the daily middle Bollinger Band of 1.8933. If downward momentum resumes, price action may test technical support near 1.87275. Conversely, a sustained move higher could see the pair approach resistance at 1.93568, depending on how upcoming UK economic data and central bank announcements unfold.
Disclaimer: The analysis provided for GBP/AUD is for informational purposes only and does not constitute investment advice. Traders are encouraged to perform their own analysis and research before making any trading decisions. Market conditions can change quickly, so staying informed with the latest data is essential.
The GBP/AUD currency pair reflects shifting sentiment between the British Pound and the Australian Dollar. Recent market developments highlight key macroeconomic signals in the UK economy alongside commodity dynamics affecting the Australian Dollar. Traders monitor growth metrics and central bank communications to gauge potential directional momentum in this cross pair.
Price Action:
On the Daily (D1) timeframe, GBP/AUD has experienced a sustained downward drift, moving from recent highs above 1.9050 toward a close of 1.87780. The recent sequence of daily closes shows continuous pressure from sellers as price trades near recent swing lows.
Key Technical Indicators:
Bollinger Bands: The D1 Bollinger Bands indicate a middle band at 1.90150, an upper band at 1.92372, and a lower band at 1.87928. With the latest close at 1.87780 sitting just below the lower band, price action reflects elevated downside volatility and tests potential extension outside the band boundaries.
RSI: The 14-period Relative Strength Index (RSI) on the daily chart stands at 29.26. Hovering below the 30 level, the indicator signals that GBP/AUD is currently in oversold territory, which could prompt consolidation or short-term retracement if selling pressure subsides.
MACD: The D1 MACD main line is recorded at -0.00760, remaining well beneath the zero threshold. This negative reading underlines persistent bearish momentum across the daily timeframe.
Support and Resistance:
Immediate key technical support for GBP/AUD is identified at 1.87447. On the upside, major resistance is located at 1.93568, with the 20-day middle Bollinger Band around 1.90150 acting as a intermediate barrier.
News to Watch for GBPAUD This Week:
GDP m/m: Monthly GDP figures offer critical insight into UK economic activity, influencing interest rate expectations and volatility for the British Pound.
Weekly Outlook and Consideration:
The weekly outlook for GBP/AUD points to a prevailing bearish structure on the D1 chart, marked by an MACD of -0.00760 and a lower Bollinger Band break around 1.87928. However, with the RSI at 29.26 in oversold territory, price action near the key support level of 1.87447 may see reduced downside momentum or potential corrective attempts toward the 1.90150 middle band region before the broader trend resumes.
Disclaimer: The analysis provided for GBP/AUD is for informational purposes only and does not constitute investment advice. Traders are encouraged to perform their own analysis and research before making any trading decisions. Market conditions can change quickly, so staying informed with the latest data is essential.