Current weekly forecast: This outlook covers 11–17 October 2026 and remains valid until 17 October 2026, unless its stated invalidation condition is triggered earlier.
In brief
EUR/USD has a bearish weekly bias as D1 structure and negative momentum align, while bearish H4 conditions reinforce pressure but mixed D1 closes and expanding volatility preserve two-sided risk.
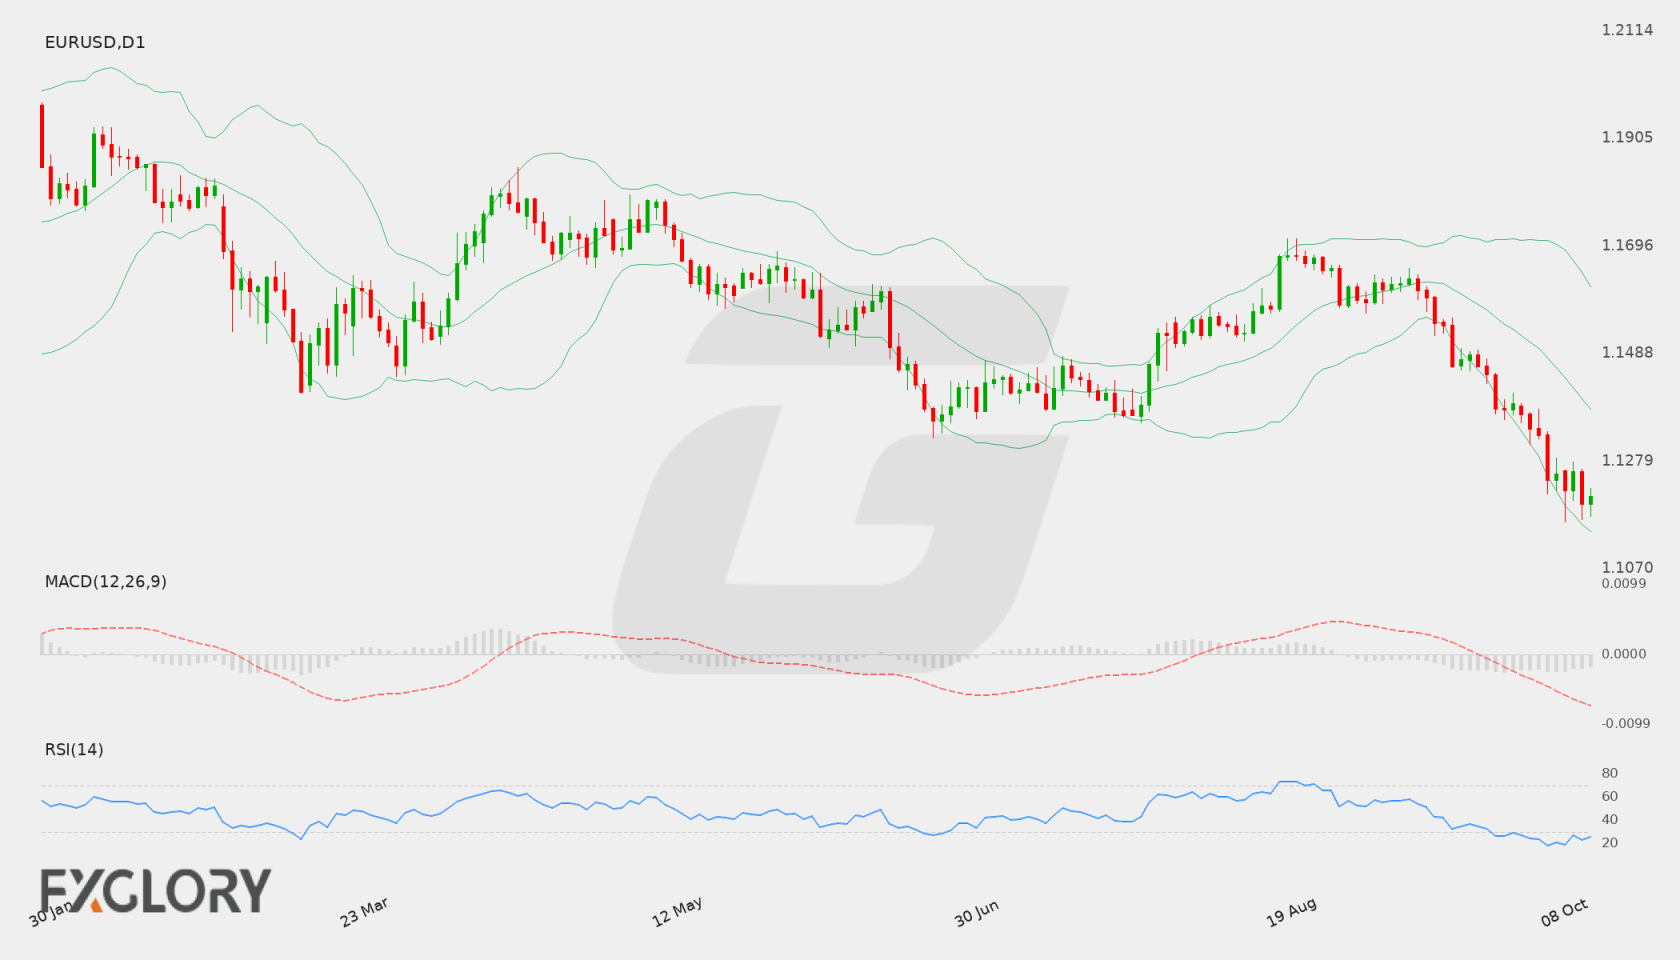
The reference D1 close is 1.12097, below the primary resistance at 1.12758 and the secondary resistance at 1.13794. The bearish D1 trend, falling EMA50 and falling SMA200 slopes, together with negative momentum, keep the broader structure under pressure.
H4 remains bearish and places tactical emphasis on the nearby 1.11854 support and 1.1212 resistance, but H4 is subordinate to the D1 thesis. A move through the supplied support or resistance areas would determine whether downside pressure develops or consolidation becomes more prominent.
EUR/USD D1 technical-analysis context for the weekly forecast. Chart data captured 11 October 2026.
EUR/USD (EURUSD) faces potential volatility as market participants evaluate incoming US economic indicators and monetary policy communications. With crucial growth, sentiment, and labor metrics scheduled, shifting interest rate expectations could influence pair dynamics.
Price Action:
On the daily chart, EUR/USD has experienced sustained downward pressure, closing at 1.12418 after reaching an intraday low of 1.12142. The consistent series of lower daily closes reflects prevailing bearish momentum toward recent support levels.
Key Technical Indicators:
Bollinger Bands: EUR/USD is trading beneath the lower Bollinger Band of 1.12490, well below the middle band of 1.14778 and the upper band of 1.17065. This positioning underlines an extended move outside the standard deviation envelope.
RSI: The 14-day RSI for EUR/USD stands at 18.07, indicating deeply oversold conditions on the daily timeframe.
MACD: The daily MACD reading of -0.00707 remains deep in negative territory, highlighting strong downward momentum without immediate confirmation of a bullish shift.
Support and Resistance:
Technical parameters for EUR/USD establish immediate daily support at 1.12142, while primary daily resistance is located higher at 1.17103.
News to Watch for EURUSD This Week:
ISM Services PMI: Measures activity in the US service sector and may influence broader US dollar demand.
FOMC Meeting Minutes: Provides detailed perspective on Federal Reserve policy debates and future interest rate expectations.
Unemployment Claims: Tracks weekly initial jobless filings to offer timely evidence regarding US labor market strength.
Prelim UoM Inflation Expectations: Gauges consumer projections for price growth which can sway interest rate sentiment.
Prelim UoM Consumer Sentiment: Reflects US household financial confidence and could drive risk appetite and dollar valuation.
Weekly Outlook and Consideration:
EUR/USD (EURUSD) approaches the upcoming week under defined selling pressure following a daily close at 1.12418. Technical indicators point to negative momentum, evidenced by a MACD of -0.00707 and price action trading below the lower Bollinger Band of 1.12490. Concurrently, the RSI value of 18.07 reflects heavily oversold territory near support at 1.12142. If this floor holds, traders may watch for stabilization toward the middle band at 1.14778, whereas resistance remains set at 1.17103 amid potential volatility from US economic updates.
Disclaimer: The analysis provided for EUR/USD is for informational purposes only and does not constitute investment advice. Traders are encouraged to perform their own analysis and research before making any trading decisions. Market conditions can change quickly, so staying informed with the latest data is essential.
EUR/USD faces downside pressure as investors evaluate regional inflation trends against US manufacturing momentum. Market participants are monitoring European price dynamics along with American economic activity indicators to gauge future monetary policy directions.
Price Action:
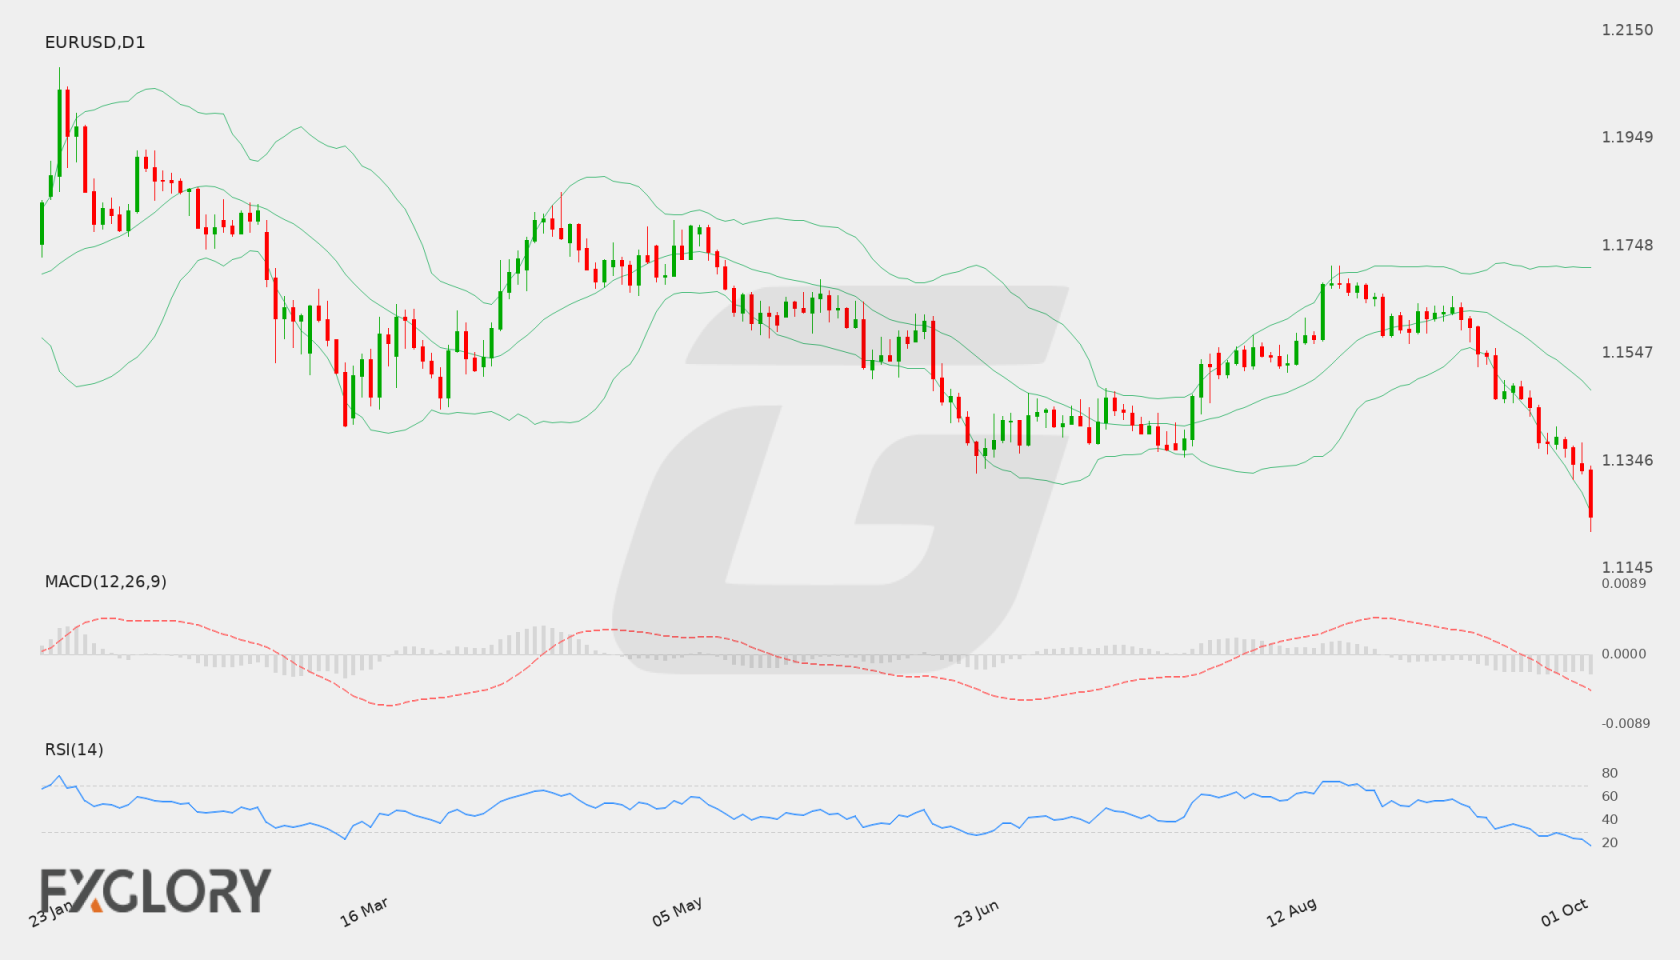
EUR/USD (EURUSD) has seen consistent downside price action on the daily D1 chart, sliding to a close of 1.13794. Price action is currently testing near the critical support level at 1.13524.
Key Technical Indicators:
Bollinger Bands: On the D1 chart, EUR/USD trades near the lower Bollinger Band of 1.13806, reflecting strong downward pressure. The middle band sits at 1.15443, while the upper band stands at 1.17080.
RSI: The 14-day RSI for EURUSD stands at 26.26, placing the pair in oversold territory and suggesting downside momentum may be stretched.
MACD: The daily MACD indicator for EUR/USD remains negative at -0.00435, confirming persistent bearish sentiment in the pair.
Support and Resistance:
Key daily support for EUR/USD is located at 1.13524, while primary resistance is established around 1.17103.
News to Watch for EURUSD This Week:
German Prelim CPI m/m: Reflects German inflation dynamics that can influence European monetary policy decisions.
ISM Manufacturing PMI: Assesses US manufacturing momentum and general health of the American economy.
ISM Manufacturing Prices: Evaluates input price pressures in US industry that might impact rate policy sentiment.
Weekly Outlook and Consideration:
The weekly outlook for EUR/USD (EURUSD) reflects a prevailing bearish trend, with daily price closing at 1.13794 near the lower Bollinger Band of 1.13806. While the MACD at -0.00435 maintains a negative posture, an RSI of 26.26 highlights oversold conditions. A test of key support at 1.13524 could determine whether sellers retain control or if a stabilization phase emerges back toward the middle band near 1.15443, with major resistance situated at 1.17103.
Disclaimer: The analysis provided for EUR/USD is for informational purposes only and does not constitute investment advice. Traders are encouraged to perform their own analysis and research before making any trading decisions. Market conditions can change quickly, so staying informed with the latest data is essential.
EUR/USD fundamental dynamics will likely be shaped by major macroeconomic data releases from both the Eurozone and the United States. Key European focus falls on German Prelim CPI m/m, which provides critical clues regarding Eurozone inflation trends and monetary policy expectations. Meanwhile, a dense slate of US economic metrics—including Core PCE Price Index m/m, Final GDP q/q, ISM Manufacturing PMI, and crucial labor indicators like Non-Farm Employment Change—will drive market sentiment and interest rate expectations. Traders should prepare for heightened volatility around these high-impact announcements.
Price Action:
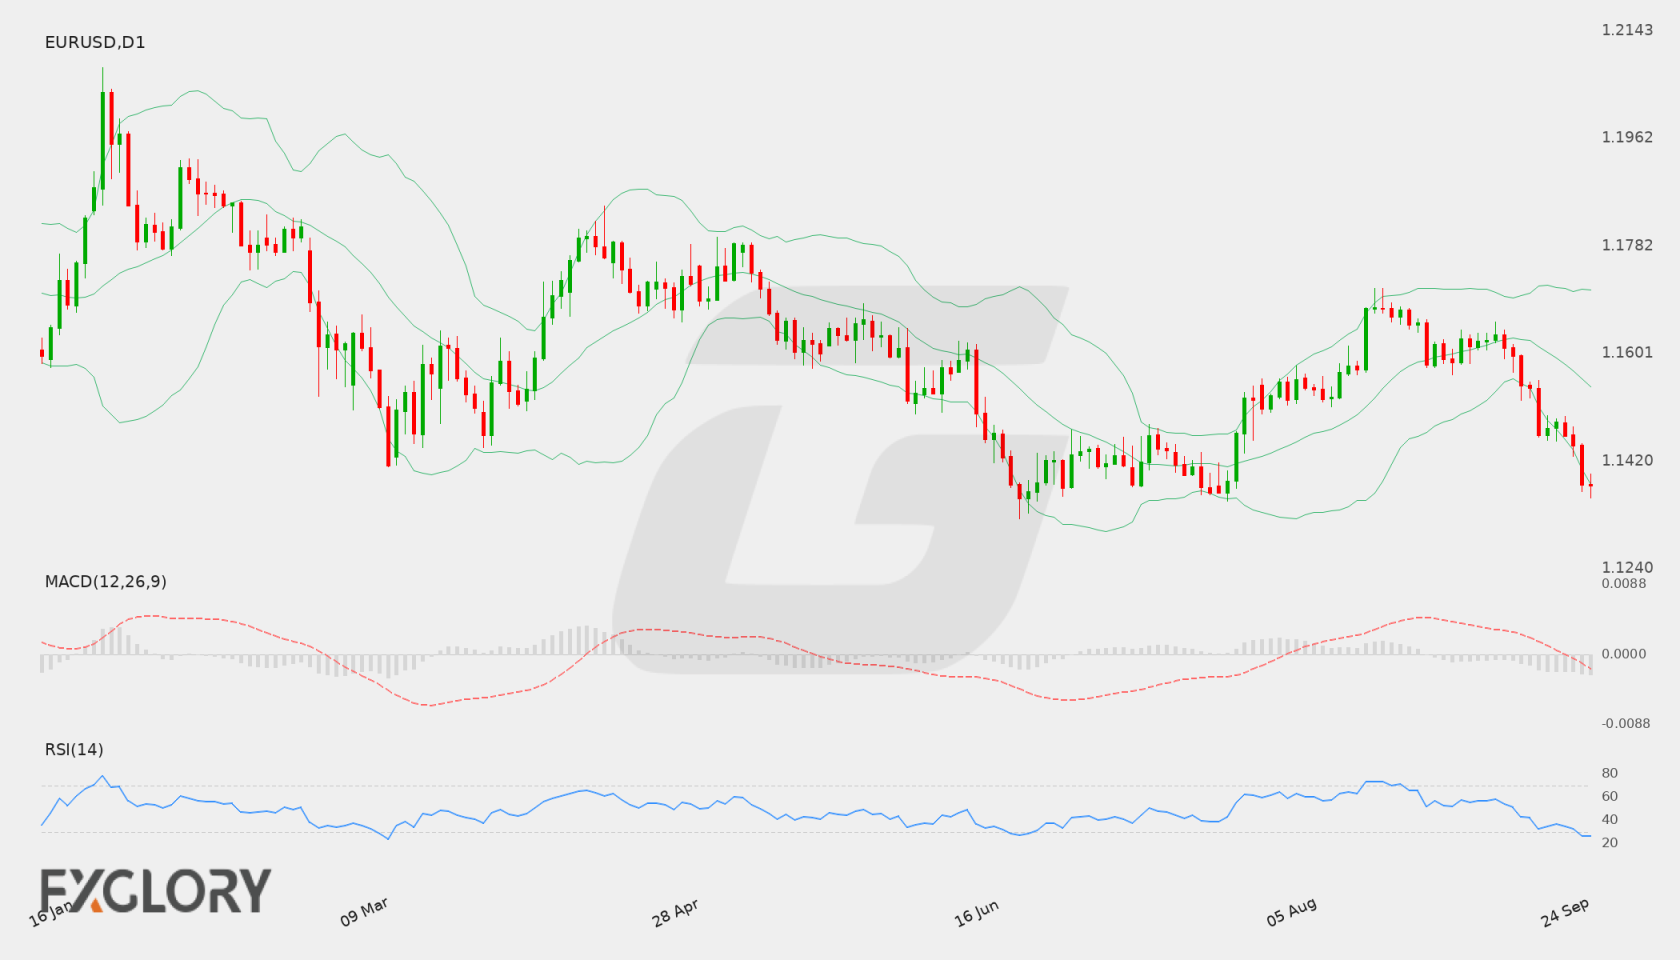
The daily chart for EUR/USD (EURUSD) reflects a prevailing bearish trend over recent sessions. The pair pushed down from recent highs near 1.1632, ultimately securing a daily close at 1.14750. Consecutive lower daily closes highlight sustained selling pressure, with price action testing lower technical thresholds.
Key Technical Indicators:
Bollinger Bands: The daily Bollinger Bands indicator for EUR/USD shows a middle band at 1.16023, an upper band at 1.17157, and a lower band at 1.14888. The latest close at 1.14750 sits just below the lower band, signaling an extension of downside momentum and potential short-term oversold conditions.
RSI: The 14-period Relative Strength Index (RSI) stands at 34.62. This reading places EUR/USD in bearish territory, approaching oversold levels near 30, which indicates ongoing dominant seller control without an immediate sign of bullish divergence.
MACD: The Moving Average Convergence Divergence (MACD) indicator is currently reading -0.00116 for EUR/USD (EURUSD). Being below the zero line, it confirms that bearish momentum remains firmly in control of daily market movement.
Support and Resistance:
Key technical levels on the daily chart identify main support at 1.13524 and key resistance at 1.17103. Additional intermediate resistance rests near the daily middle Bollinger Band around 1.16023 should any upward corrections emerge.
News to Watch for EURUSD This Week:
CB Consumer Confidence: Provides insight into US household economic sentiment and potential consumer spending trends.
JOLTS Job Openings: Reflects labor market demand and tight market dynamics in the US economy.
German Prelim CPI m/m: Measures preliminary inflation changes in Germany, impacting Eurozone policy expectations.
Core PCE Price Index m/m: Tracks key US inflation metrics closely evaluated by the Federal Reserve.
Final GDP q/q: Offers a comprehensive measure of US economic growth performance for the preceding quarter.
ISM Manufacturing PMI: Gauges business conditions within the US manufacturing sector.
Average Hourly Earnings m/m: Serves as an indicator of wage growth and underlying inflationary pressures.
Non-Farm Employment Change: Highlights net job creation in the US, acting as a crucial labor market driver.
Unemployment Rate: Shows the overall percentage of the unemployed workforce, influencing broader market sentiment.
Weekly Outlook and Consideration:
EUR/USD (EURUSD) enters the trading week under bearish pressure, closing at 1.14750 below its lower daily Bollinger Band of 1.14888. Technical indicators reinforce this stance, with an RSI at 34.62 and a negative MACD value of -0.00116. If downside momentum continues, price action may approach primary support around 1.13524. Conversely, any rebound attempt will face resistance at 1.16023 followed by 1.17103. Upcoming high-impact US labor data and inflation figures could trigger significant volatility, guiding the pair’s next clear direction.
Disclaimer: The analysis provided for EUR/USD is for informational purposes only and does not constitute investment advice. Traders are encouraged to perform their own analysis and research before making any trading decisions. Market conditions can change quickly, so staying informed with the latest data is essential.
The EUR/USD pair remains heavily influenced by central bank expectations and upcoming macroeconomic data releases from the United States. Key consumer activity metrics and monetary policy decisions from the Federal Reserve are positioned to dictate broader market sentiment, while European monetary policy outlooks continue to provide background context for the currency pair.
Price Action:
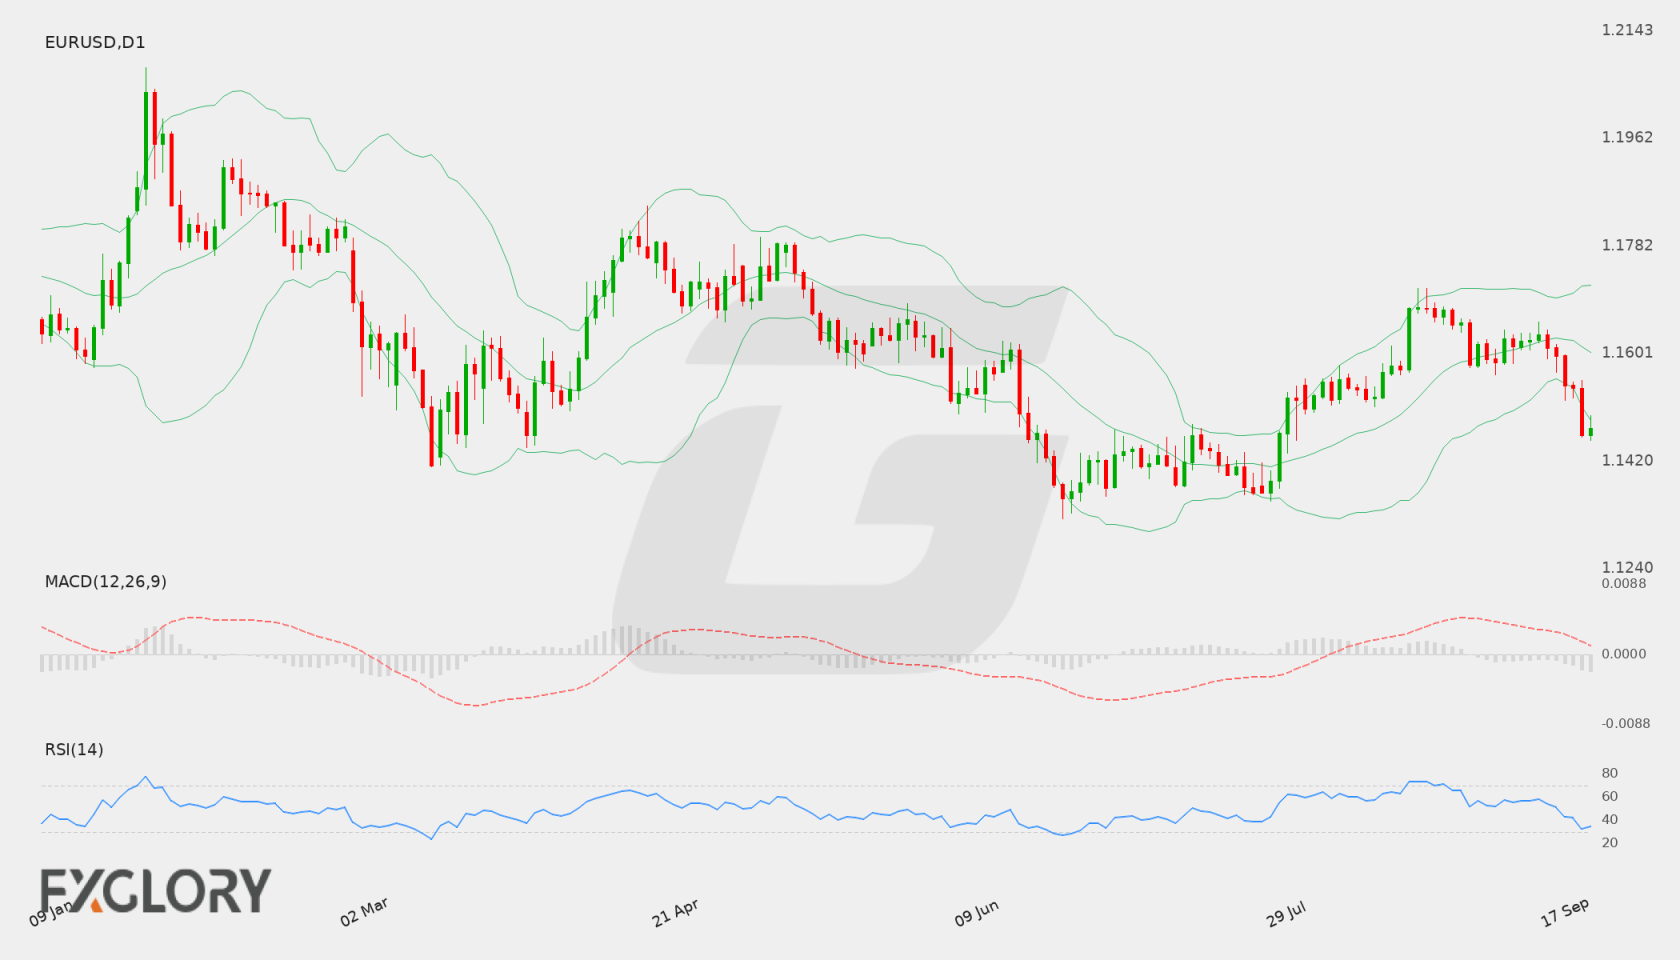
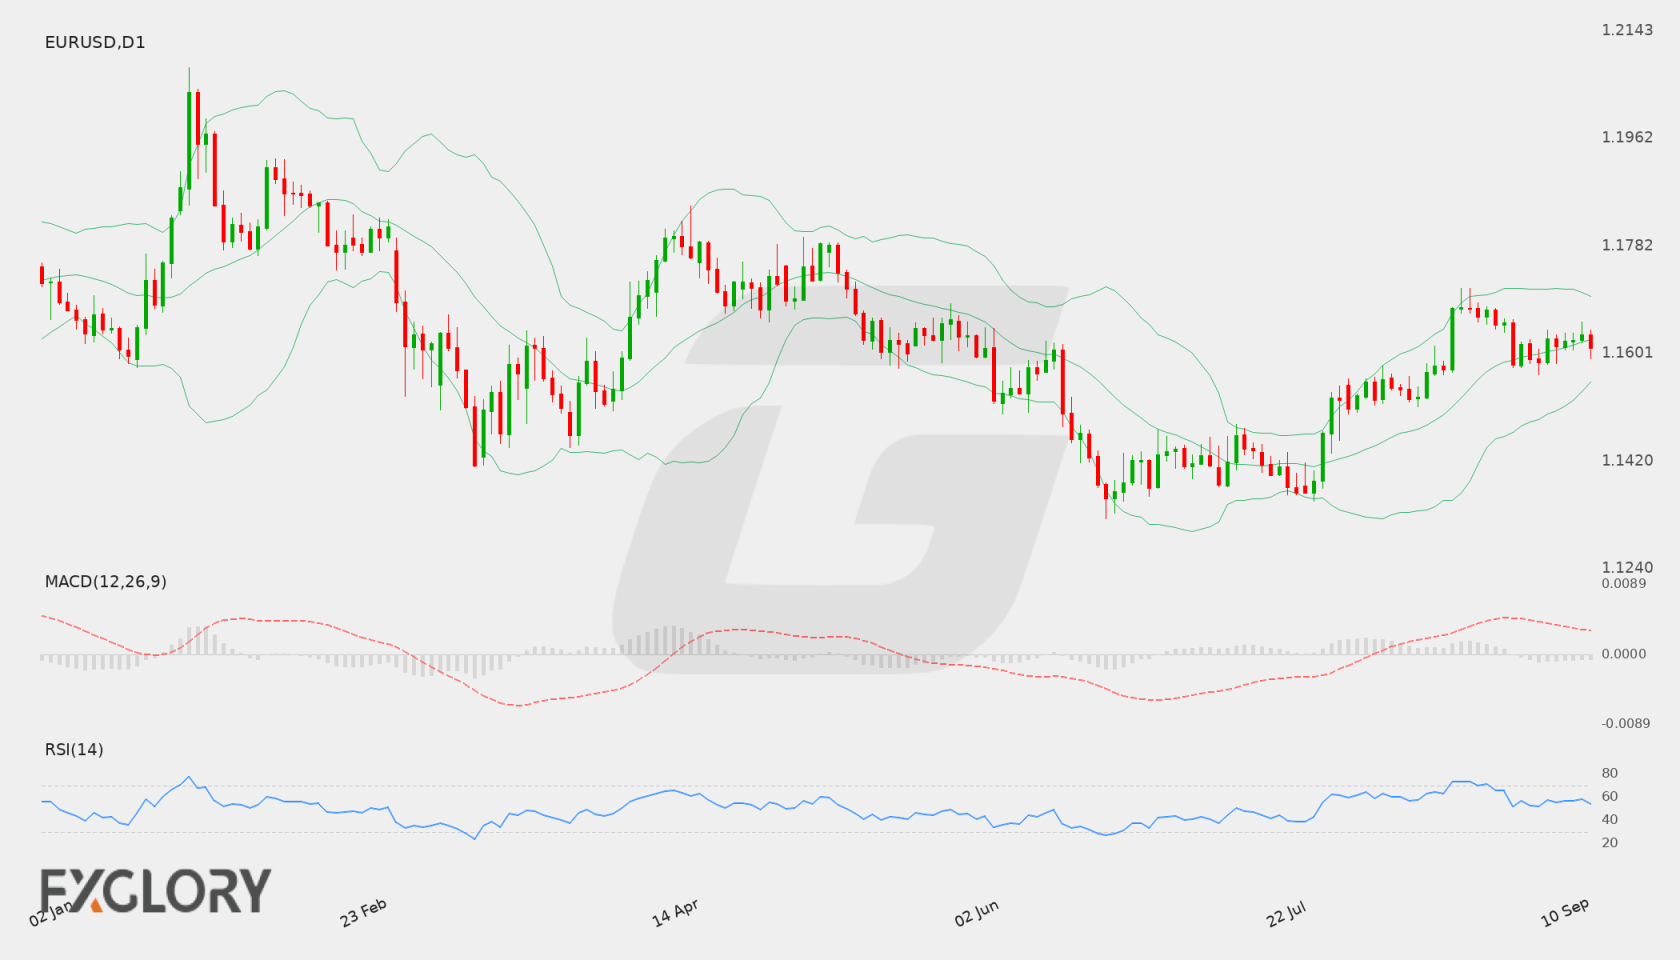
On the daily chart, EUR/USD recently closed at 1.16111 following a period of consolidated price movements. Recent daily candlesticks highlight market indecision, with price oscillating around the 1.1610 to 1.1630 region as buyers and sellers seek clearer directional momentum.
Key Technical Indicators:
Bollinger Bands: The Bollinger Bands indicator reflects a middle band at 1.16248, an upper band at 1.16966, and a lower band at 1.15531. With the current spot price at 1.16111 residing just under the middle line, price volatility remains compressed within a defined range.
RSI: The 14-period Relative Strength Index (RSI) stands at 53.58, placing the market in neutral-to-slightly bullish territory. The indicator remains balanced, leaving room for movement in either direction without immediate overbought or oversold conditions.
MACD: The MACD indicator shows a value of 0.00226, remaining in positive territory. This reading indicates a mild bullish baseline, though the proximity to zero suggests momentum is currently muted.
Support and Resistance:
Technical resistance is established at 1.17103, marking the key hurdle for prospective bullish moves. On the downside, primary support is located at 1.13236, offering a lower threshold against extended bearish pressure.
News to Watch for EURUSD This Week:
Core Retail Sales m/m: Measures core consumer spending growth which can influence interest rate expectations.
EUR/USD is navigating a neutral phase between key technical parameters. Supported by an RSI of 53.58 and a positive MACD reading of 0.00226, the pair maintains subtle upside potential, though it trades slightly under the daily Bollinger middle band of 1.16248. Near-term directional clarity is likely to be guided by key economic events and central bank policy signals. A firm breakout above resistance at 1.17103 could encourage further bullish interest, while a shift below current levels leaves support at 1.13236 as the secondary boundary.
Disclaimer: The analysis provided for EUR/USD is for informational purposes only and does not constitute investment advice. Traders are encouraged to perform their own analysis and research before making any trading decisions. Market conditions can change quickly, so staying informed with the latest data is essential.