EUR/NZD Forecast — 3 October 2026
Time Zone: GMT +3
Time Frame: Daily (D1) / Weekly Outlook
Weekly Fundamental Overview:
EUR/NZD fundamentals continue to be driven by comparative macroeconomic health and central bank expectations between the Eurozone and New Zealand. With no specific economic releases scheduled on the pair calendar, market valuation is largely shaped by general risk sentiment, trade activity, and ongoing interest rate dynamics. The New Zealand Dollar remains sensitive to global growth sentiment, while the Euro responds to overarching European monetary stability.
Price Action:
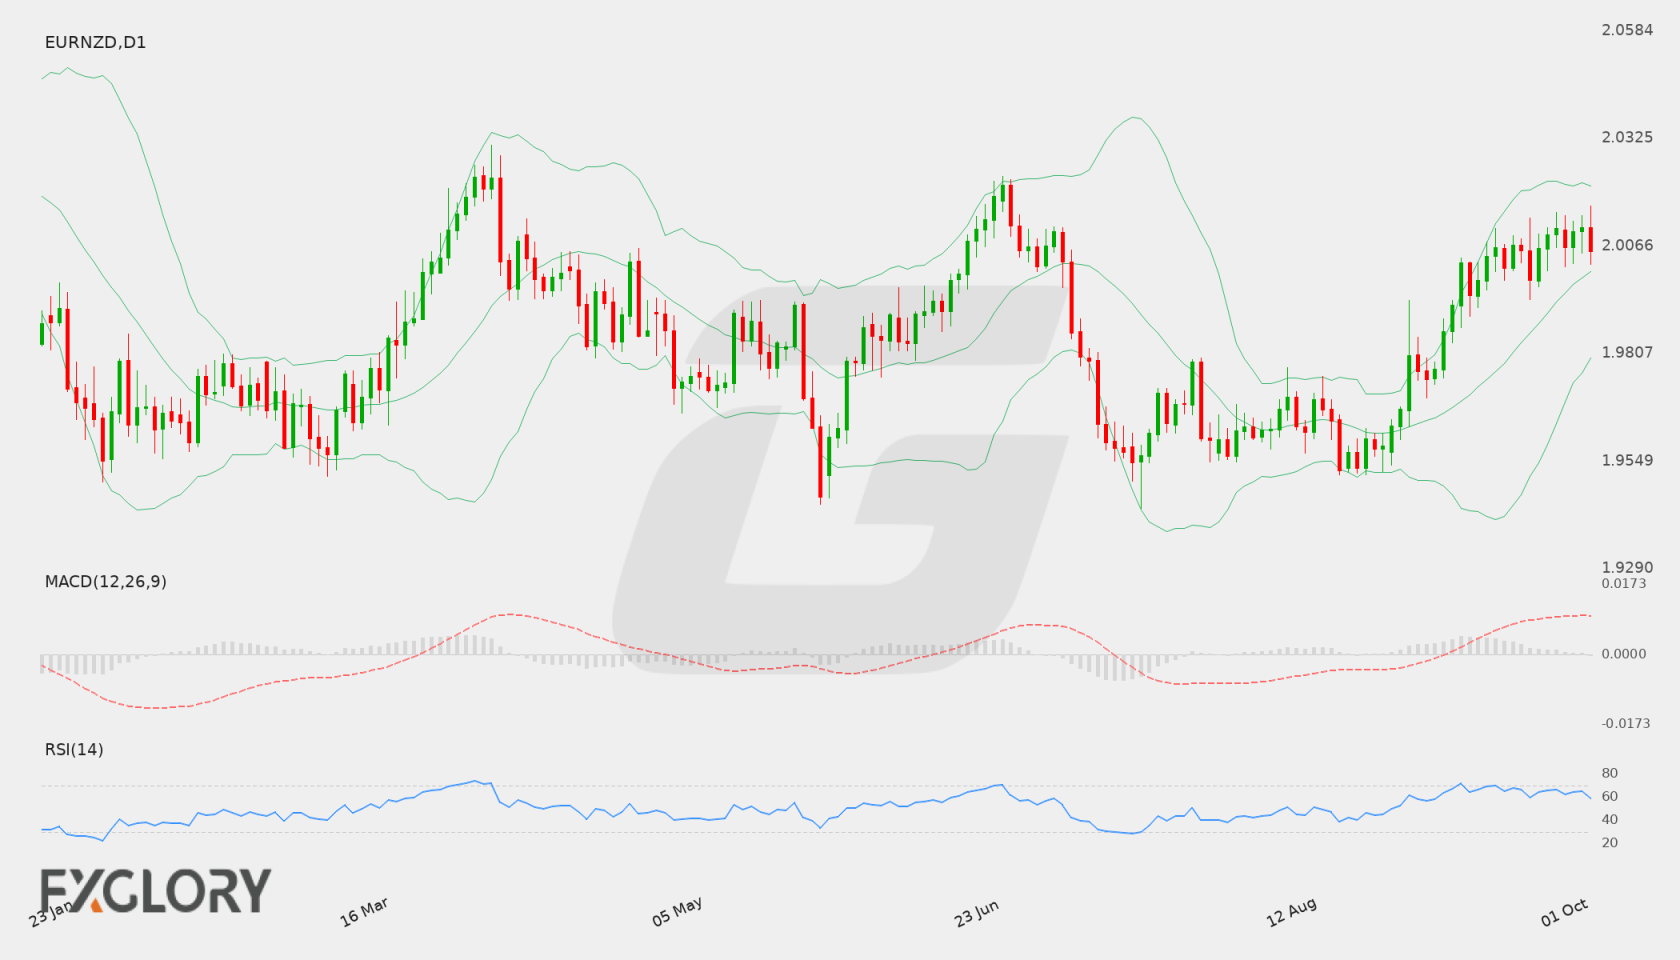
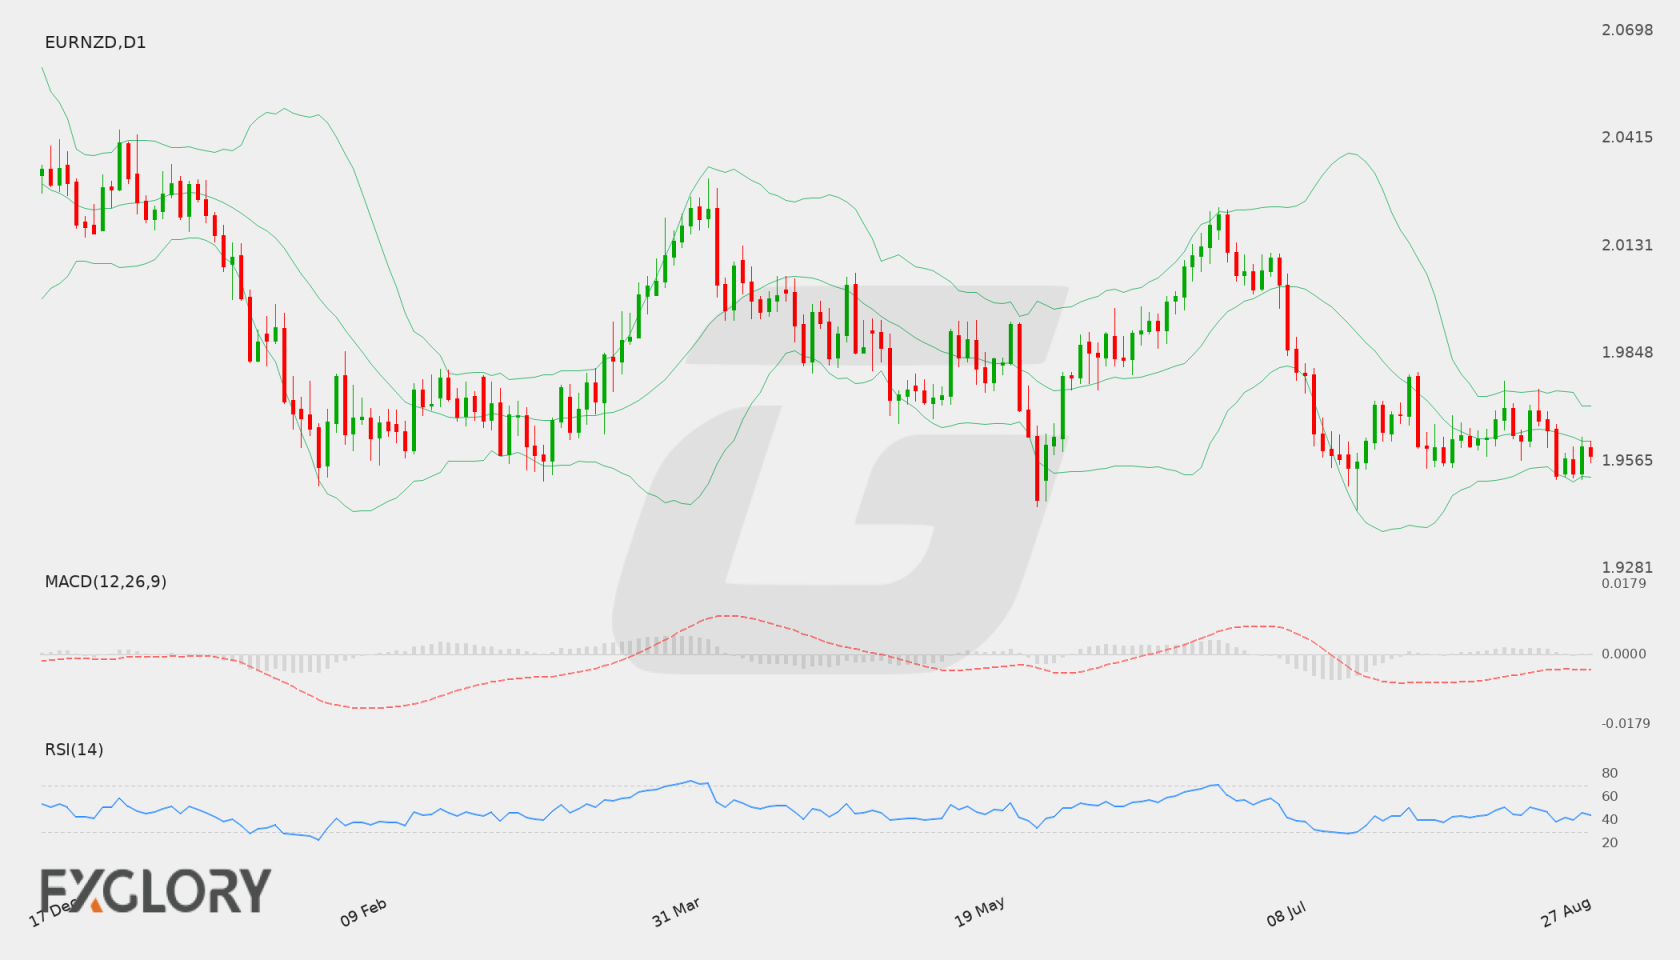
On the daily chart, EUR/NZD has established an upward trajectory after rebounding from lows below 1.9600 in prior sessions. The currency pair recently reached a high of 2.01611 before moderating slightly to close at 2.00534. This behavior shows persistent buying interest above the 2.0000 mark, though recent price action reflects consolidation directly beneath the latest swing high.
Key Technical Indicators:
Bollinger Bands: EUR/NZD is trading in the upper half of its Bollinger Bands, reflecting a constructive technical stance. The middle band sits at 2.00034, offering immediate baseline support, while the upper band is positioned at 2.02099 and the lower band is located at 1.97968. With the last close at 2.00534 holding above the middle band, volatility remains supportive of the prevailing upward bias.
RSI: The 14-day Relative Strength Index (RSI) for EUR/NZD is currently reading at 58.80. Positioning comfortably above the neutral 50 threshold indicates steady upside momentum without signaling overbought conditions. This provides adequate technical latitude for continued directional movement in either direction.
MACD: The daily MACD for EUR/NZD stands in positive territory at 0.00905. This positive alignment indicates that short-term momentum continues to outpace long-term averages. While the reading confirms ongoing bullish momentum, traders typically watch for any signs of line convergence that might signal momentum fatigue.
Support and Resistance:
Key technical levels for EUR/NZD define the current daily trading parameters. Immediate resistance is situated at 2.01611, which marks the latest peak on the chart. On the downside, primary technical support is established at 1.94349, with intermediate dynamic support provided by the 20-day moving average around 2.00034.
News to Watch for EURNZD This Week:
- No specific events are available.
- Generic High-Impact Releases: Major macroeconomic reports could shift broader market volatility and impact exchange rates.
- Central Bank Comments: Statements from monetary policymakers can alter forward expectations for interest rate differentials.
- Broader Risk Sentiment: Shifts in overall market risk appetite may influence capital flows between risk-correlated currencies and the Euro.
Weekly Outlook and Consideration:
The daily outlook for EUR/NZD (EURNZD) remains mildly bullish as the pair holds above the key 2.0000 psychological handle, closing at 2.00534. Technical support from the Bollinger middle band at 2.00034, combined with a positive MACD of 0.00905 and an RSI of 58.80, highlights ongoing buyer presence. A decisive break past the 2.01611 resistance could expose the upper Bollinger Band at 2.02099. Conversely, failure to maintain altitude above 2.00034 may shift attention toward lower levels, with primary structural support sitting down at 1.94349.
Disclaimer: The analysis provided for EUR/NZD is for informational purposes only and does not constitute investment advice. Traders are encouraged to perform their own analysis and research before making any trading decisions. Market conditions can change quickly, so staying informed with the latest data is essential.