
EURNZD Forecast

EUR iconNZD icon
EUR/NZD

Euro vs New Zealand Dollar

EUR/NZD Live Price

1.99489
-0.29%

EUR/NZD Forecast — 3 October 2026

Time Zone: GMT +3

Time Frame: Daily (D1) / Weekly Outlook

Weekly Fundamental Overview:

EUR/NZD fundamentals continue to be driven by comparative macroeconomic health and central bank expectations between the Eurozone and New Zealand. With no specific economic releases scheduled on the pair calendar, market valuation is largely shaped by general risk sentiment, trade activity, and ongoing interest rate dynamics. The New Zealand Dollar remains sensitive to global growth sentiment, while the Euro responds to overarching European monetary stability.

Price Action:

On the daily chart, EUR/NZD has established an upward trajectory after rebounding from lows below 1.9600 in prior sessions. The currency pair recently reached a high of 2.01611 before moderating slightly to close at 2.00534. This behavior shows persistent buying interest above the 2.0000 mark, though recent price action reflects consolidation directly beneath the latest swing high.

Key Technical Indicators:

Bollinger Bands: EUR/NZD is trading in the upper half of its Bollinger Bands, reflecting a constructive technical stance. The middle band sits at 2.00034, offering immediate baseline support, while the upper band is positioned at 2.02099 and the lower band is located at 1.97968. With the last close at 2.00534 holding above the middle band, volatility remains supportive of the prevailing upward bias.

RSI: The 14-day Relative Strength Index (RSI) for EUR/NZD is currently reading at 58.80. Positioning comfortably above the neutral 50 threshold indicates steady upside momentum without signaling overbought conditions. This provides adequate technical latitude for continued directional movement in either direction.

MACD: The daily MACD for EUR/NZD stands in positive territory at 0.00905. This positive alignment indicates that short-term momentum continues to outpace long-term averages. While the reading confirms ongoing bullish momentum, traders typically watch for any signs of line convergence that might signal momentum fatigue.

Support and Resistance:

Key technical levels for EUR/NZD define the current daily trading parameters. Immediate resistance is situated at 2.01611, which marks the latest peak on the chart. On the downside, primary technical support is established at 1.94349, with intermediate dynamic support provided by the 20-day moving average around 2.00034.

News to Watch for EURNZD This Week:

  • No specific events are available.
  • Generic High-Impact Releases: Major macroeconomic reports could shift broader market volatility and impact exchange rates.
  • Central Bank Comments: Statements from monetary policymakers can alter forward expectations for interest rate differentials.
  • Broader Risk Sentiment: Shifts in overall market risk appetite may influence capital flows between risk-correlated currencies and the Euro.

Weekly Outlook and Consideration:

The daily outlook for EUR/NZD (EURNZD) remains mildly bullish as the pair holds above the key 2.0000 psychological handle, closing at 2.00534. Technical support from the Bollinger middle band at 2.00034, combined with a positive MACD of 0.00905 and an RSI of 58.80, highlights ongoing buyer presence. A decisive break past the 2.01611 resistance could expose the upper Bollinger Band at 2.02099. Conversely, failure to maintain altitude above 2.00034 may shift attention toward lower levels, with primary structural support sitting down at 1.94349.

Disclaimer: The analysis provided for EUR/NZD is for informational purposes only and does not constitute investment advice. Traders are encouraged to perform their own analysis and research before making any trading decisions. Market conditions can change quickly, so staying informed with the latest data is essential.
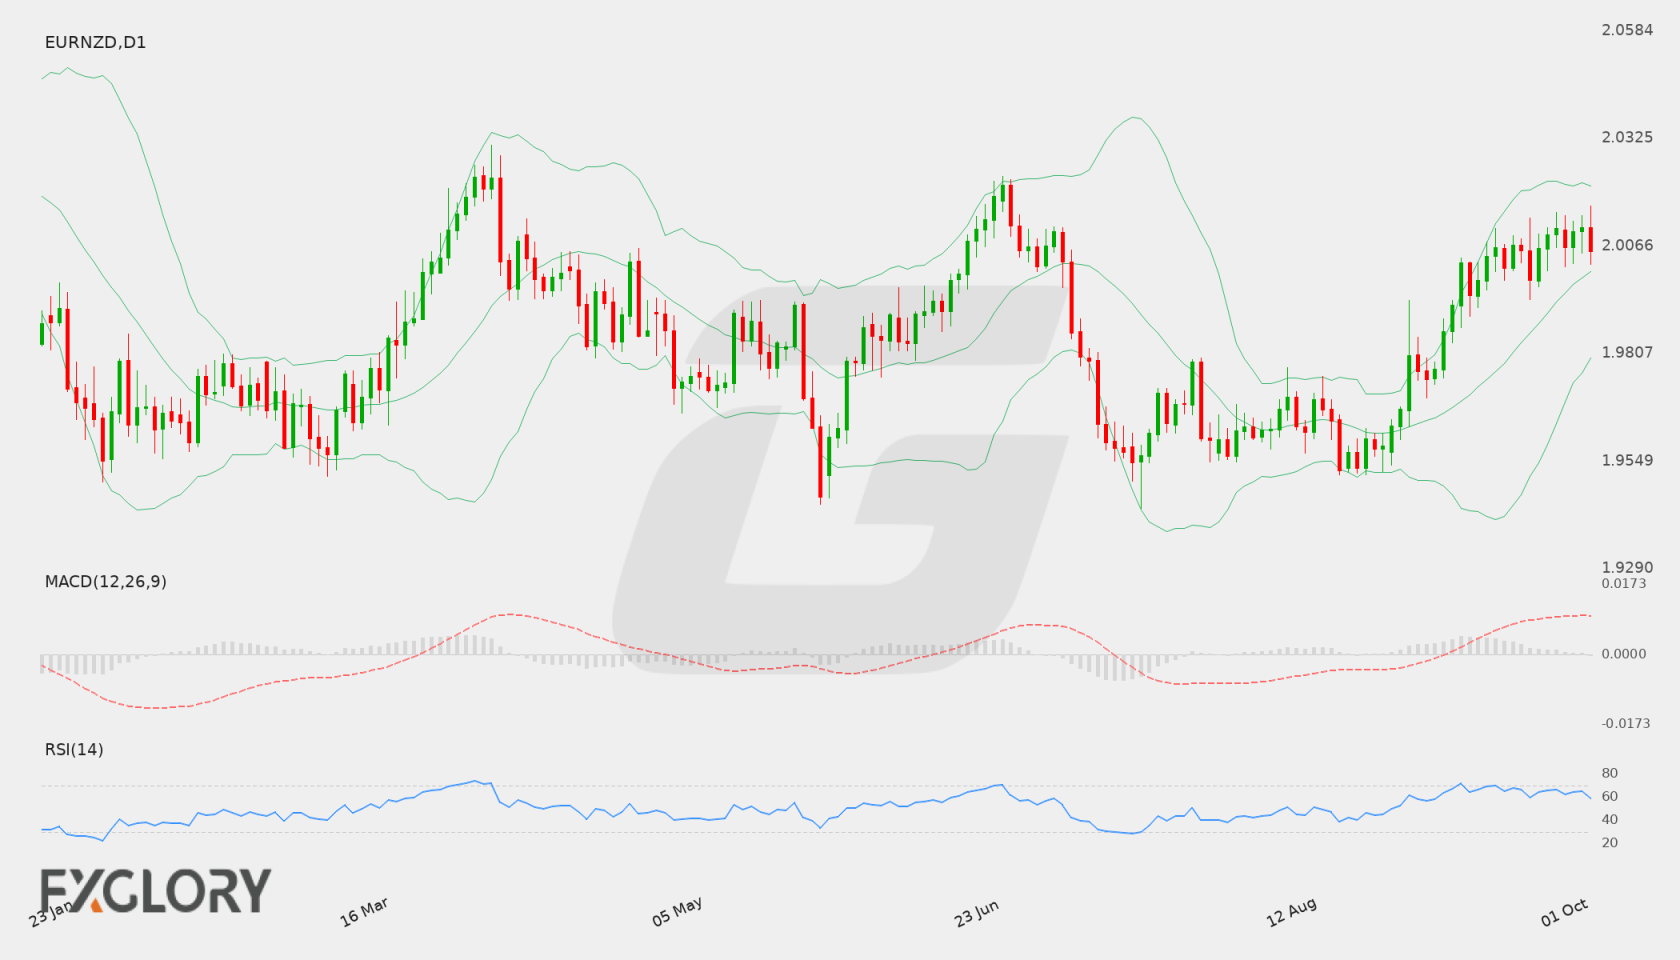
EUR/NZD D1 technical analysis chart
EUR/NZD D1 Technical Analysis for 10.03.2026

EUR/NZD Forecast — 20 September 2026

Time Zone: GMT +3

Time Frame: Daily (D1) / Weekly Outlook

Weekly Fundamental Overview:

The EUR/NZD currency pair continues to reflect macroeconomic trends across the Eurozone and New Zealand. Traders are monitoring upcoming Eurozone inflation data and broader risk sentiment, which frequently drives movement in commodity-linked currencies like the New Zealand Dollar relative to the Euro.

Price Action:

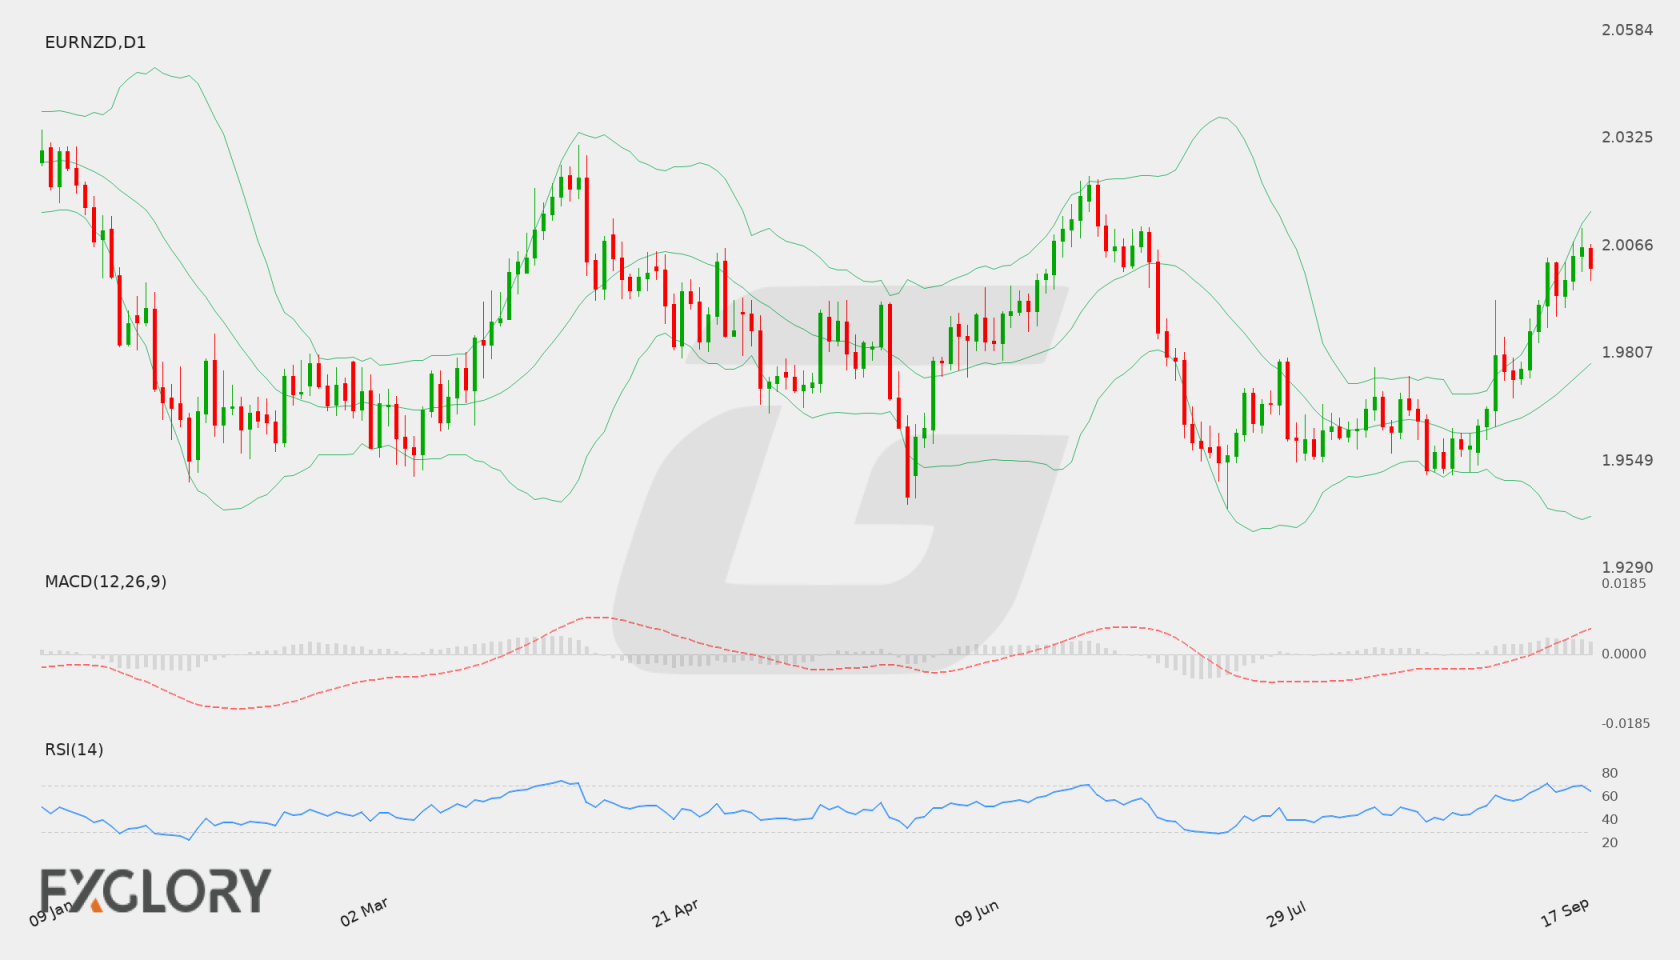
On the daily (D1) chart, EUR/NZD has exhibited a steady upward progression, climbing from recent swings near 1.95695 toward the 2.00619 level before settling at a close of 2.00138. The sequence of recent higher daily closes demonstrates active bullish sentiment across recent trading sessions.

Key Technical Indicators:

Bollinger Bands: The daily Bollinger Bands display an expanding channel for EURNZD. The middle band sits at 1.97817, while the upper band is at 2.01491 and the lower band is at 1.94144. Trading near 2.00138 positions price in the upper half of the band structure, reflecting persistent upward pressure.

RSI: The 14-period Relative Strength Index (RSI) currently sits at 64.92. This reading places the oscillator in comfortable bullish territory above the 50 centerline, while remaining below the overbought threshold of 70.

MACD: The MACD indicator for EUR/NZD shows a positive reading of 0.00985. The location of the signal line above zero indicates sustained positive momentum on the daily horizon, aligned with the recent recovery in price.

Support and Resistance:

Key daily technical levels for EURNZD highlight main technical boundaries. Resistance is mapped overhead at 2.02330, while solid historical support is established below at 1.94349.

News to Watch for EURNZD This Week:

  • German Prelim CPI m/m: Tracks preliminary German consumer inflation, which strongly impacts European monetary policy expectations.
  • CPI Flash Estimate y/y: Reflects headline inflation across the Eurozone and provides key direction for European yields.
  • Core CPI Flash Estimate y/y: Measures underlying price pressures excluding volatile items to gauge long-term Eurozone inflation trends.

Weekly Outlook and Consideration:

The technical posture for EUR/NZD remains constructively biased following its advance to 2.00138. If the current upward trajectory continues, buyers may look toward testing the daily resistance near 2.02330. Should a pullback occur, initial dynamic support rests near the daily middle Bollinger Band at 1.97817, with major support established lower at 1.94349.

Disclaimer: The analysis provided for EUR/NZD is for informational purposes only and does not constitute investment advice. Traders are encouraged to perform their own analysis and research before making any trading decisions. Market conditions can change quickly, so staying informed with the latest data is essential.
EUR/NZD D1 technical analysis chart
EUR/NZD D1 Technical Analysis for 09.20.2026

EUR/NZD Forecast — 12 September 2026

Time Zone: GMT +3

Time Frame: Daily (D1) / Weekly Outlook

Weekly Fundamental Overview:

EUR/NZD has experienced notable upward movement as traders assess relative monetary policy expectations and economic conditions between the Eurozone and New Zealand. Broad market risk sentiment and upcoming domestic data points from New Zealand remain key drivers that could impact the exchange rate’s trajectory in the coming sessions.

Price Action:

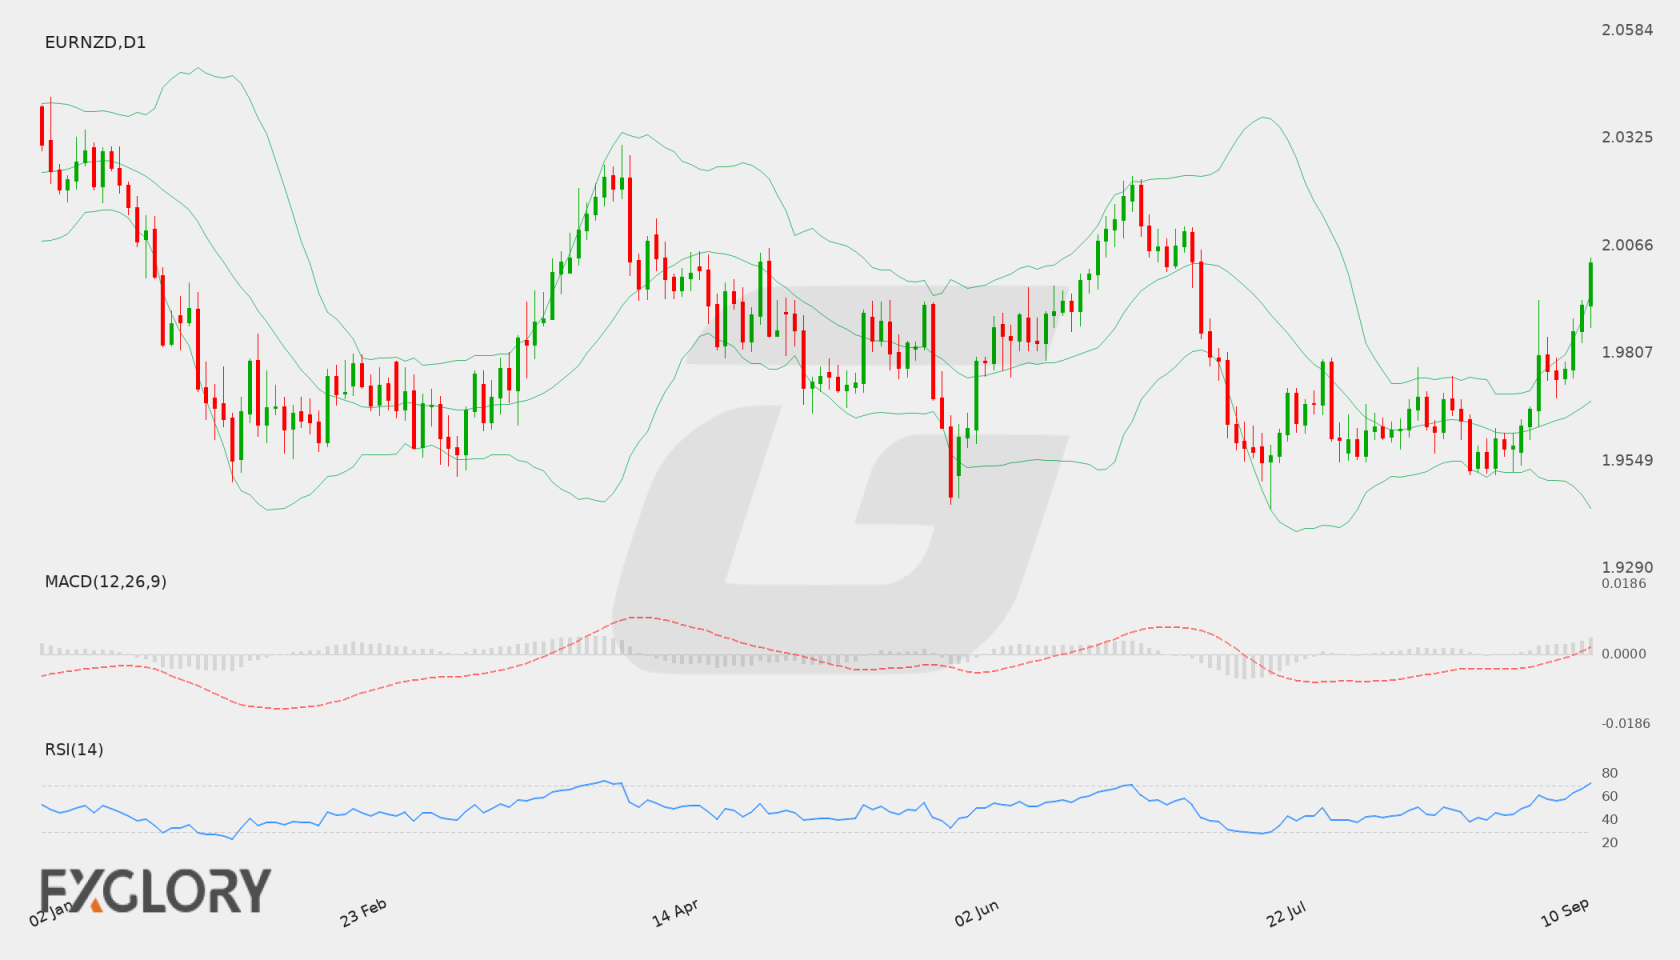
On the daily timeframe, EUR/NZD has established a solid upward trajectory, climbing from recent low closes near 1.95835 to close at 2.00250. The pair has comfortably cleared the key 2.0000 level, demonstrating persistent buying interest through higher daily highs and higher daily lows.

Key Technical Indicators:

Bollinger Bands: The daily Bollinger Bands feature a middle line at 1.96927, an upper band at 1.99513, and a lower band at 1.94341. With the current close at 2.00250 breaking above the upper envelope, price action indicates strong bullish momentum alongside potential overextension beyond normal volatility ranges.

RSI: The 14-day Relative Strength Index (RSI) registers at 71.60. Crossing above the 70 benchmark places EUR/NZD in overbought territory, pointing to robust buying pressure while highlighting the possibility of a pause or minor corrective pullback.

MACD: The MACD indicator on the daily timeframe stands at a positive 0.00615. The indicator continues to trade above its baseline, aligning with the ongoing bullish trend and indicating that buyers currently maintain directional control.

Support and Resistance:

Technically, EUR/NZD faces overhead resistance at 2.02330, which acts as the primary upside target for further gains. On the downside, primary support is identified at 1.94349, with intermediate dynamic support around the daily middle Bollinger Band at 1.96927.

News to Watch for EURNZD This Week:

  • GDP q/q: This quarterly economic growth indicator for New Zealand could influence central bank monetary policy expectations and drive price volatility in the New Zealand dollar.

Weekly Outlook and Consideration:

EUR/NZD enters the week with a firm bullish posture on the daily chart after closing at 2.00250. Positive MACD momentum and price action above the upper Bollinger Band support the ongoing uptrend toward resistance at 2.02330. Nevertheless, with the daily RSI in overbought territory at 71.60, a period of consolidation or a retracement toward support near 1.96927 remains possible before further directional moves unfold.

Disclaimer: The analysis provided for EUR/NZD is for informational purposes only and does not constitute investment advice. Traders are encouraged to perform their own analysis and research before making any trading decisions. Market conditions can change quickly, so staying informed with the latest data is essential.
EUR/NZD D1 technical analysis chart
EUR/NZD D1 Technical Analysis for 09.12.2026

EUR/NZD Forecast — 5 September 2026

Time Zone: GMT +3

Time Frame: Daily (D1) / Weekly Outlook

Weekly Fundamental Overview:

The fundamental outlook for EUR/NZD is anchored by upcoming European central bank communications and monetary decisions, which could impact euro strength. Meanwhile, the New Zealand dollar remains sensitive to broader risk appetite and global market sentiment.

Price Action:

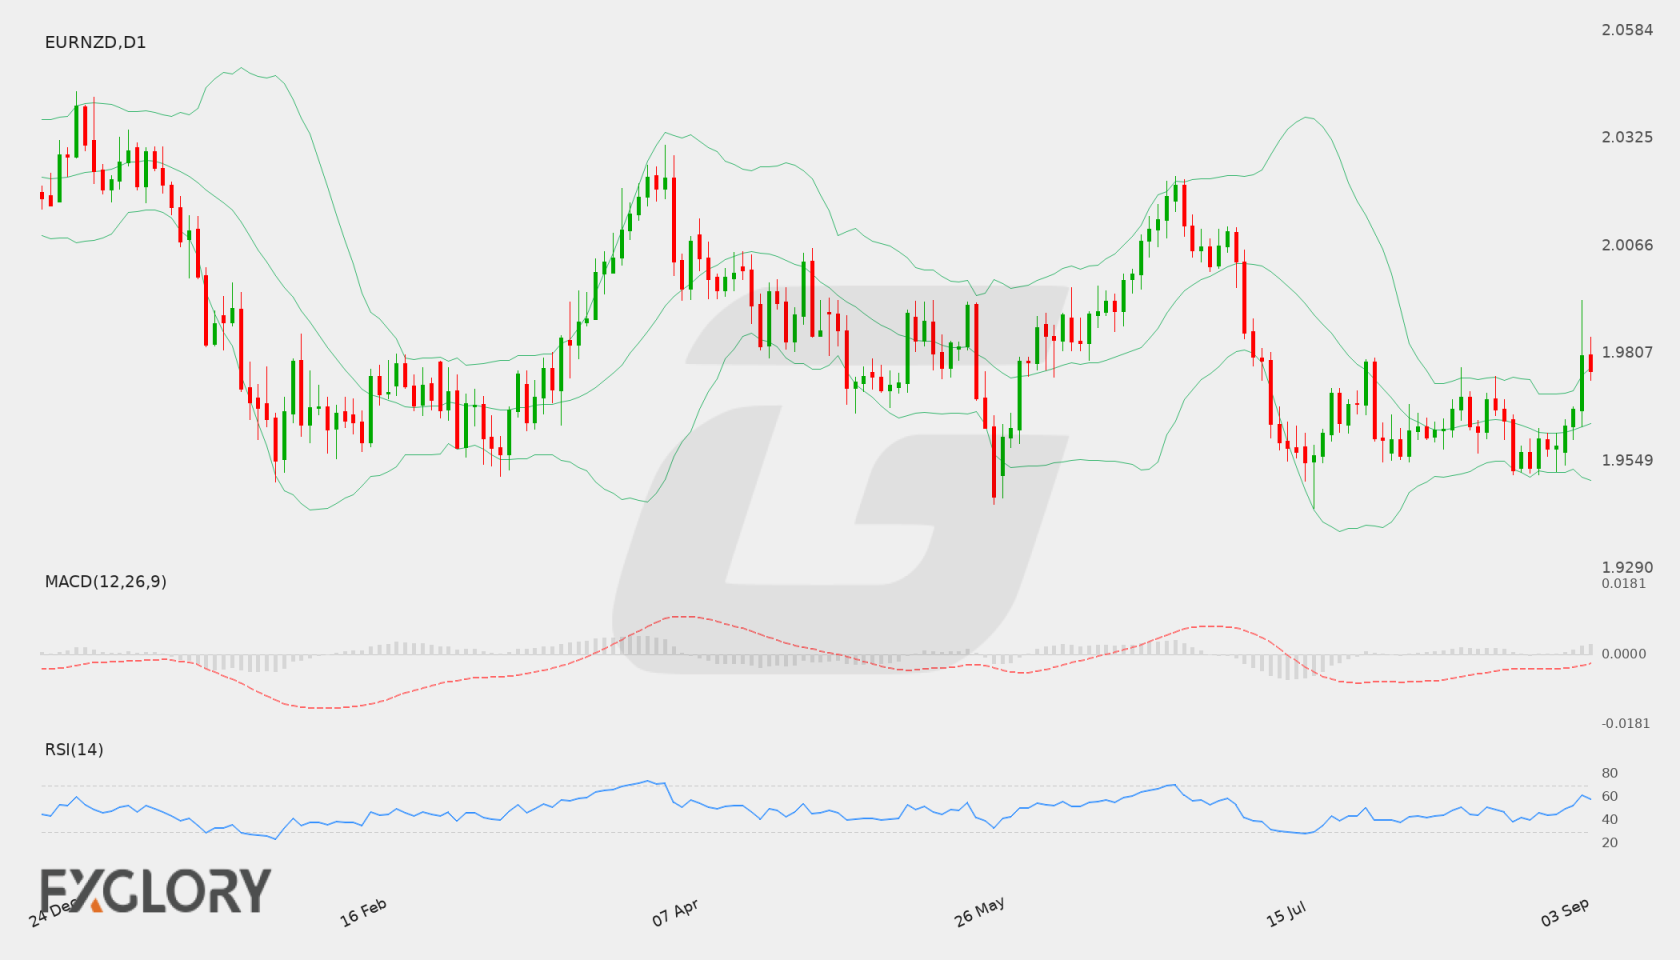
EUR/NZD daily price action demonstrates a bounce from recent lows near 1.95328, pushing towards a high of 1.98018 before settling at a close of 1.97645. The sequence of higher daily highs signals active buying interest in the short term.

Key Technical Indicators:

Bollinger Bands: The daily Bollinger Bands show the middle line at 1.96380, the lower band at 1.95023, and the upper band at 1.97736. The last close at 1.97645 places EUR/NZD near the upper boundary, reflecting increased upward price pressure.

RSI: The 14-period RSI currently sits at 58.11, holding above the neutral 50 level. This points to moderate bullish sentiment without indicating overbought conditions.

MACD: The MACD indicator registers a reading of 0.000255, remaining slightly above the signal line and zero threshold. This indicates positive, albeit modest, bullish momentum on the daily chart.

Support and Resistance:

Key technical levels for EUR/NZD feature critical support at 1.94349 and primary resistance at 2.02330. The middle Bollinger Band around 1.96380 serves as a dynamic intermediate reference point.

News to Watch for EURNZD This Week:

  • Monetary Policy Statement: This release outlines official views on economic conditions and monetary policy direction that can shift euro valuation.
  • Main Refinancing Rate: Benchmark interest rate decisions directly influence capital flows and European currency demand.
  • ECB Press Conference: Detailed commentary from policy makers provides insights into future rate paths and economic prospects.

Weekly Outlook and Consideration:

EUR/NZD enters the week with a positive short-term tilt after closing at 1.97645, near its upper Bollinger Band of 1.97736. Supported by an RSI of 58.11 and a positive MACD value, the pair shows potential to test higher ground towards resistance at 2.02330 if buying interest holds. Conversely, a drop below the middle Bollinger Band at 1.96380 could see price retreat towards primary support at 1.94349.

Disclaimer: The analysis provided for EUR/NZD is for informational purposes only and does not constitute investment advice. Traders are encouraged to perform their own analysis and research before making any trading decisions. Market conditions can change quickly, so staying informed with the latest data is essential.
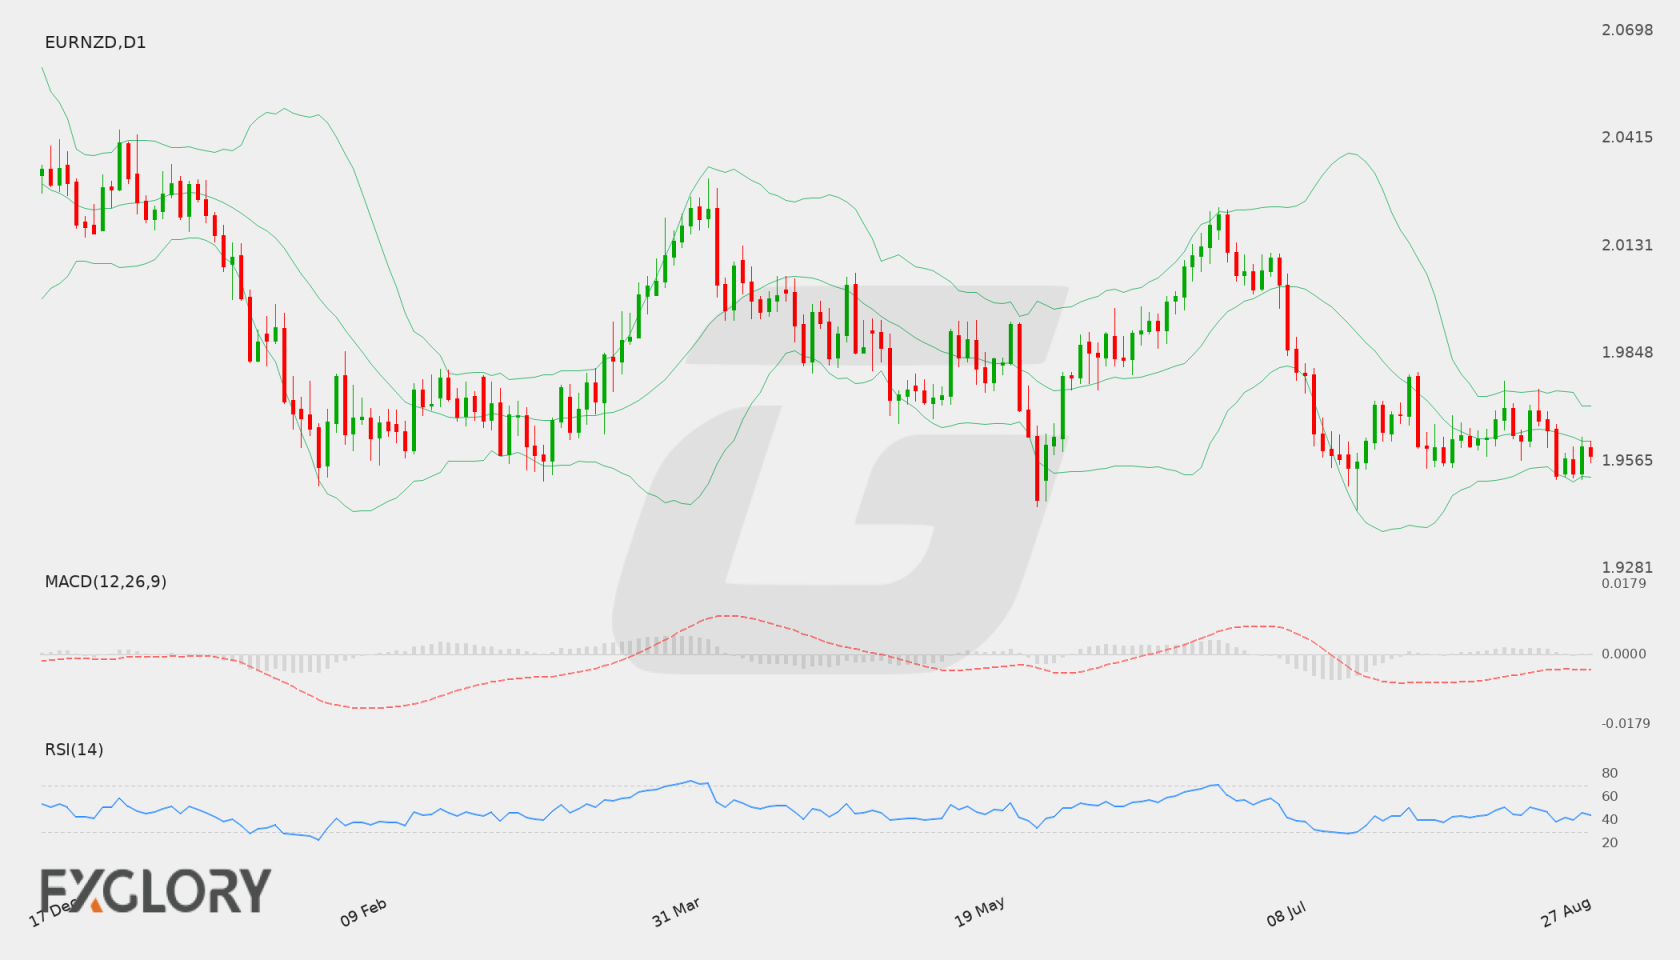
EUR/NZD D1 technical analysis chart
EUR/NZD D1 Technical Analysis for 09.05.2026

EUR/NZD Forecast — 29 August 2026

Time Zone: GMT +3

Time Frame: Daily (D1) / Weekly Outlook

Weekly Fundamental Overview:

The EUR/NZD pair reflects shifting market sentiment driven by economic trends across the Eurozone and New Zealand. Key focus remains on Eurozone inflation metrics alongside upcoming monetary policy announcements from the Reserve Bank of New Zealand, which may influence the relative strength of the Euro against the New Zealand Dollar.

Price Action:

On the Daily (D1) chart, EUR/NZD recently closed at 1.95785. The pair has experienced a gradual retracement from recent highs, trading below recent consolidation levels and continuing to demonstrate a cautious downward trajectory.

Key Technical Indicators:

Bollinger Bands: The Bollinger Bands indicator on the daily chart displays a middle band at 1.96159, an upper band at 1.97101, and a lower band at 1.95216. The close at 1.95785 below the middle band signals lingering downward pressure toward the lower band boundary.

RSI: The Relative Strength Index (RSI) with a 14-day period is currently at 44.47. Sitting below the 50 level, the RSI reflects a modest bearish bias without reaching oversold territory.

MACD: The MACD indicator reads -0.00385, remaining below the signal line and in negative territory. This indicates persistent bearish momentum on the D1 timeframe.

Support and Resistance:

Key technical boundaries for EUR/NZD include a primary support level at 1.94349 and a main resistance level at 2.02330. Intermediate dynamic resistance is located near the upper Bollinger Band at 1.97101.

News to Watch for EURNZD This Week:

  • German Prelim CPI m/m: This event provides early inflation figures for Germany that can impact Euro valuation.
  • CPI Flash Estimate y/y: Headline inflation tracking across the Eurozone serves as a primary driver for Euro interest rate expectations.
  • Core CPI Flash Estimate y/y: Excluded volatile items data offers a clearer view of underlying price pressures in the European economy.
  • RBNZ Rate Statement: Statements accompanying the policy decision outline economic assessments that affect the New Zealand Dollar.
  • Official Cash Rate: The key interest rate decision directly influences New Zealand Dollar yield prospects and market liquidity.
  • RBNZ Monetary Policy Statement: Detailed economic projections provide broader context regarding the central bank's medium-term policy path.
  • RBNZ Press Conference: Live remarks from central bank officials may clarify upcoming monetary policy directions.

Weekly Outlook and Consideration:

The weekly outlook for EUR/NZD (EURNZD) points toward a consolidated to slightly bearish bias. With the current close at 1.95785 positioned beneath the 1.96159 middle Bollinger Band and the RSI at 44.47, sellers maintain control of short-term direction. A drop below the lower Bollinger Band at 1.95216 could open paths toward primary support at 1.94349. Conversely, a reversal upward would first test resistance around 1.97101 before targeting higher resistance at 2.02330. Upcoming Eurozone inflation releases and RBNZ rate decisions will likely act as key catalysts.

Disclaimer: The analysis provided for EUR/NZD is for informational purposes only and does not constitute investment advice. Traders are encouraged to perform their own analysis and research before making any trading decisions. Market conditions can change quickly, so staying informed with the latest data is essential.

EUR/NZD D1 technical analysis chart
EUR/NZD D1 Technical Analysis for 08.29.2026
1EUR = –––NZD –––% ▼
EURNZD
Loading chart...