Time Zone: GMT +3
Time Frame: Daily (D1) / Weekly Outlook
Weekly Fundamental Overview:
Economic conditions across the Eurozone continue to be evaluated as traders monitor inflation trends and central bank policy expectations. Broader macroeconomic dynamics in Europe and the UK remain central to defining the fundamental background for EUR/GBP.
Price Action:
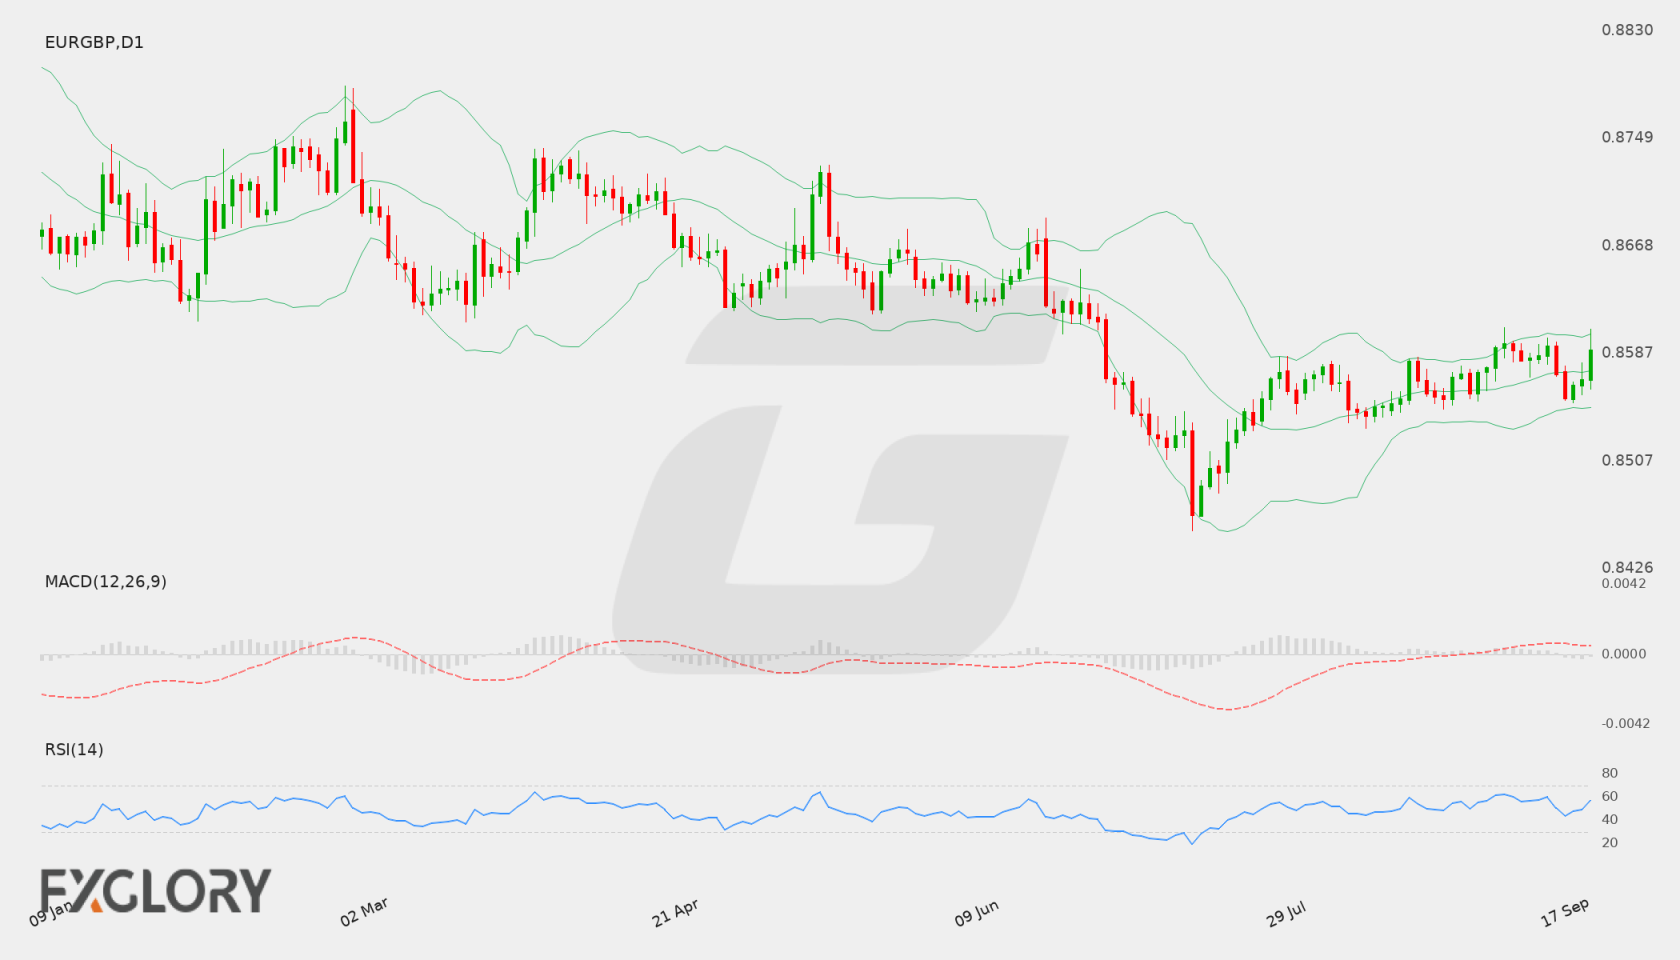
The daily chart for EUR/GBP reveals a recent upward push, with the instrument closing at 0.85897 after advancing from recent daily lows. Price action demonstrates buying interest above key moving averages, keeping short-term momentum tilted to the upside.
Key Technical Indicators:
Bollinger Bands: The Bollinger Bands on the D1 chart reflect a middle band at 0.85742, an upper band at 0.86018, and a lower band at 0.85467. With the latest close at 0.85897, price action is hovering near the upper boundary, pointing to heightened bullish momentum.
RSI: The 14-day Relative Strength Index (RSI) stands at 56.94. This reading above the 50 level indicates mild buyer control while remaining clear of overbought territory.
MACD: The daily MACD indicator holds a positive reading of 0.000373. Positioned above the signal line, it suggests that upward momentum remains active on the daily timeframe.
Support and Resistance:
Key technical levels for EUR/GBP include a primary support level at 0.8454 and a resistance level at 0.86506. These parameters define the current daily trading framework.
News to Watch for EURGBP This Week:
- German Prelim CPI m/m: This metric provides preliminary monthly inflation data for Germany.
- CPI Flash Estimate y/y: This release reflects broad headline consumer price movements across the Eurozone.
- Core CPI Flash Estimate y/y: This measure tracks underlying Eurozone inflation by excluding volatile energy and food components.
Weekly Outlook and Consideration:
EUR/GBP enters the upcoming sessions with a bullish lean following its close at 0.85897. Technical indicators such as an RSI of 56.94 and a positive MACD value of 0.000373 support the potential for further tests toward the resistance zone at 0.86506. Conversely, a turn lower could see prices retreat back toward the middle Bollinger Band at 0.85742 or lower support at 0.8454.
Disclaimer: The analysis provided for EUR/GBP is for informational purposes only and does not constitute investment advice. Traders are encouraged to perform their own analysis and research before making any trading decisions. Market conditions can change quickly, so staying informed with the latest data is essential.