EURCHF Forecast

EUR/CHF Live Price

0.91853
-0.39%

EUR/CHF Forecast — 14 July 2025

Time Zone: GMT +3

Time Frame: 4 Hours (H4)

Fundamental Analysis:

The EUR/CHF pair represents the exchange rate between the Euro (EUR) and the Swiss Franc (CHF). Today, liquidity in EUR could be lower due to French banks observing the National Day holiday, typically resulting in irregular volatility. Meanwhile, the upcoming release from the Eurogroup meeting could significantly impact EUR movements depending on their policy stance and economic decisions. For CHF, traders are awaiting the Producer Price Index (PPI) from the Federal Statistical Office, a critical indicator influencing consumer inflation expectations and consequently CHF strength.

Price Action:

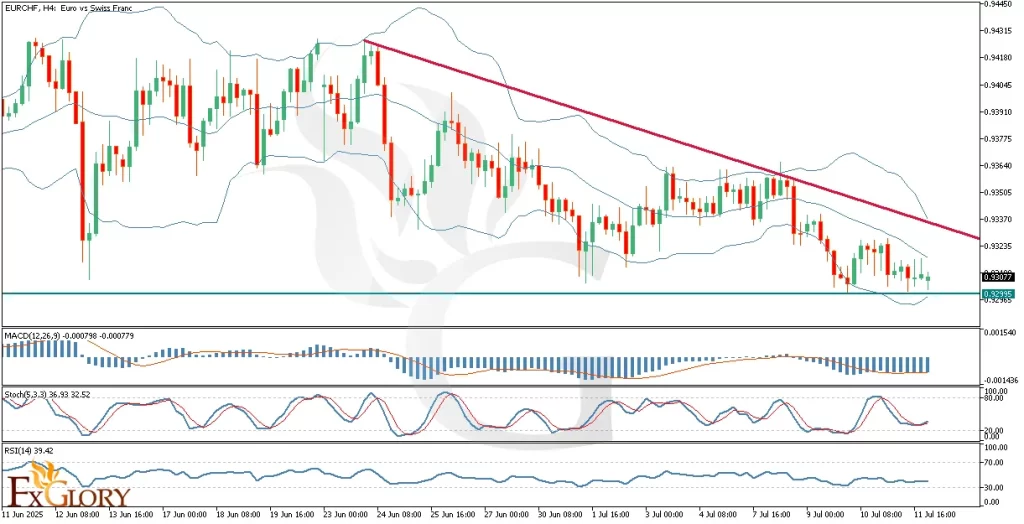
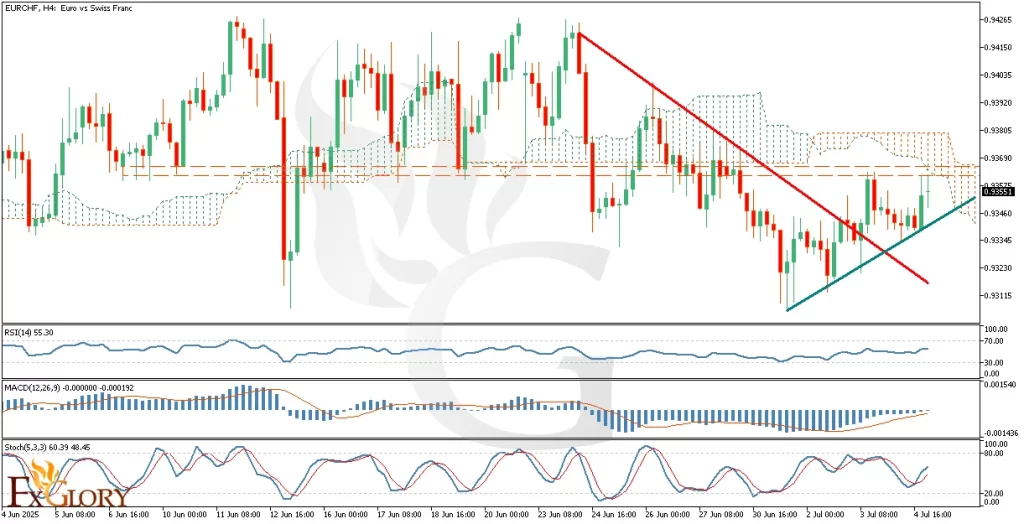
Analyzing the EUR-CHF pair on the H4 timeframe reveals a persistent bearish trend originating from around 2021. The price has recently approached the strong support zone around 0.92300, coinciding closely with the lower boundary of the Bollinger Bands, highlighting a Price Reversal Zone (PRZ). However, recent bearish momentum seems robust, indicating the current bullish attempts might merely be corrections, and a retest of the 0.92300 support level could be imminent.

Key Technical Indicators:

Bollinger Bands: The Bollinger Bands are indicating a tight range at the bottom band near the 0.92300 support level, suggesting potential for a reversal or consolidation. Nevertheless, the recent price action’s proximity to the lower band emphasizes ongoing bearish pressure, cautioning traders about potential downward continuation.

MACD (Moving Average Convergence Divergence): MACD shows a slight bullish crossover, reflected by the MACD line marginally above the signal line, yet the histogram remains negative. This signals that while there might be a temporary correction upward, the overall bearish momentum remains dominant.

Stochastic Oscillator: The Stochastic oscillator, currently positioned around 36.93, shows mixed signals with no clear indication of overbought or oversold conditions. Its mid-range position suggests that the market is indecisive at this moment, signaling cautious trading.

RSI (Relative Strength Index): RSI stands at 39.42, firmly in bearish territory below 50, indicating continued bearish sentiment. The RSI highlights the potential for further downward moves before approaching oversold levels.

Support and Resistance:

Support: Immediate and critical support level is at 0.92300, closely aligned with the current PRZ and the Bollinger Bands’ lower line.

Resistance: The significant resistance is located around the descending trendline near 0.93300, serving as a key barrier to any bullish correction.

Conclusion and Consideration:

EUR CHF’s H4 chart shows a continuation of bearish momentum despite potential correction efforts. Technical indicators support sustained bearish sentiment, though temporary upward corrections are possible due to the proximity of the support zone and Bollinger Bands. Fundamental developments from today’s EUR and CHF news could significantly influence the pair, especially given expected irregular volatility due to the French bank holiday and the forthcoming PPI release from Switzerland.

Disclaimer: The analysis provided for EUR/CHF is for informational purposes only and does not constitute investment advice. Traders are encouraged to perform their own analysis and research before making any trading decisions on EURCHF. Market conditions can change quickly, so staying informed with the latest data is essential.

EURCHF_H4_Technical_and_Fundamental_Analysis_For_2025-07-14

EUR/CHF Forecast — 7 July 2025

Time Zone: GMT +3

Time Frame: 4 Hours (H4)

Fundamental Analysis:

Today, the EUR-CHF currency pair faces a mix of scheduled economic releases and central bank insights that could influence intraday price action. On the Euro side, traders are watching key data such as German Industrial Output and Retail Sales, which are leading indicators of economic health. Additionally, ECB Governing Council member Joachim Nagel is set to speak, and any hawkish tone from him may lift the Euro. Meanwhile, for the Swiss Franc, the SNB’s release on foreign currency reserves could impact CHF strength depending on whether their holdings imply defensive measures against EURCHF depreciation. Broader BRICS geopolitical developments may also influence both currencies. Overall, sentiment remains cautious with potential volatility.

Price Action:

The bigger picture on the EUR-CHF H4 chart shows prolonged sideways movement, with a noticeable pattern of long-wicked candles, frequent doji, and pin bars—clear signs of market indecision and unstable momentum. Recently, the pair broke above a short-term descending trendline, suggesting temporary bullish pressure. However, two major resistance barriers lie ahead: a horizontal resistance zone and the flat Senkou Span B from the Ichimoku Cloud, both known for rejecting price action. Despite the breakout, this remains a challenging chart to trade, with no clear directional commitment.

Key Technical Indicators:

Ichimoku Cloud: Price is still below the cloud, indicating a bearish bias. The flat Senkou Span B acts as key resistance, while flat Kijun-sen and Tenkan-sen suggest range-bound conditions. A break above the cloud is needed for a bullish shift.

RSI (Relative Strength Index): RSI at 55.30 shows slight bullish momentum. It’s above the neutral level but not overbought, leaving room for further gains if resistance levels are cleared.

MACD (Moving Average Convergence Divergence): MACD hints at a potential bullish crossover. The histogram shows fading bearish pressure, but the signal is weak and needs confirmation from price movement.

Stochastic Oscillator: Stochastic lines are in a bullish crossover near 60, indicating upward momentum. However, it remains neutral overall, with a risk of reversal near resistance.

Support and Resistance Levels:

Support: The ascending trendline around 0.9330 offers immediate support, backed by recent higher lows and price bounce activity.

Resistance: Strong resistance is seen at 0.9360–0.9370, marked by previous horizontal highs and the flat Senkou Span B, which often halts upward movement.

Conclusion and Consideration:

The EUR/CHF pair on the H4 timeframe reflects a delicate balance between short-term bullish attempts and broader bearish pressure, consistent with a classic consolidation phase. Technical indicators hint at a possible bullish continuation if resistance levels break, but no solid confirmation is in place yet. Fundamental catalysts from both EUR and CHF today may drive the next significant move. Traders are advised to stay cautious and wait for a confirmed breakout or rejection from current resistance zones before entering a position.

Disclaimer: The analysis provided for EUR/CHF is for informational purposes only and does not constitute investment advice. Traders are encouraged to perform their own analysis and research before making any trading decisions on EURCHF. Market conditions can change quickly, so staying informed with the latest data is essential.

EURCHF_H4_Technical_and_Fundamental_Analysis_For_2025-07-07

EUR/CHF Forecast — 10 March 2025

Time Zone: GMT +2

Time Frame: 4 Hours (H4)

Fundamental Analysis

The EURCHF currency pair will be influenced by multiple forthcoming economic reports and events. On the Euro (EUR) side, market participants await the Destatis data releases on industrial production and trade balance (slated for April 7, 2025), as well as the Eurogroup meeting on April 11, 2025. Stronger-than-forecast figures could boost the EUR, while cautious commentary from Eurozone officials could dampen sentiment. Meanwhile, the Swiss Franc (CHF) reacts to SECO’s consumer climate data (due April 10, 2025); a better-than-expected reading may fortify the CHF, potentially adding downside pressure on EURCHF.

Price Action

On the H4 chart, EURCHF broke above a key resistance near 0.9523 and is now retesting this region as potential support. The pair is hovering around the middle Bollinger Band, which can act as a dynamic support. Bollinger Bands are narrowing, implying lower volatility prior to a probable expansion. If price action respects the 0.9523 level, the uptrend may continue, whereas a clear break below it could signal a deeper pullback.

Key Technical Indicators

Bollinger Bands: The Bollinger Bands on EURCHFH4 have been tightening, typically a precursor to a volatility surge. Price is testing the middle band, indicating a support zone that may help sustain the recent breakout. A move above the upper band could confirm bullish momentum continuation.

RSI (Relative Strength Index): Currently around 54, the RSI signals moderate bullish momentum without entering overbought territory. This leaves room for additional upside, though a drop below the 50 mark would hint at weakening bullish interest and an increased chance of further correction.

MACD (Moving Average Convergence Divergence): The MACD line remains above the signal line, albeit with a contracting histogram. While this setup still leans bullish, diminishing momentum points to a possibility of a short-term retracement. Traders should watch for a bearish crossover to confirm any deeper pullback.

Williams %R (Williams Percent Range) Hovering near oversold conditions (around -90), Williams %R suggests that selling pressure could be losing steam. A climb above -80 would indicate a shift back into bullish territory, aligning with a potential resumption of the uptrend.

Support and Resistance

Support: Immediate support is located at 0.9523, which aligns with a recently broken resistance level and the middle Bollinger Band.

Resistance: The nearest resistance level is at 0.9600, which corresponds to a minor psychological barrier and recent swing high.

Conclusion and Consideration

The EURCHFH4 technical and fundamental chart daily analysis points to a cautiously bullish outlook, contingent on the 0.9523 support zone holding firm. Key technical indicators, including Bollinger Bands, RSI, MACD, and Williams %R, suggest that the uptrend could continue if buyers defend this level. However, traders should closely monitor upcoming Eurozone (Destatis, Eurogroup) and Swiss (SECO) data releases, as unexpected readings may trigger volatility and alter EURCHF’s price action.

Disclaimer: The analysis provided for EUR/CHF is for informational purposes only and does not constitute investment advice. Traders are encouraged to perform their own analysis and research before making any trading decisions on EURCHF. Market conditions can change quickly, so staying informed with the latest data is essential.

EURCHF-Analysis-For-03.10

EUR/CHF Forecast — 27 January 2025

Time Zone: GMT +2

Time Frame: 4 Hours (H4)

Fundamental Analysis:

The EUR/CHF exchange rate is influenced today by key speeches from central bank officials. ECB President Christine Lagarde is scheduled to speak at an event hosted by the Hungarian National Bank. Her remarks will be closely monitored for any clues regarding future monetary policy, as they could impact the euro’s strength. Meanwhile, SNB Chairman Martin Schlegel will participate in a televised interview, potentially offering insights into the Swiss National Bank’s policy outlook. Both events are expected to add volatility to the EUR-CHF forex pair, with traders bracing for significant movements in the euro to Swiss franc rate.

Price Action:

The EURCHF exchange rate exhibits strong bullish momentum on the H4 chart, with a breakout above the significant 0.94314 level, now acting as support. The pair recently approached the 100% Fibonacci Expansion level at 0.95000, where it faced selling pressure, resulting in a bearish reaction. This suggests a potential short-term correction, as the market consolidates gains before continuing higher. The pullback is a natural reaction following the breakout of a critical level, and a re-test of the 0.94314 zone could provide a stronger base for the euro-Swiss franc rate to resume its uptrend.

Key Technical Indicators:

Bollinger Bands: The Bollinger Bands on the EUR/CHF chart have widened, signaling increased volatility. The euro-franc currency pair is currently testing the upper band, indicating overbought conditions. A move toward the middle band could signal a healthy correction before the next upward push.

RSI (Relative Strength Index): The RSI is currently at 65.27, nearing the overbought territory. This confirms strong bullish momentum in the euro-Swiss franc trading but also suggests the potential for a short-term pullback before further upward movement.

MACD (Moving Average Convergence Divergence): The MACD line remains above the signal line, with the histogram reflecting bullish momentum. However, the histogram shows slight divergence, indicating weakening buying pressure and aligning with the expectation of a short-term correction in the EUR-CHF exchange rate.

Support and Resistance:

Support: Key support is found at the 0.94314 level, a previously broken resistance now acting as a floor for the euro-Swiss franc market. Further support is located near 0.94000, in line with the lower Bollinger Band.

Resistance: Resistance is positioned at 0.95000, aligning with the 100% Fibonacci Expansion level, which triggered the recent bearish reaction. A sustained breakout above this level could see the EUR CHF trading rate aiming for the 0.95500 zone.

Conclusion and Consideration:

The EURCHF forex market remains bullish, with a breakout and re-test of the 0.94314 support indicating strong upward potential. Short-term corrections are expected as the pair consolidates below the 100% Fibonacci Expansion level at 0.95000. Traders should closely monitor ECB President Lagarde and SNB Chairman Schlegel’s speeches for insights into euro-Swiss franc policy directions. These events are likely to influence the EUR-CHF market’s next move.

Disclaimer: The analysis provided for EUR/CHF is for informational purposes only and does not constitute investment advice. Traders are encouraged to perform their own analysis and research before making any trading decisions on EURCHF. Market conditions can change quickly, so staying informed with the latest data is essential.

EUR_CHF_H4_Technical_and_FUndamental_Analysis_for_01_27_2025

EUR/CHF Forecast — 7 May 2024

Time Zone: GMT +3

Time Frame: 4 Hours (H4)

Fundamental Analysis:

Recent economic data releases across Europe provide a mixed yet cautiously optimistic outlook for the Euro, influencing the EUR/CHF exchange rate. The performance in service sectors across major European economies has generally exceeded expectations:

Spanish Services PMI reported at 56.2, slightly above the forecast and previous figures, suggesting robustness in Spain’s service sector.

Italian Services PMI showed a minor dip to 54.3 from 54.6, indicating a slight contraction but still reflecting overall sectoral strength.

French Final Services PMI marked a significant improvement to 51.3 against a forecast of 50.5, pointing to expansion contrary to expectations.

German Final Services PMI and the overall Eurozone Final Services PMI both posted solid figures, indicating ongoing resilience in the services sector despite broader economic challenges.

Additionally, the Sentix Investor Confidence index improved to -3.6, better than both the previous -5.9 and the expected -4.8, suggesting a recovery in investor sentiment within the Eurozone.

Price Action:

The EUR/CHF pair has responded to these economic indicators with a notable trend on the H4 chart. After a recent pullback to the 38.2% Fibonacci retracement level, the pair is potentially setting up for a bullish reversal. This technical posture is supported by the RSI which remains neutral, hinting at neither overbought nor oversold conditions, thus supporting a potential for price recovery.

The combination of stronger-than-expected service sector performance and improving investor confidence could underpin the Euro’s strength against the Swiss Franc. Technically, the EUR/CHF pair seems primed for a bullish movement, suggesting an opportune moment for traders to consider long positions, especially as the market sentiment aligns with these fundamental improvements on EURCHF forex pair.

Key Technical Indicators:

RSI Indicator: The Relative Strength Index is currently stabilizing around the mid-line, suggesting balanced market conditions without overt signals of overbought or oversold states. This stabilization is particularly noteworthy after the price touched the Fibonacci retracement, indicating that the pullback may have provided sufficient consolidation for a new bullish momentum.

Fibonacci Retracement: The 38.2% level has served as a strong support, bouncing the price into what could be an early phase of a bullish trend. The adherence to this Fibonacci level enhances the reliability of the bullish outlook in the near term.

Support and Resistance:

Support: The recent lows around 0.97270 provide a short-term support level.

Resistance: The recent high near 0.97900 and 0.98228 serve as resistance levels.

Conclusion and Consideration:

Given the current technical setup, the EUR/CHF is poised for potential upward movement, affirming the forex live analysis and bullish trend forecast. Traders should consider the strength at the 38.2% Fibonacci level as a solid basis for potential entries, with expectations of upward momentum as market conditions align with technical indicators. As always, it’s advisable to employ prudent risk management strategies, keeping an eye on any shifts in market sentiment or unexpected geopolitical events that could influence forex dynamics.

Disclaimer: The provided analysis is for informational purposes only and does not constitute investment advice. Traders should conduct their own research and analysis before making any trading decisions.

EURCHF Technical Analysis -H4- on 07.05.2024.rtf

1EUR = –––CHF –––%
EURCHF
Loading chart...