Time Zone: GMT +3
Time Frame: Daily (D1) / Weekly Outlook
Weekly Fundamental Overview:
CAD/JPY has experienced increased volatility as shifts in risk sentiment and commodity trends influence price movement. Market participants continue to watch fiscal updates and monetary policy signals that affect both the Canadian Dollar and the Japanese Yen.
Price Action:
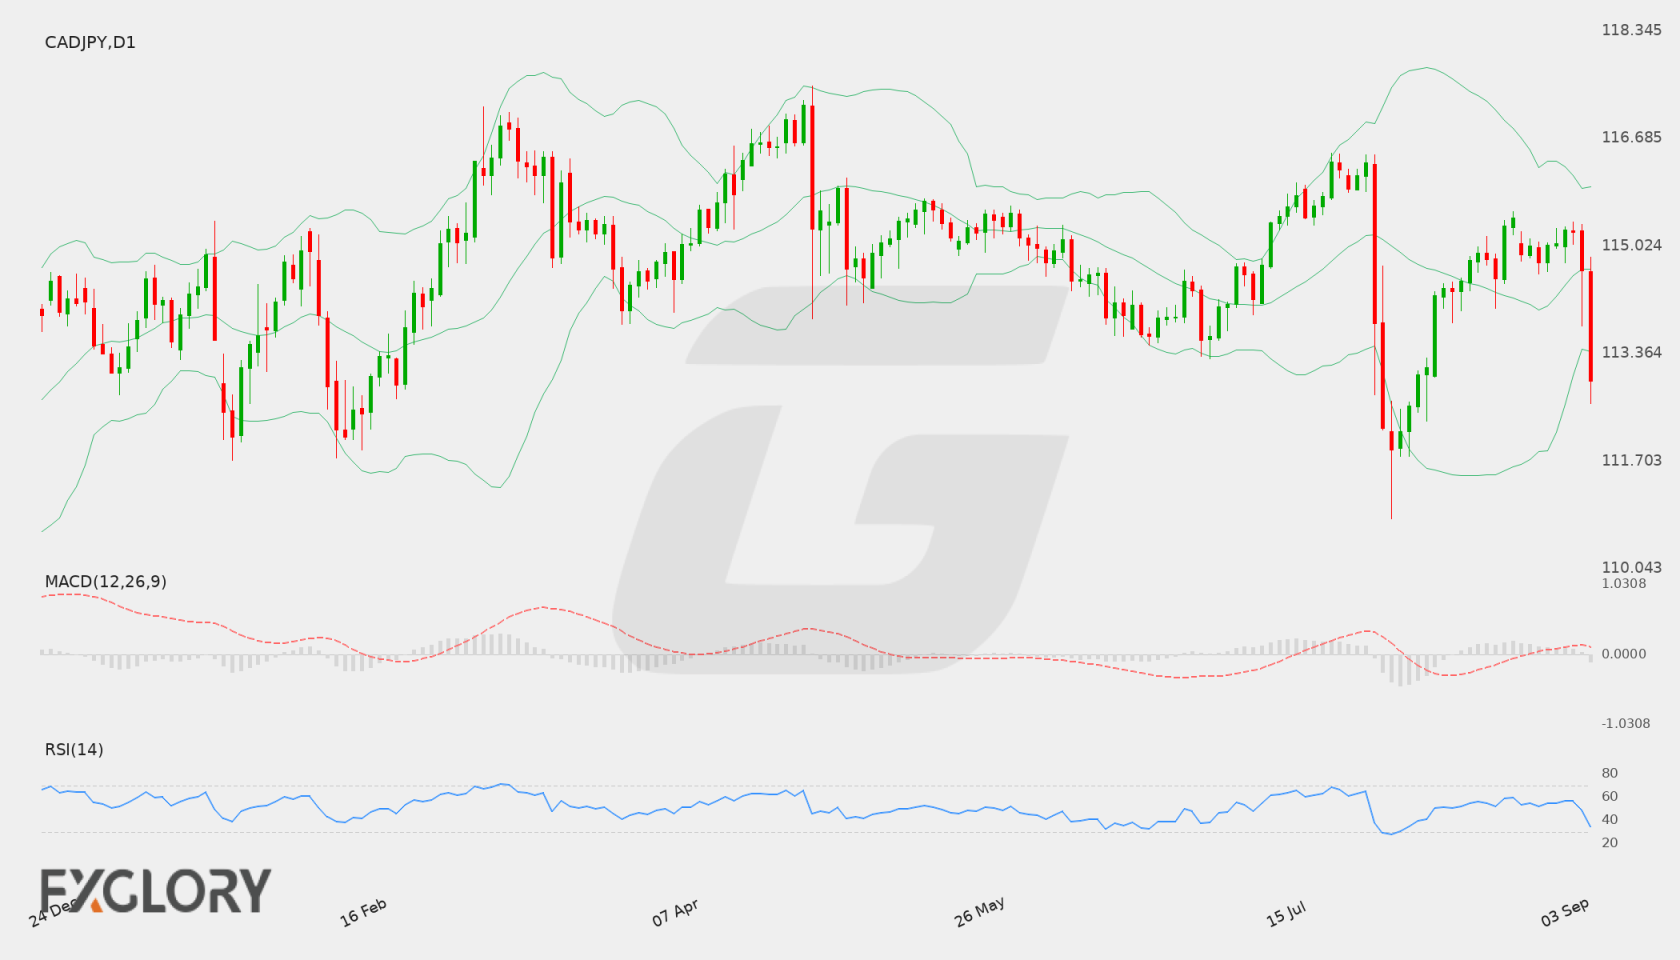
On the daily chart, CAD/JPY closed at 112.94 after a notable push downward from previous trading sessions.
Key Technical Indicators:
Bollinger Bands: Price is currently oscillating near the lower band, suggesting heightened selling pressure and potential oversold conditions in the short term.
RSI: The Relative Strength Index (RSI) is holding around 38, signaling weaker demand without yet reaching deep oversold territory.
MACD: The MACD histogram remains below the zero line, indicating sustained bearish momentum across recent sessions.
Support and Resistance:
Key support is established near 112.00, while immediate resistance is identified around 114.50.
News to Watch for CADJPY This Week:
- Traders should monitor upcoming Canadian CPI inflation reports and statements from Bank of Japan officials regarding yield curve control.
Weekly Outlook and Consideration:
Near-term outlook remains cautious with a slight bearish tilt unless buyers push price action back above the 114.50 resistance level.
Disclaimer: The analysis provided for CAD/JPY is for informational purposes only and does not constitute investment advice. Traders are encouraged to perform their own analysis and research before making any trading decisions. Market conditions can change quickly, so staying informed with the latest data is essential.