
CADJPY Forecast

CAD iconJPY icon
CAD/JPY

Canadian Dollar vs Japanese Yen

CAD/JPY Live Price

112.85100
-0.10%

CAD/JPY Forecast — 5 September 2026

Time Zone: GMT +3

Time Frame: Daily (D1) / Weekly Outlook

Weekly Fundamental Overview:

CAD/JPY has experienced increased volatility as shifts in risk sentiment and commodity trends influence price movement. Market participants continue to watch fiscal updates and monetary policy signals that affect both the Canadian Dollar and the Japanese Yen.

Price Action:

On the daily chart, CAD/JPY closed at 112.94 after a notable push downward from previous trading sessions.

Key Technical Indicators:

Bollinger Bands: Price is currently oscillating near the lower band, suggesting heightened selling pressure and potential oversold conditions in the short term.

RSI: The Relative Strength Index (RSI) is holding around 38, signaling weaker demand without yet reaching deep oversold territory.

MACD: The MACD histogram remains below the zero line, indicating sustained bearish momentum across recent sessions.

Support and Resistance:

Key support is established near 112.00, while immediate resistance is identified around 114.50.

News to Watch for CADJPY This Week:

  • Traders should monitor upcoming Canadian CPI inflation reports and statements from Bank of Japan officials regarding yield curve control.

Weekly Outlook and Consideration:

Near-term outlook remains cautious with a slight bearish tilt unless buyers push price action back above the 114.50 resistance level.

Disclaimer: The analysis provided for CAD/JPY is for informational purposes only and does not constitute investment advice. Traders are encouraged to perform their own analysis and research before making any trading decisions. Market conditions can change quickly, so staying informed with the latest data is essential.
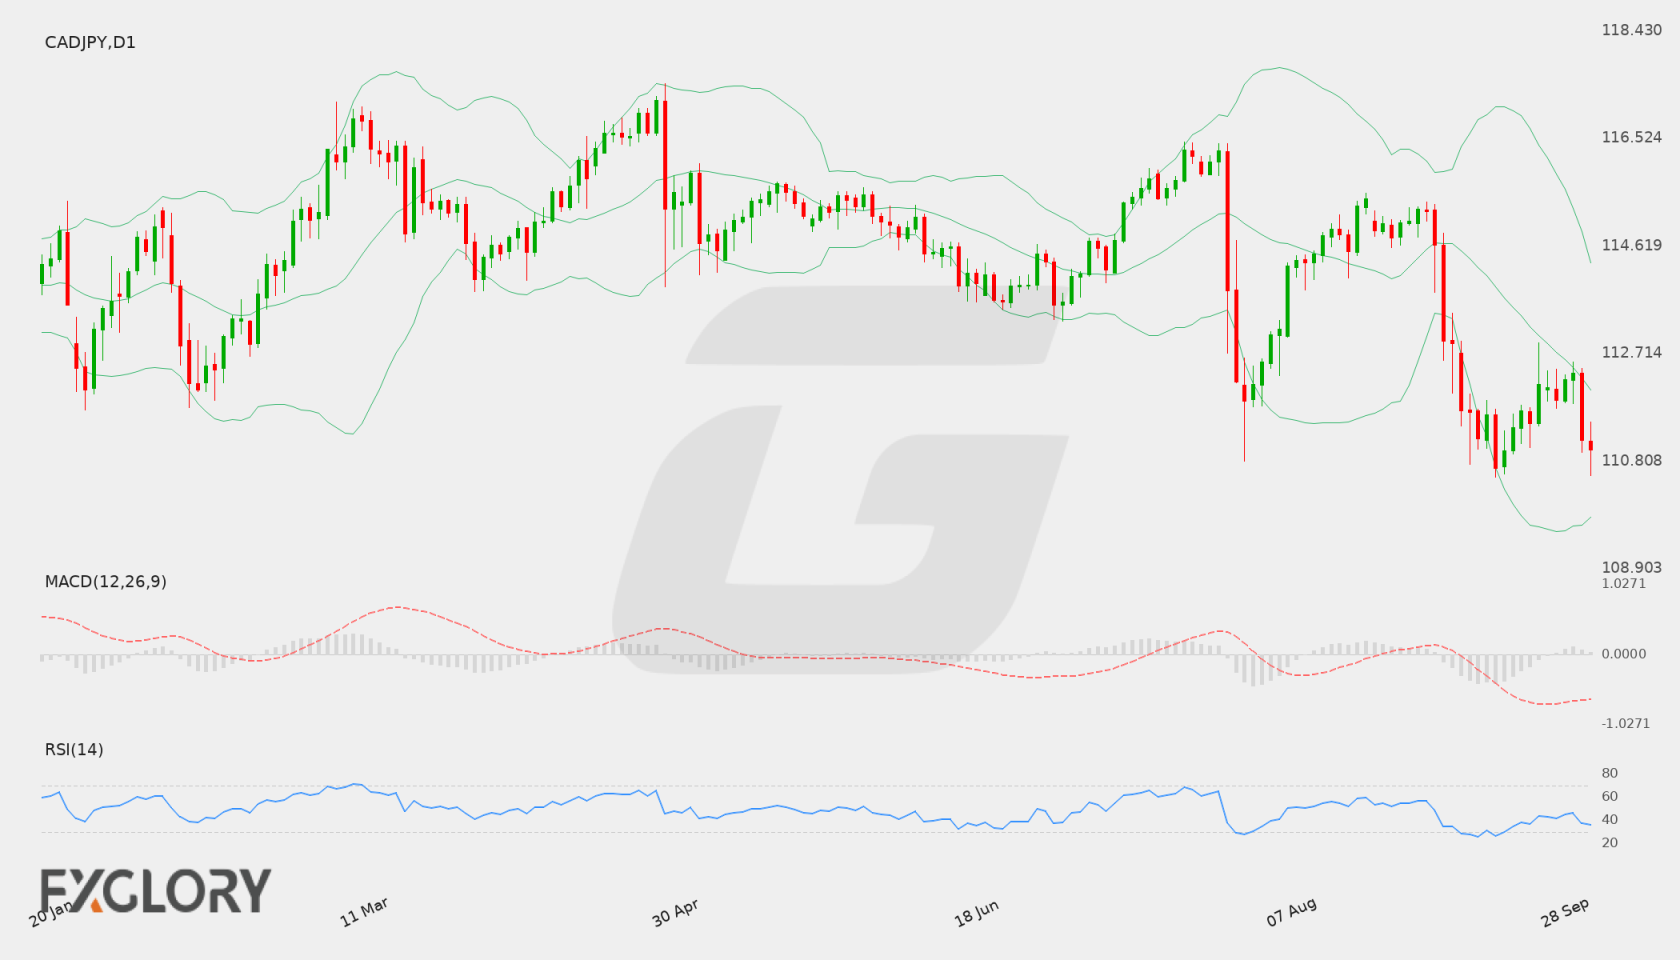
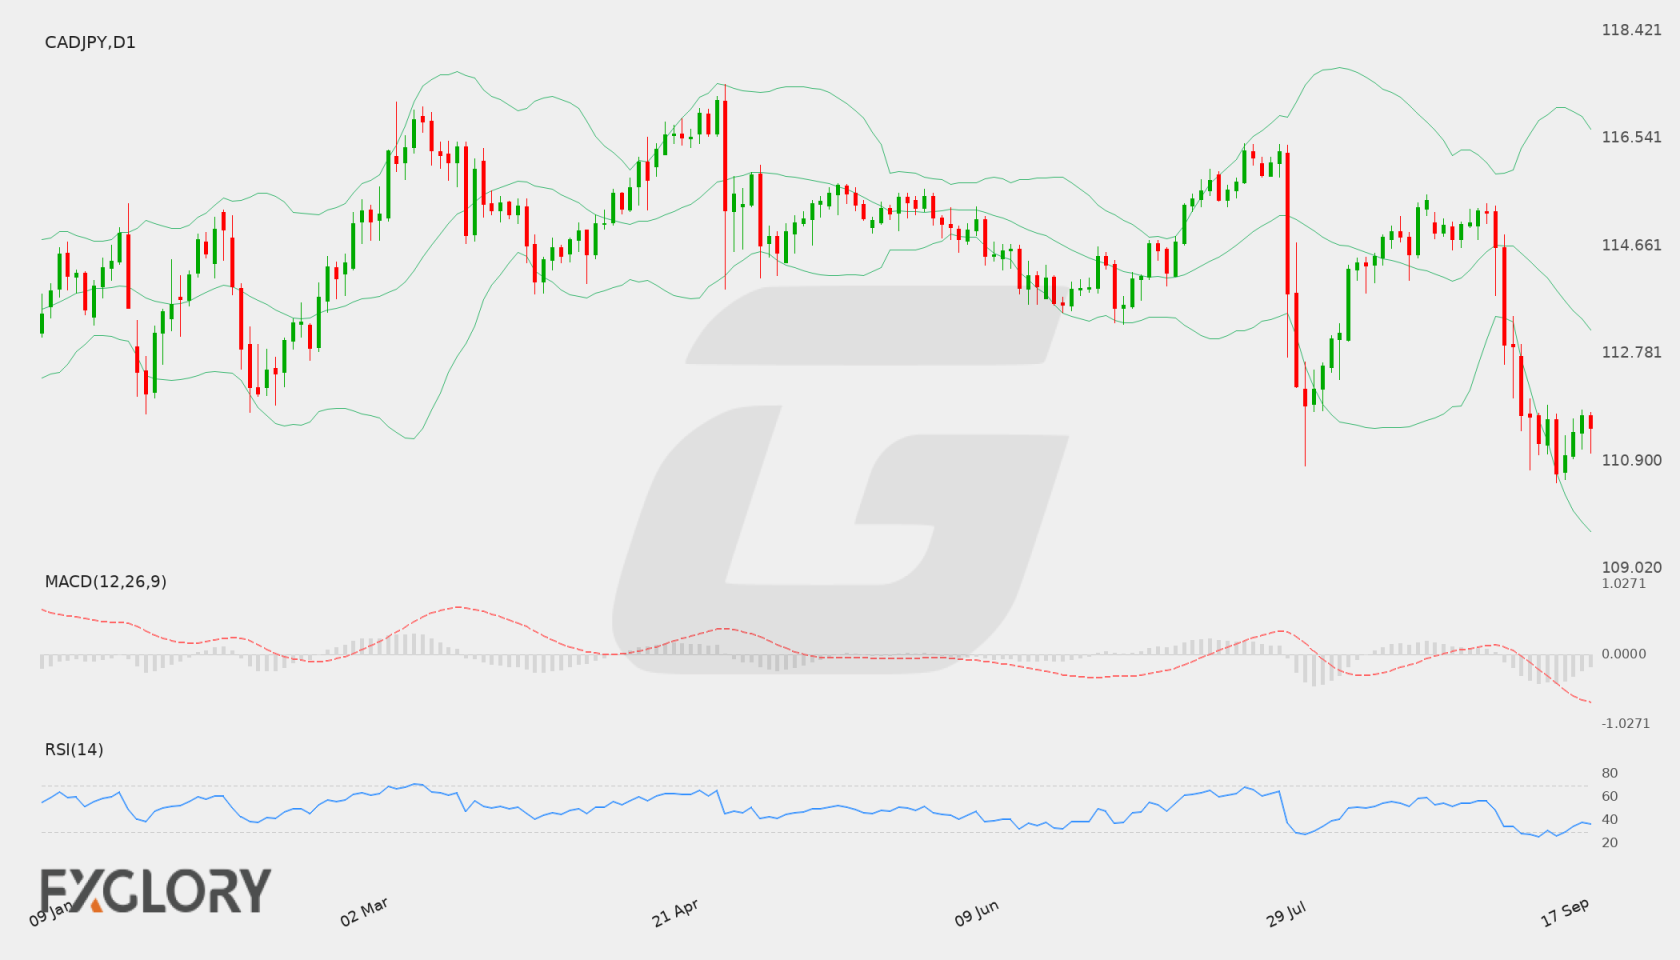
CAD/JPY D1 technical analysis chart
CAD/JPY D1 Technical Analysis for 09.05.2026

CAD/JPY Forecast — 29 August 2026

Time Zone: GMT +3

Time Frame: Daily (D1) / Weekly Outlook

Weekly Fundamental Overview:

Fundamental drivers for CAD/JPY center on central bank monetary policy updates from Canada and shifts in global risk sentiment affecting the Japanese Yen. Interest rate decisions and upcoming economic data from Canada remain focal points for near-term valuation.

Price Action:

On the D1 chart, CAD/JPY closed at 115.031, maintaining a position near its recent recovery highs after bouncing off lower support levels. Price movement reflects moderate upward traction following consolidation near the 114.50 region.

Key Technical Indicators:

Bollinger Bands: The daily Bollinger Bands show a middle band (20-day moving average) at 114.098, with the upper band at 116.333 and the lower band at 111.864. The price is currently situated above the middle band at 115.031, suggesting upside bias within the band structure.

RSI: The 14-day Relative Strength Index (RSI) stands at 54.35, placing the pair in neutral territory with a slight positive slope, well below overbought thresholds.

MACD: The D1 MACD indicator records a reading of 0.1557, positioned above the zero line, indicating positive momentum in the medium term.

Support and Resistance:

Key technical levels for CAD/JPY include primary support at 110.805 and primary resistance at 116.454. The middle Bollinger Band near 114.098 serves as intermediate dynamic support.

News to Watch for CADJPY This Week:

  • Overnight Rate: Central bank interest rate decisions directly influence capital flows and Canadian dollar valuation.
  • BOC Rate Statement: Official commentary provides insights into future monetary policy direction and economic assessments.
  • BOC Press Conference: Live responses from policymakers offer clarification on monetary policy and growth expectations.
  • Employment Change: Labor market data signals economic strength and potential consumer spending capacity.
  • Unemployment Rate: The overall jobless metric offers fundamental clarity on economic health.
  • Ivey PMI: Purchasing managers survey data measures broader monthly business activity trends.

Weekly Outlook and Consideration:

CAD/JPY demonstrates a mildly constructive stance on the D1 timeframe, trading at 115.031 above its middle Bollinger Band of 114.098. Positive MACD values at 0.1557 and a neutral RSI of 54.35 suggest potential for further upward testing toward resistance at 116.454. However, should price pressure turn downward, dynamic support at 114.098 and key support at 110.805 remain critical levels to watch. Upcoming economic releases may influence directional volatility throughout the week.

Disclaimer: The analysis provided for CAD/JPY is for informational purposes only and does not constitute investment advice. Traders are encouraged to perform their own analysis and research before making any trading decisions. Market conditions can change quickly, so staying informed with the latest data is essential.
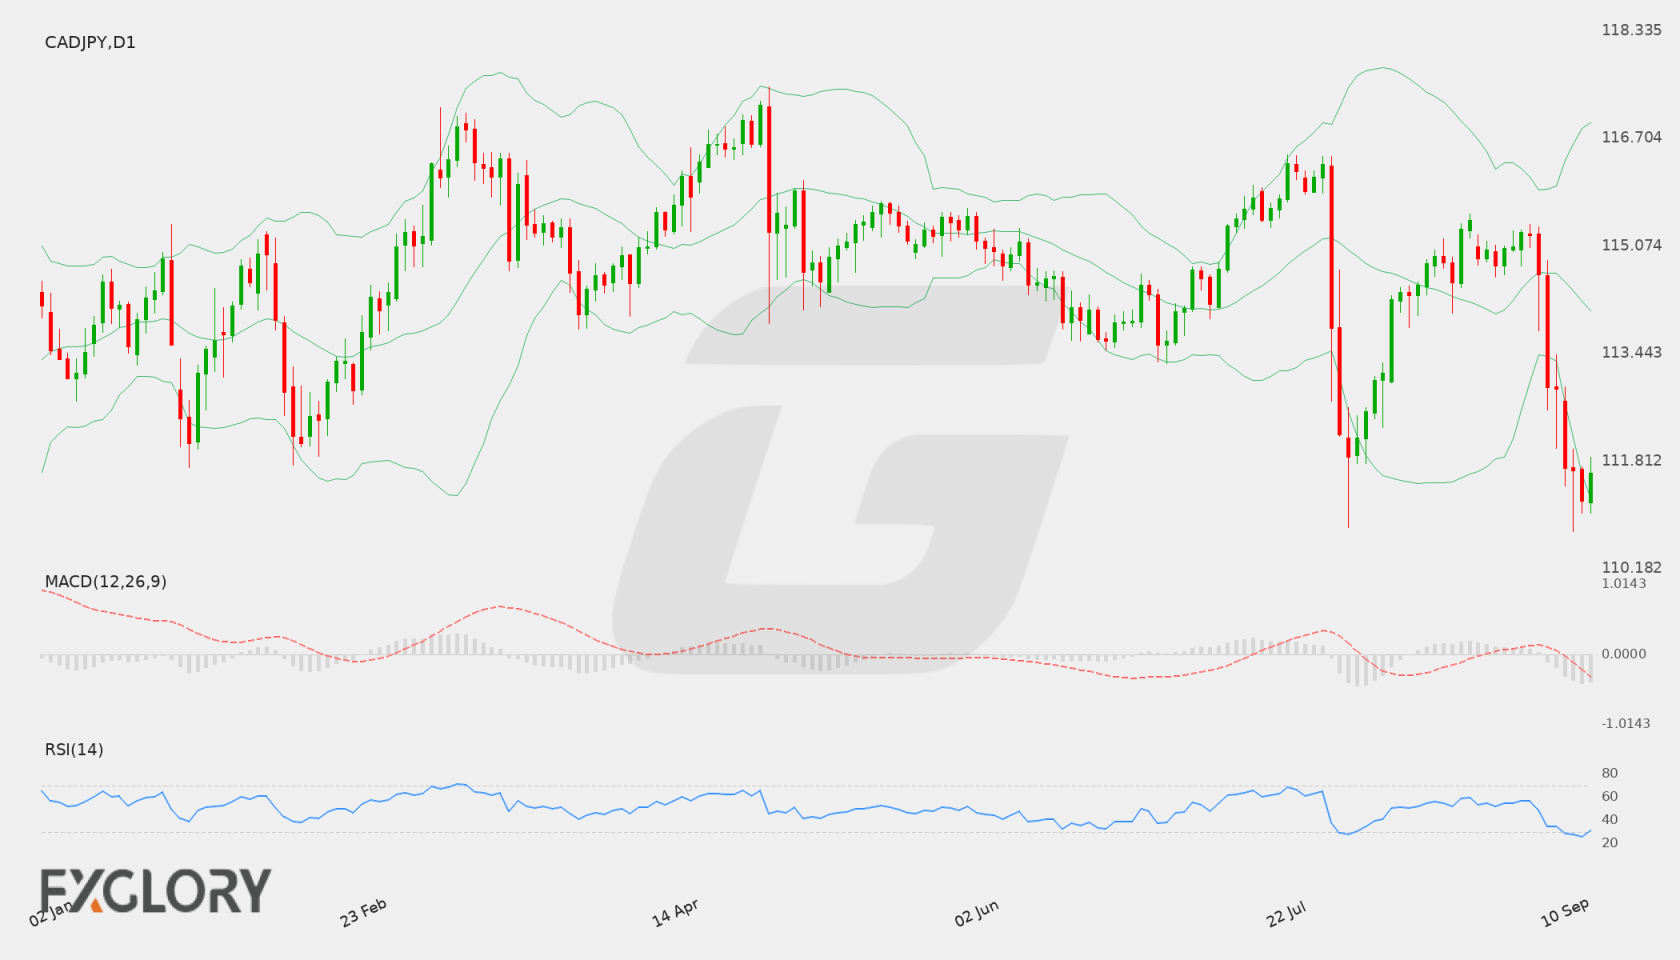
CAD/JPY D1 technical analysis chart
CAD/JPY D1 Technical Analysis for 08.29.2026

CAD/JPY Forecast — 22 August 2026

Time Zone: GMT +3

Time Frame: Daily (D1) / Weekly Outlook

Weekly Fundamental Overview:

The CAD/JPY currency pair reflects ongoing market dynamics between Canada’s economic trajectory and Japan’s domestic price environment. CAD/JPY has recently demonstrated upward momentum toward 115.329, influenced by shifting interest rate expectations and global risk sentiment. Traders are keeping a close watch on key macroeconomic releases from both nations to evaluate the durability of the current market trend.

Price Action:

On the daily chart, CAD/JPY bounced from a recent low at 110.805 and built a sequence of higher closes to reach 115.329. The sustained buying pressure over recent daily sessions demonstrates strong short-term bullish control, positioning price action closer to key overhead resistance at 116.454.

Key Technical Indicators:

Bollinger Bands: The Daily Bollinger Bands display a middle line at 114.258, an upper band at 116.962, and a lower band at 111.555. With CAD/JPY closing at 115.329 above the middle band, the price positioning indicates a favorable bullish posture within the current band range.

RSI: The 14-period Relative Strength Index (RSI) on the daily timeframe stands at 58.50. Positioned above the neutral 50 threshold while remaining below overbought territory, the RSI signals moderate buying interest for the pair.

MACD: The D1 MACD indicator registers at 0.057, holding in positive territory. This positive reading reflects active bullish momentum for CAD/JPY, though market participants monitor for any loss of upside momentum as price approaches upper resistance levels.

Support and Resistance:

Key technical levels on the daily timeframe place major support at 110.805 and key resistance at 116.454. The middle Bollinger band at 114.258 serves as initial downside dynamic support, while the upper band near 116.962 marks potential extended resistance.

News to Watch for CADJPY This Week:

  • Tokyo Core CPI y/y: This release provides critical inflation metrics for Japan that can influence central bank policy expectations and impact yen valuations.
  • GDP m/m: Monthly GDP figures offer insight into Canadian economic activity and can affect the momentum of the Canadian dollar.

Weekly Outlook and Consideration:

CAD/JPY approaches the week with a bullish posture following its rally to 115.329, trading comfortably above the 114.258 middle Bollinger band. Supported by a positive MACD of 0.057 and a daily RSI at 58.50, buyers may aim for a retest of resistance near 116.454 if upward trajectory persists. Conversely, a reversal lower could see price seek support near 114.258 or key support at 110.805.

Disclaimer: The analysis provided for CAD/JPY is for informational purposes only and does not constitute investment advice. Traders are encouraged to perform their own analysis and research before making any trading decisions. Market conditions can change quickly, so staying informed with the latest data is essential.
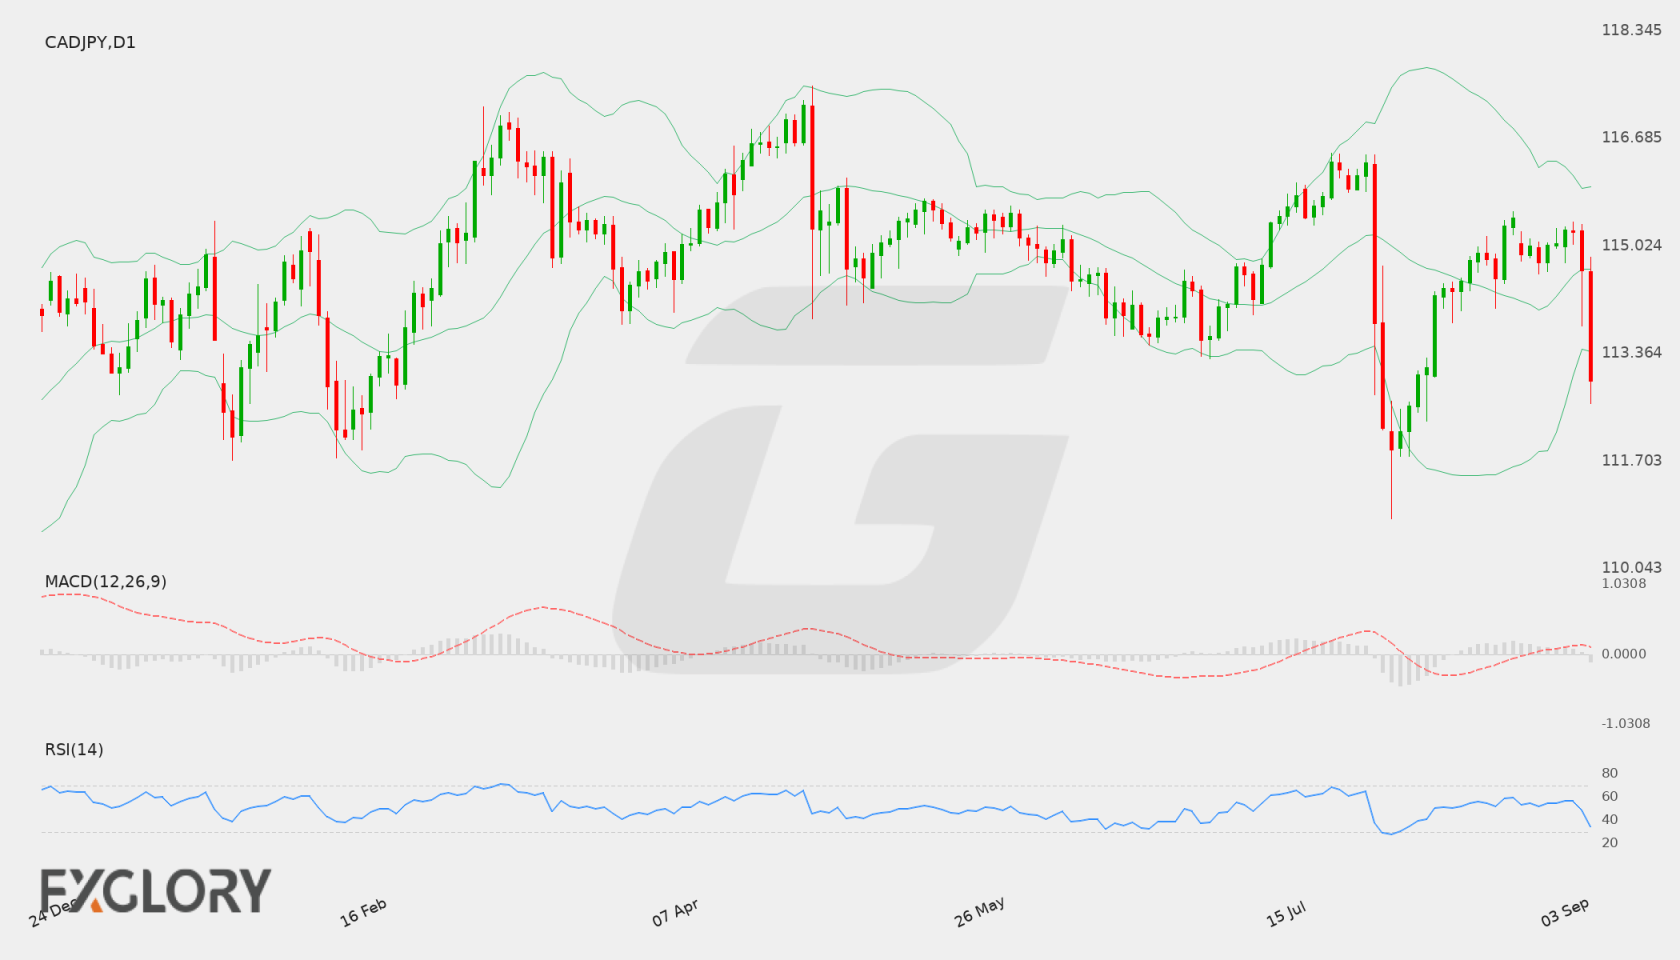
CAD/JPY D1 technical analysis chart
CAD/JPY D1 Technical Analysis for 08.22.2026

CAD/JPY Forecast — 15 August 2026

Time Zone: GMT +3

Time Frame: Daily (D1) / Weekly Outlook

Weekly Fundamental Overview:

The CAD/JPY trading pair continues to be influenced by global risk sentiment, commodity price trends, and upcoming economic releases from Canada. Market participants are closely monitoring inflation data to gauge potential central bank policy shifts, which could drive volatility between the Canadian Dollar and the Japanese Yen.

Price Action:

On the D1 chart, CAD/JPY has rebounded from recent lows near the 110.805 support level, rising toward a close of 114.473. The price action shows a series of higher daily closes over recent sessions, indicating steady recovery momentum, though price is currently testing resistance near the middle boundary of the daily range.

Key Technical Indicators:

Bollinger Bands: CAD/JPY is currently trading near the middle Bollinger Band at 114.489, following a bounce off the lower band at 111.471. The upper Bollinger Band sits at 117.508, representing a key upside target if bullish momentum persists, while the middle band serves as an immediate pivot point.

RSI: The 14-day RSI is currently at 51.90, placing CAD/JPY in neutral territory slightly above the 50 midpoint. This indicates a balanced market without clear overbought or oversold conditions, allowing flexibility for further directional movement.

MACD: The MACD indicator on the daily timeframe remains negative at -0.249. However, the histogram reflects diminishing downside momentum following the recent price rally, suggesting that selling pressure is softening as the pair attempts to stabilize.

Support and Resistance:

Key technical levels for CAD/JPY include support at 110.805, which previously limited downward extension, and resistance at 116.454, which defines the upper boundary of the current broad technical range.

News to Watch for CADJPY This Week:

  • Median CPI y/y: A key core inflation measure for Canada that can influence Bank of Canada monetary policy expectations and impact CAD strength.
  • CPI m/m: Tracks monthly changes in Canadian consumer prices, offering immediate insights into inflationary pressures driving the Canadian Dollar.
  • Trimmed CPI y/y: Measures underlying Canadian inflation by excluding extreme price movements, which helps shape interest rate expectations.
  • Common CPI y/y: Provides another perspective on core Canadian inflation, serving as an important indicator for Bank of Canada policy decisions.

Weekly Outlook and Consideration:

CAD/JPY approaches a decisive area as price action aligns near the D1 middle Bollinger Band around 114.489. If upcoming Canadian CPI releases generate positive momentum for the Canadian Dollar, CAD/JPY could attempt an extended move toward the 116.454 resistance level. Conversely, if selling pressure resurfaces, the pair may slide back toward the lower technical support at 110.805.

Disclaimer: The analysis provided for CAD/JPY is for informational purposes only and does not constitute investment advice. Traders are encouraged to perform their own analysis and research before making any trading decisions. Market conditions can change quickly, so staying informed with the latest data is essential.
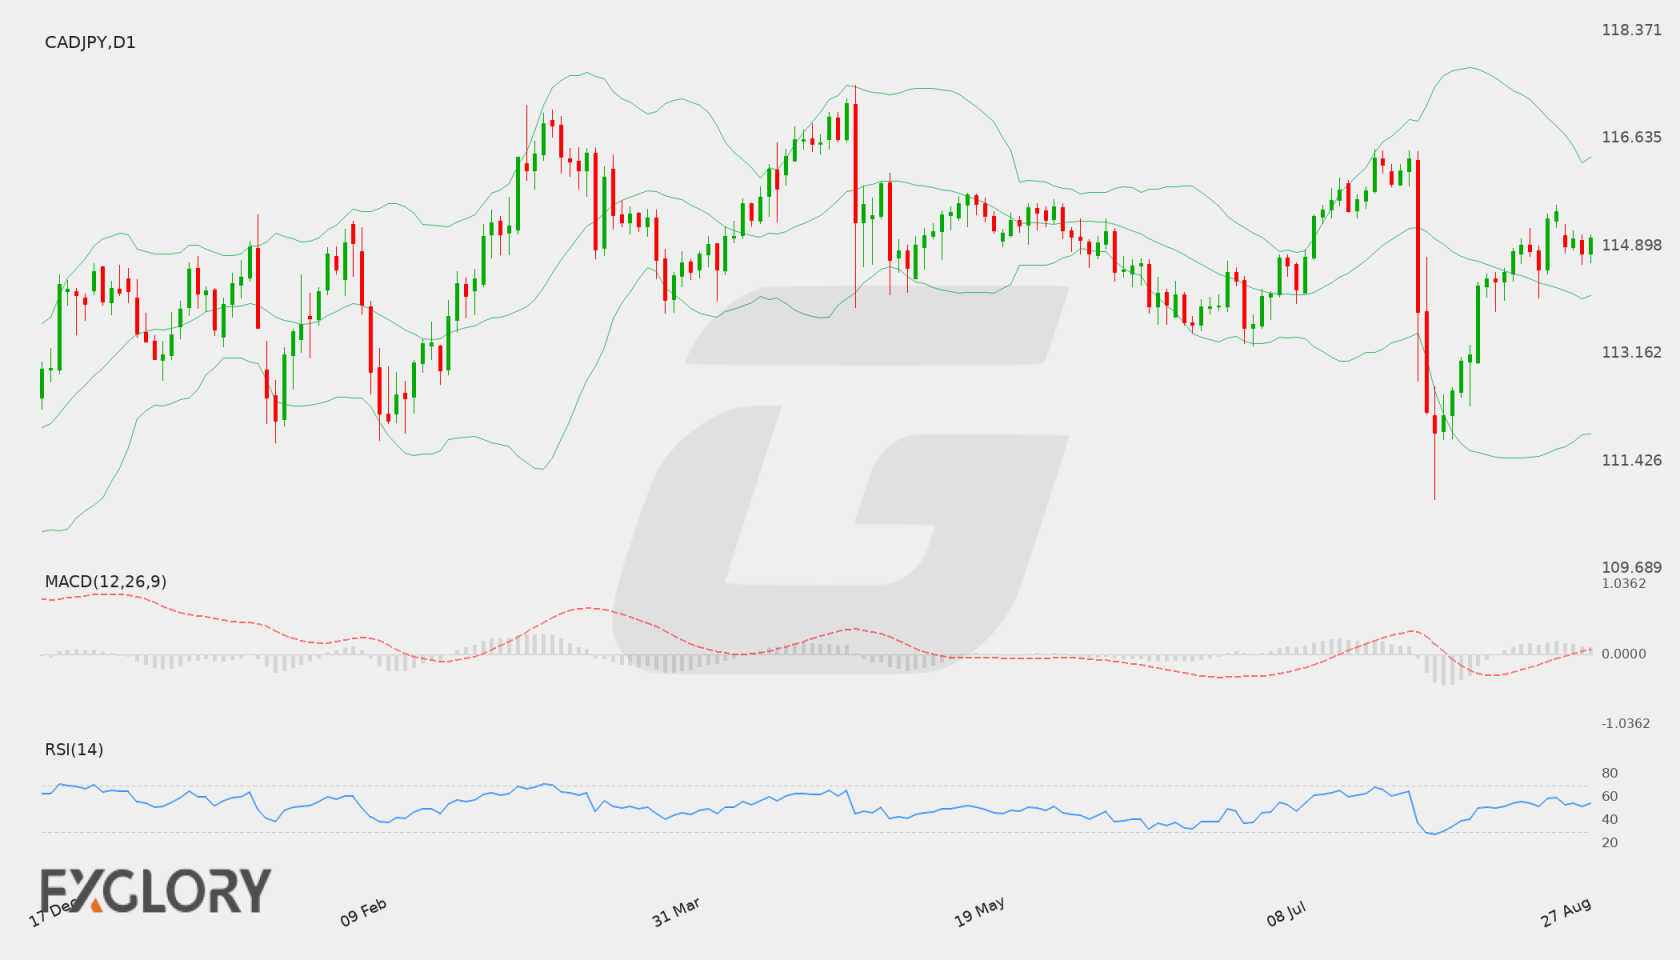
CAD/JPY D1 technical analysis chart
CAD/JPY D1 Technical Analysis for 08.15.2026

CAD/JPY Forecast — 9 August 2026

Time Zone: GMT +3

Time Frame: Daily (D1) / Weekly Outlook

Weekly Fundamental Overview:

The CAD/JPY pair remains sensitive to Canadian economic data, policy outlooks, and global risk sentiment. Shifting expectations regarding central bank interest rates and international commodity conditions continue to influence the Canadian dollar, while the Japanese yen reflects broader safe-haven flows.

Price Action:

On the daily D1 timeframe, CAD/JPY experienced a pull back from recent highs above 116.30 down toward a low of 110.805 before finding buying interest. The pair has since staged a moderate recovery, closing at 113.037, though short-term price action remains constrained beneath previous breakdown points.

Key Technical Indicators:

Bollinger Bands: The daily Bollinger Bands are set with an upper band at 117.754, a middle band at 114.732, and a lower band at 111.710. CAD/JPY traded near the lower band during its recent drop and currently resides at 113.037, remaining below the middle moving average.

RSI: The 14-period Relative Strength Index (RSI) is currently at 39.57. Positioned below the neutral 50 threshold, the indicator signals a tilted bearish bias while staying above extreme oversold territory.

MACD: The D1 MACD indicator shows a reading of -0.546, staying below the signal and zero lines. This positioning reflects lingering bearish momentum following the recent move lower from the upper resistance zone.

Support and Resistance:

Key daily technical levels reveal major support at 110.805, which capped the recent sharp decline. On the upside, resistance is identified at 116.454, with intermediate resistance expected around the middle Bollinger band at 114.732.

News to Watch for CADJPY This Week:

  • Trimmed CPI y/y: This core inflation metric provides insight into underlying price pressures that can impact central bank rate expectations.
  • CPI m/m: The monthly consumer price change offers fresh signals on domestic inflation trends and currency valuation.
  • Median CPI y/y: This core inflation measure helps gauge broader price stability by filtering out extreme volatility.
  • Common CPI y/y: The statistic reflects persistent price shifts across the economy, influencing market sentiment around monetary policy.

Weekly Outlook and Consideration:

The weekly outlook for CAD/JPY presents a neutral-to-bearish stance as price attempts to stabilize above 110.805 support. With the pair trading at 113.037, below the 114.732 middle Bollinger band, a sustained move upward would need to clear this mean resistance to shift sentiment higher toward 116.454. Conversely, if renewed selling pressure breaks below 110.805, the broader downward leg could resume. Market participants will keep a close eye on incoming Canadian inflation metrics and overall market risk appetite.

Disclaimer: The analysis provided for CAD/JPY is for informational purposes only and does not constitute investment advice. Traders are encouraged to perform their own analysis and research before making any trading decisions. Market conditions can change quickly, so staying informed with the latest data is essential.

CAD/JPY D1 technical analysis chart
CAD/JPY D1 Technical Analysis for 08.09.2026
1CAD = –––JPY –––%
CADJPY
Loading chart...