Time Zone: GMT +3
Time Frame: Daily (D1) / Weekly Outlook
Weekly Fundamental Overview:
The AUD/JPY pair navigates a monetary policy environment shaped by Reserve Bank of Australia interest rate decisions and Japanese inflation dynamics. Differentials in monetary policy expectations between Australia and Japan continue to impact sentiment and cross-currency interest.
Price Action:
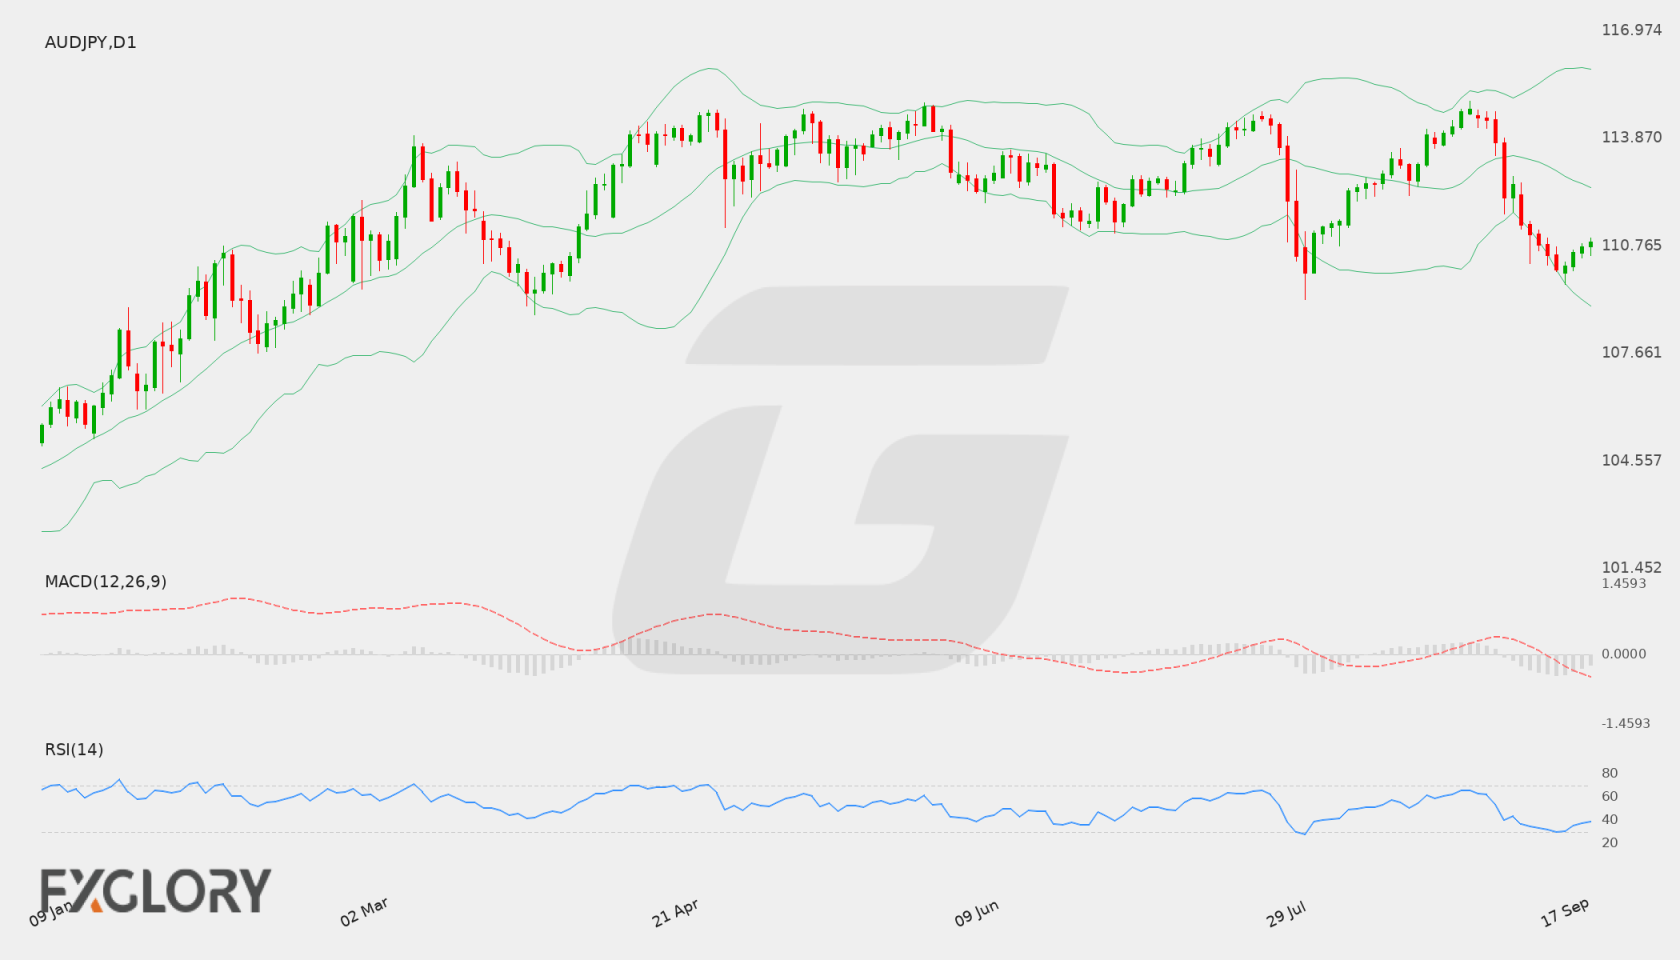
Daily chart price action shows AUD/JPY recently closing around 110.885 after retreating from high levels near resistance at 114.938. The pair has tested lower ranges, staying above the main technical support zone at 109.212.
Key Technical Indicators:
Bollinger Bands: Bollinger Bands on the daily chart reflect a middle line at approximately 112.447, an upper band near 115.858, and a lower band near 109.036. Price action trading below the middle line towards the lower band reflects a downward bias.
RSI: The 14-period Relative Strength Index (RSI) stands at 38.79, indicating subdued buying pressure and positioning the oscillator in a neutral-to-oversold region.
MACD: The MACD indicator is currently reading -0.698, remaining in negative territory. This negative value indicates persistent downside momentum on the daily timeframe.
Support and Resistance:
Key technical support for AUD/JPY is noted at 109.212, which serves as potential downside floor. Upside resistance stands at 114.938, marking a key barrier for bullish recovery attempts.
News to Watch for AUDJPY This Week:
- Cash Rate: This interest rate announcement provides key momentum for Australian monetary policy expectations.
- RBA Rate Statement: The official statement outlines economic perspectives and monetary policy guidance.
- RBA Press Conference: Commentary from central bank officials offers additional clarity on economic trends.
- CPI y/y: Annual price changes provide crucial insights into domestic inflationary pressures.
- Trimmed Mean CPI m/m: Core monthly inflation data helps assess underlying price strength.
- CPI m/m: Monthly consumer price figures measure short-term shifts in inflation.
- Tokyo Core CPI y/y: Japanese inflation data acts as a key leading indicator for national price developments.
Weekly Outlook and Consideration:
For the coming week, AUD/JPY price action will likely revolve around the key technical support at 109.212 and resistance at 114.938. Technical signals such as a negative MACD and an RSI of 38.79 reflect weak upside momentum. High-impact Australian central bank events and Japanese inflation metrics could drive market volatility around key chart levels.
Disclaimer: The analysis provided for AUD/JPY is for informational purposes only and does not constitute investment advice. Traders are encouraged to perform their own analysis and research before making any trading decisions. Market conditions can change quickly, so staying informed with the latest data is essential.