AUD/JPY Forecast — 28 September 2026
Time Zone: GMT +3
Time Frame: Daily (D1) / Weekly Outlook
Weekly Fundamental Overview:
The AUD/JPY pair reflects market dynamics between risk-sensitive Australian dollar sentiment and Japanese yen demand. Economic developments in Australia alongside shifts in global risk sentiment continue to guide price developments, with central bank policy stances remaining a key factor for traders monitoring potential market direction.
Price Action:
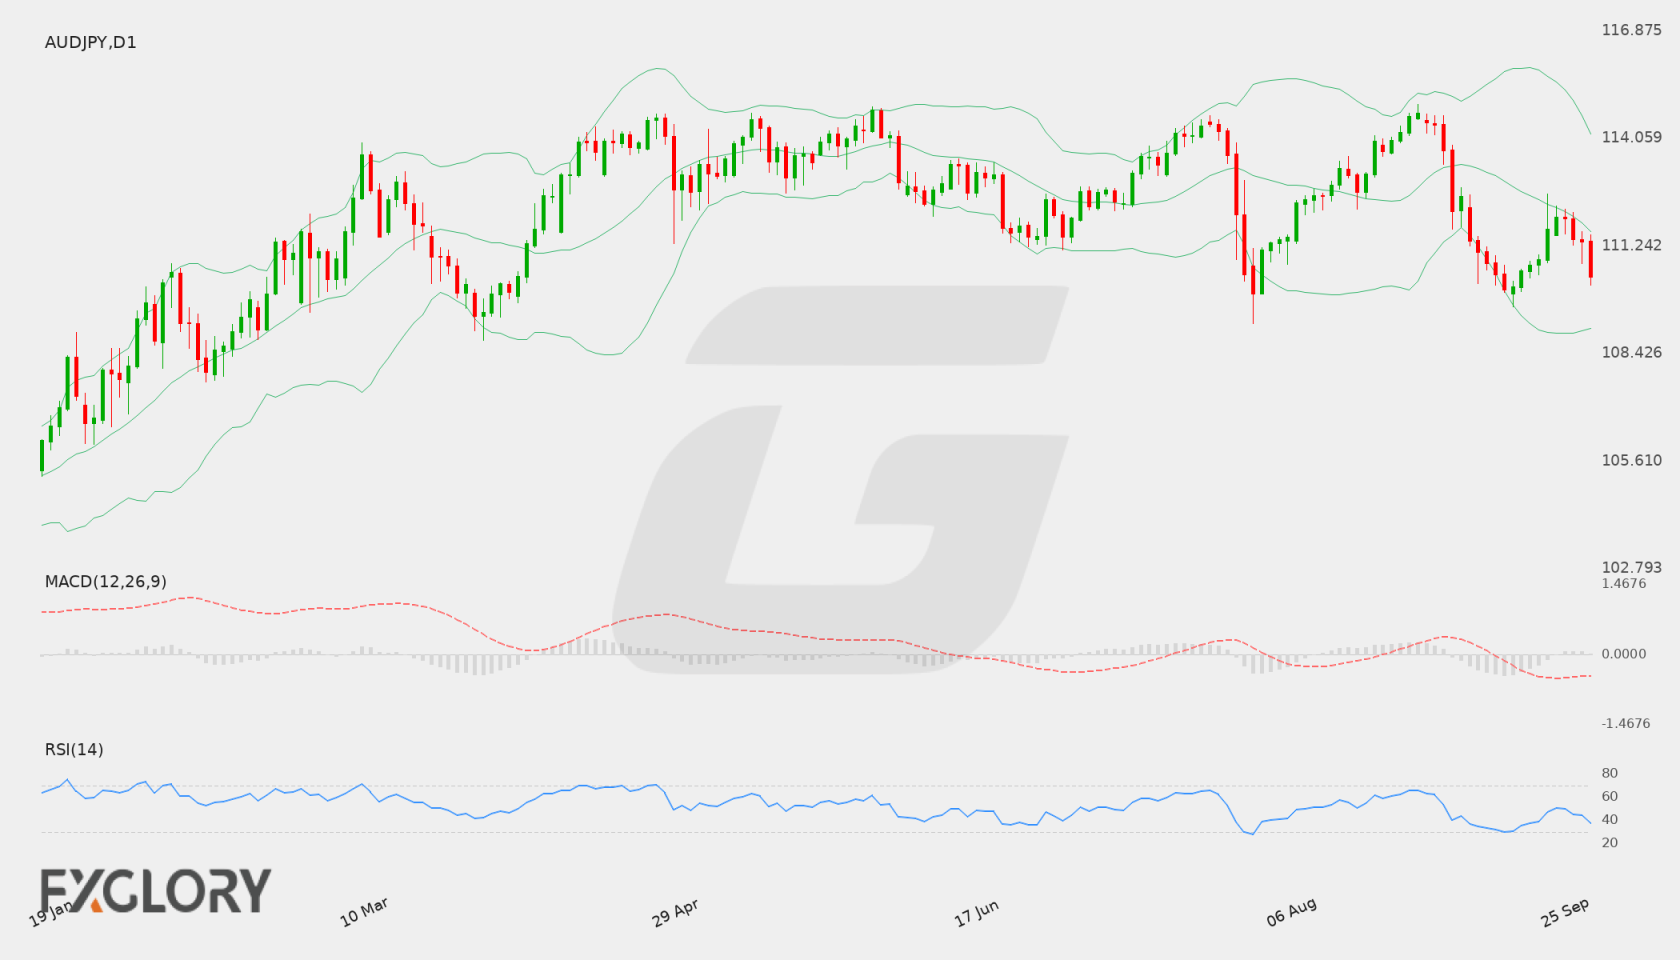
On the daily (D1) chart, AUD/JPY has recently retreated from peak levels around 114.72 to close at 110.433. The daily series shows consecutive lower closes, pointing to short-term selling pressure as price approaches lower technical boundaries.
Key Technical Indicators:
Bollinger Bands: The D1 Bollinger Bands show a middle line at 111.625, an upper band at 114.174, and a lower band at 109.076. Trading at 110.433 positions AUD/JPY below the middle band, signaling bearish bias while staying above lower band support.
RSI: The 14-day Relative Strength Index (RSI) stands at 37.15. This reading suggests bearish market control while remaining above the traditional oversold threshold of 30.
MACD: The D1 MACD indicator records a reading of -0.448, remaining in negative territory. This momentum indicator reflects ongoing downward pressure, though traders watch for any slowing in bearish momentum.
Support and Resistance:
Key technical levels on the daily time frame include primary support near 109.212 and immediate resistance around 114.938. The Bollinger lower band near 109.076 also serves as dynamic support.
News to Watch for AUDJPY This Week:
- RBA Press Conference: Remarks from central bank leadership could provide essential guidance on monetary policy and economic expectations affecting the Australian dollar.
Weekly Outlook and Consideration:
The weekly outlook for AUD/JPY remains cautious given daily technical metrics. With RSI at 37.15 and MACD at -0.448, bearish sentiment persists while price action stays below the 111.625 middle Bollinger band. A hold near the 109.212 support level could allow for potential stabilization, whereas a break higher would require conquering resistance near 114.938.
Disclaimer: The analysis provided for AUD/JPY is for informational purposes only and does not constitute investment advice. Traders are encouraged to perform their own analysis and research before making any trading decisions. Market conditions can change quickly, so staying informed with the latest data is essential.