Time Zone: GMT +3
Time Frame: Daily (D1) / Weekly Outlook
Weekly Fundamental Overview:
XRP/USD continues to reflect shifts in market-wide risk sentiment and broader USD liquidity dynamics. As digital assets react to changing macroeconomic expectations, upcoming US economic indicator releases could introduce broader market volatility and impact price trajectory for XRP/USD.
Price Action:
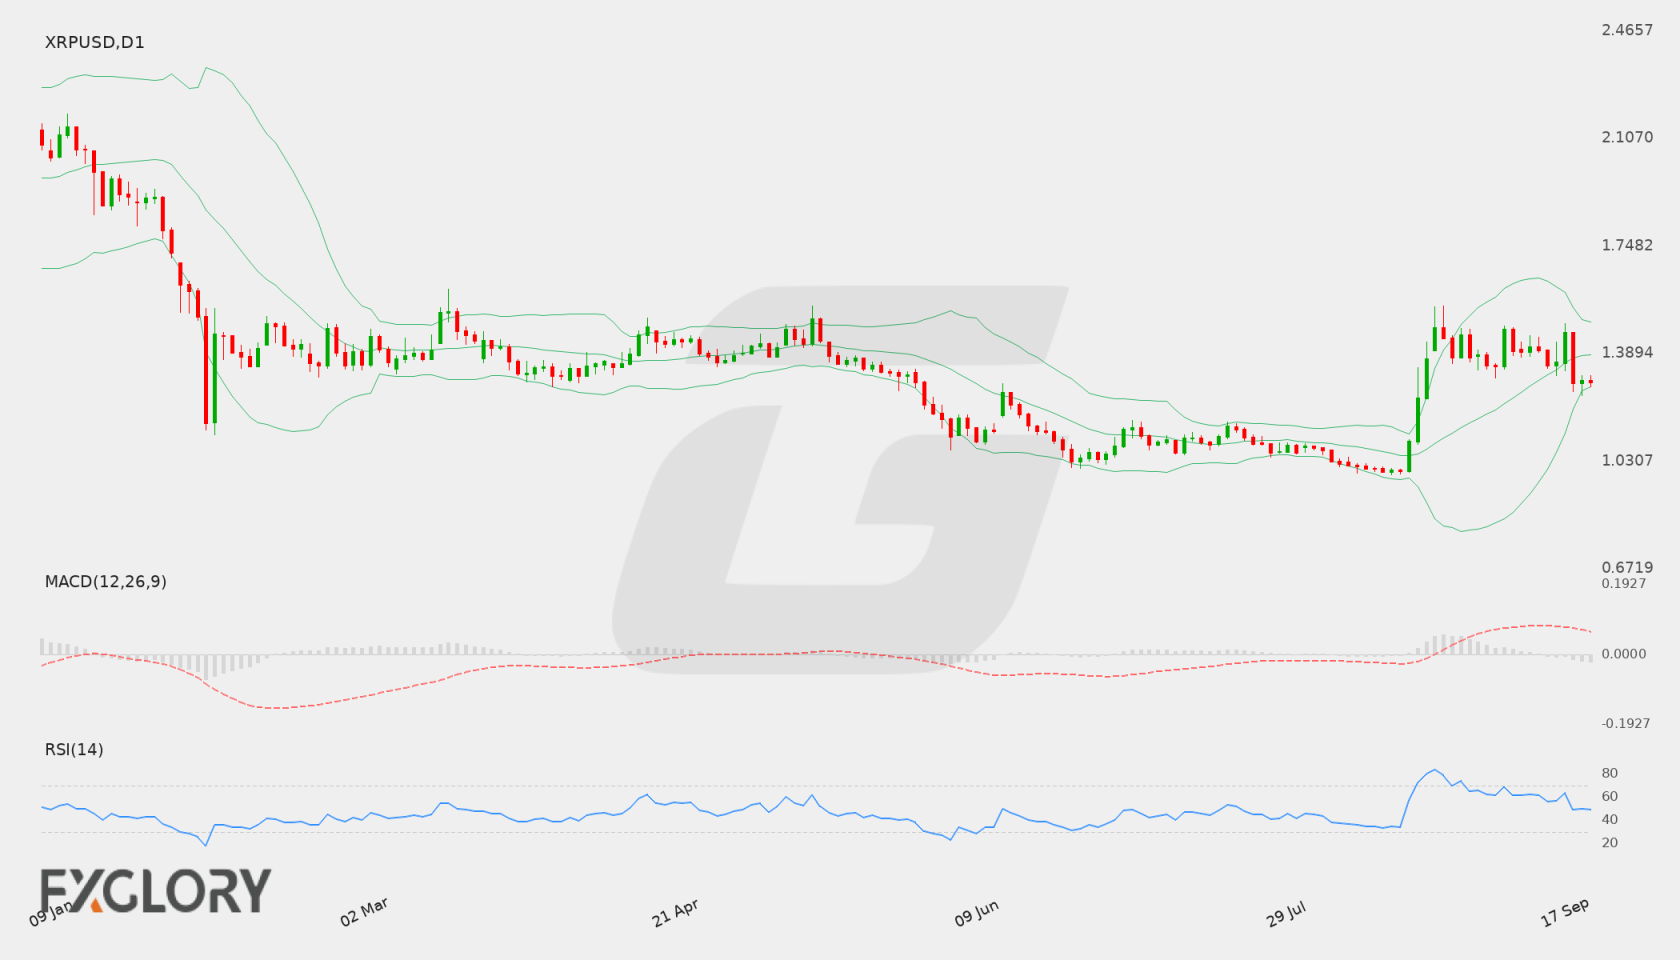
On the daily D1 chart, XRP/USD recently retraced from the 1.4600 region down to a recent close of 1.295. The short-term price action demonstrates a corrective phase following a previous bullish push, with price stabilizing just above lower dynamic technical boundaries.
Key Technical Indicators:
Bollinger Bands: The daily Bollinger Bands indicate a middle band at 1.38551, an upper band at 1.49402, and a lower band at 1.27700. With XRP/USD closing at 1.295, price is trading near the lower band, reflecting increased selling pressures while remaining within the defined volatility bands.
RSI: The 14-period Relative Strength Index (RSI) stands at 49.23. Sitting right near the neutral 50 threshold, the indicator reflects a balanced state between buyers and sellers on the daily timeframe.
MACD: The D1 MACD indicator shows a reading of 0.03927. While remaining slightly above the zero mark, the metric signals a weakening of upside momentum following the recent price decline.
Support and Resistance:
Key technical levels for XRP/USD feature a solid baseline support level at 0.9855 and a primary resistance level at 1.5464. The instrument currently trades at 1.295 between these major parameters.
News to Watch for XRPUSD This Week:
- CB Consumer Confidence: Measures shifts in consumer optimism which can influence overall market risk appetite and dollar strength.
- JOLTS Job Openings: Highlights labor market demand, providing signals for broader economic health.
- ADP Non-Farm Employment Change: Serves as an indicator of private sector job growth that impacts market sentiment.
- Core PCE Price Index m/m: Tracks key inflation trends that influence US monetary policy expectations.
- Final GDP q/q: Offers a final reading on economic growth, impacting broader financial markets.
- ISM Manufacturing PMI: Assesses activity in the manufacturing sector to gauge broader economic momentum.
- Average Hourly Earnings m/m: Reflects wage inflation pressures that could alter rate market assumptions.
- Non-Farm Employment Change: Provides major labor market insight affecting USD volatility and asset prices.
- Unemployment Rate: Evaluates overall workforce stability, driving broad market sentiment.
Weekly Outlook and Consideration:
The full outlook for XRP/USD suggests a period of consolidation around the 1.295 region. Holding above the lower Bollinger band at 1.27700 may allow for a potential technical rebound toward the middle band at 1.38551, with stronger resistance higher at 1.5464. However, sustained pressure below the current support region could direct focus toward the lower key support level of 0.9855. Trader focus will remain split between daily technical indicators and incoming US macroeconomic updates.
Disclaimer: The analysis provided for XRP/USD is for informational purposes only and does not constitute investment advice. Traders are encouraged to perform their own analysis and research before making any trading decisions. Market conditions can change quickly, so staying informed with the latest data is essential.