Current weekly forecast: This outlook covers 11–17 October 2026 and remains valid until 17 October 2026, unless its stated invalidation condition is triggered earlier.
In brief
XRPUSD has a neutral weekly bias: mixed D1 structure and momentum are complicated by bearish H4 pressure below nearby resistance.
The D1 picture is balanced rather than directional. The 1.375 close is below the 1.44241 EMA20 and 1.38073 SMA200, while the 1.35902 EMA50 and its rising slope provide a counterweight. The mixed close sequence and mixed momentum therefore leave the weekly thesis conditional.
H4 adds tactical downside pressure: its 1.3814 close sits below the 1.41708 EMA20 and 1.4514 EMA50, with bearish H4 state and RSI14 at 37.56. That pressure can keep attention on 1.3397 and 1.28193, but the D1 framework remains neutral until the broader structural boundaries are breached.
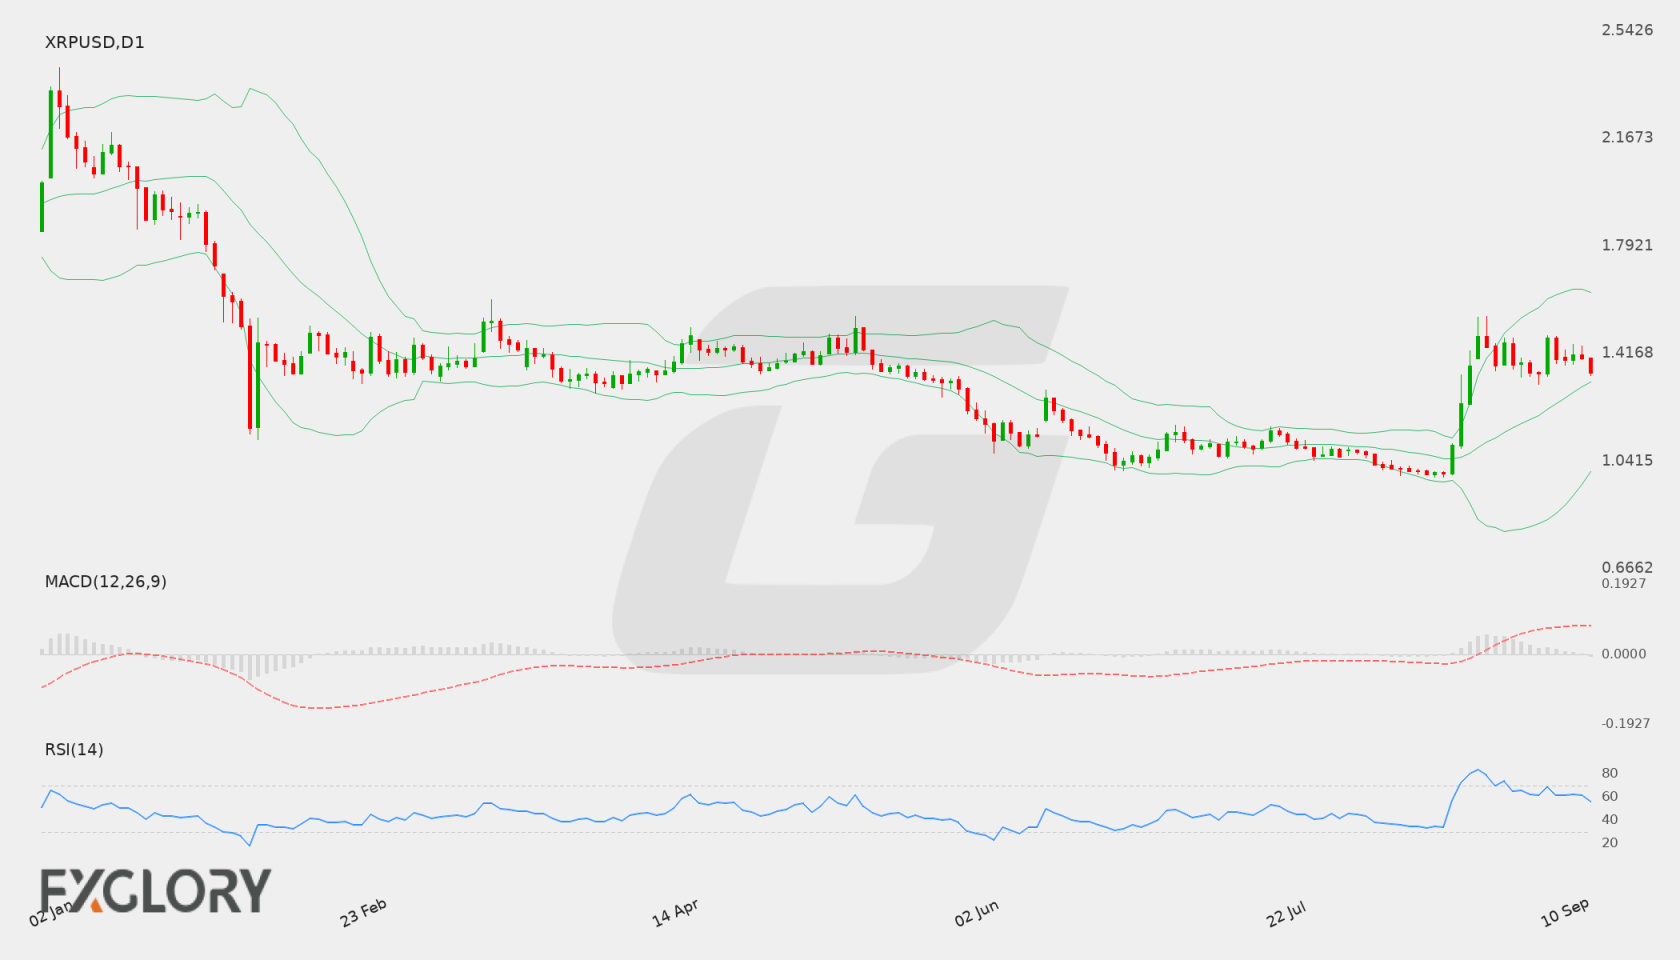
XRP/USD D1 technical-analysis context for the weekly forecast. Chart data captured 11 October 2026.
XRP/USD dynamics remain closely tied to broad cryptocurrency sentiment and the valuation of the US Dollar. Shifts in macroeconomic conditions, particularly US monetary policy expectations and economic growth indicators, continue to influence risk appetite across digital asset markets.
Price Action:
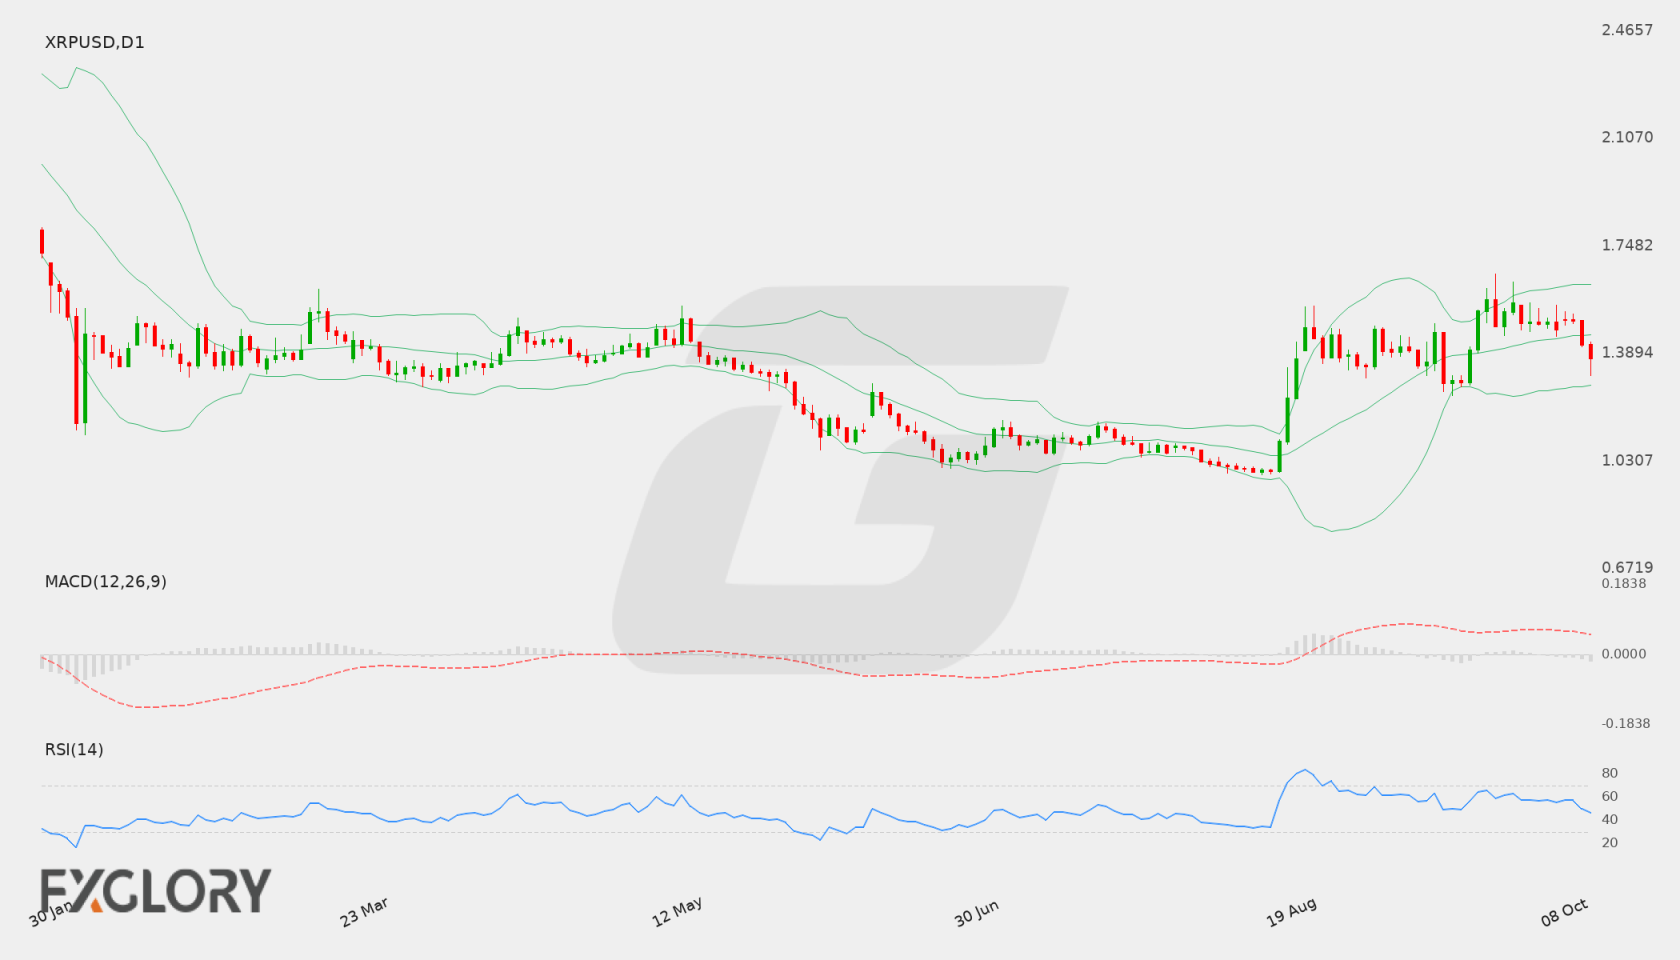
On the Daily (D1) timeframe, XRP/USD recently settled at a close of 1.4952. Following an advance to a high of 1.6539, price action has entered a phase of tight consolidation, with recent closes holding steady around 1.4917, 1.4940, 1.4882, and 1.4952. The pair remains elevated relative to earlier ranges near 1.4000.
Key Technical Indicators:
Bollinger Bands: The Bollinger Bands indicate a middle band at 1.4349, an upper band at 1.6049, and a lower band at 1.2650. With the latest close at 1.4952, XRP/USD is positioned in the upper half of the band above the 20-day baseline, indicating that the prevailing short-term trend maintains an upward bias without immediate overextension against the upper band.
RSI: The 14-day Relative Strength Index (RSI) stands at 57.34. This reading keeps XRP/USD above the neutral 50 threshold, reflecting constructive buying interest while staying well below the overbought boundary.
MACD: The MACD indicator currently registers at 0.0610. Holding in positive territory above the zero mark, the indicator reflects continued positive momentum, although recent horizontal price action points to a moderation in upside acceleration.
Support and Resistance:
Key daily resistance is established at 1.6539, representing the recent peak tested by XRP/USD. Downside support is anchored structurally at 0.9855, with dynamic interim support provided by the Bollinger middle line at 1.4349 and lower band at 1.2650.
News to Watch for XRPUSD This Week:
ISM Services PMI: Variations in service sector strength can impact the US Dollar and broader risk sentiment.
FOMC Meeting Minutes: Detailed policy perspectives from the Federal Reserve may trigger volatility across USD-quoted pairs.
Unemployment Claims: Weekly jobless figures provide insight into US labor market durability and broader monetary outlooks.
Prelim UoM Inflation Expectations: Shifts in consumer inflation expectations can drive rate speculation and cross-market flows.
Prelim UoM Consumer Sentiment: Changes in household sentiment often sway overall risk appetite in speculative asset markets.
Weekly Outlook and Consideration:
XRP/USD enters the week consolidating near 1.4952 after encountering resistance at 1.6539. Technical indicators lean moderately positive, with the RSI at 57.34, MACD at 0.0610, and price holding above the Bollinger baseline of 1.4349. Traders will watch whether the pair can break through overhead resistance at 1.6539 or whether a retreat toward the 1.4349 dynamic support and 0.9855 structural floor will develop, particularly in response to high-impact US economic releases.
Disclaimer: The analysis provided for XRP/USD is for informational purposes only and does not constitute investment advice. Traders are encouraged to perform their own analysis and research before making any trading decisions. Market conditions can change quickly, so staying informed with the latest data is essential.
XRP/USD trading conditions remain sensitive to broader risk sentiment in crypto markets and macroeconomic indicators affecting the US dollar. As liquidity shifts across global financial markets, upcoming US economic releases could drive volatility, directly influencing risk assets like XRP/USD. Traders continue to monitor shift in market sentiment alongside major US macroeconomic data for clear directional cues.
Price Action:
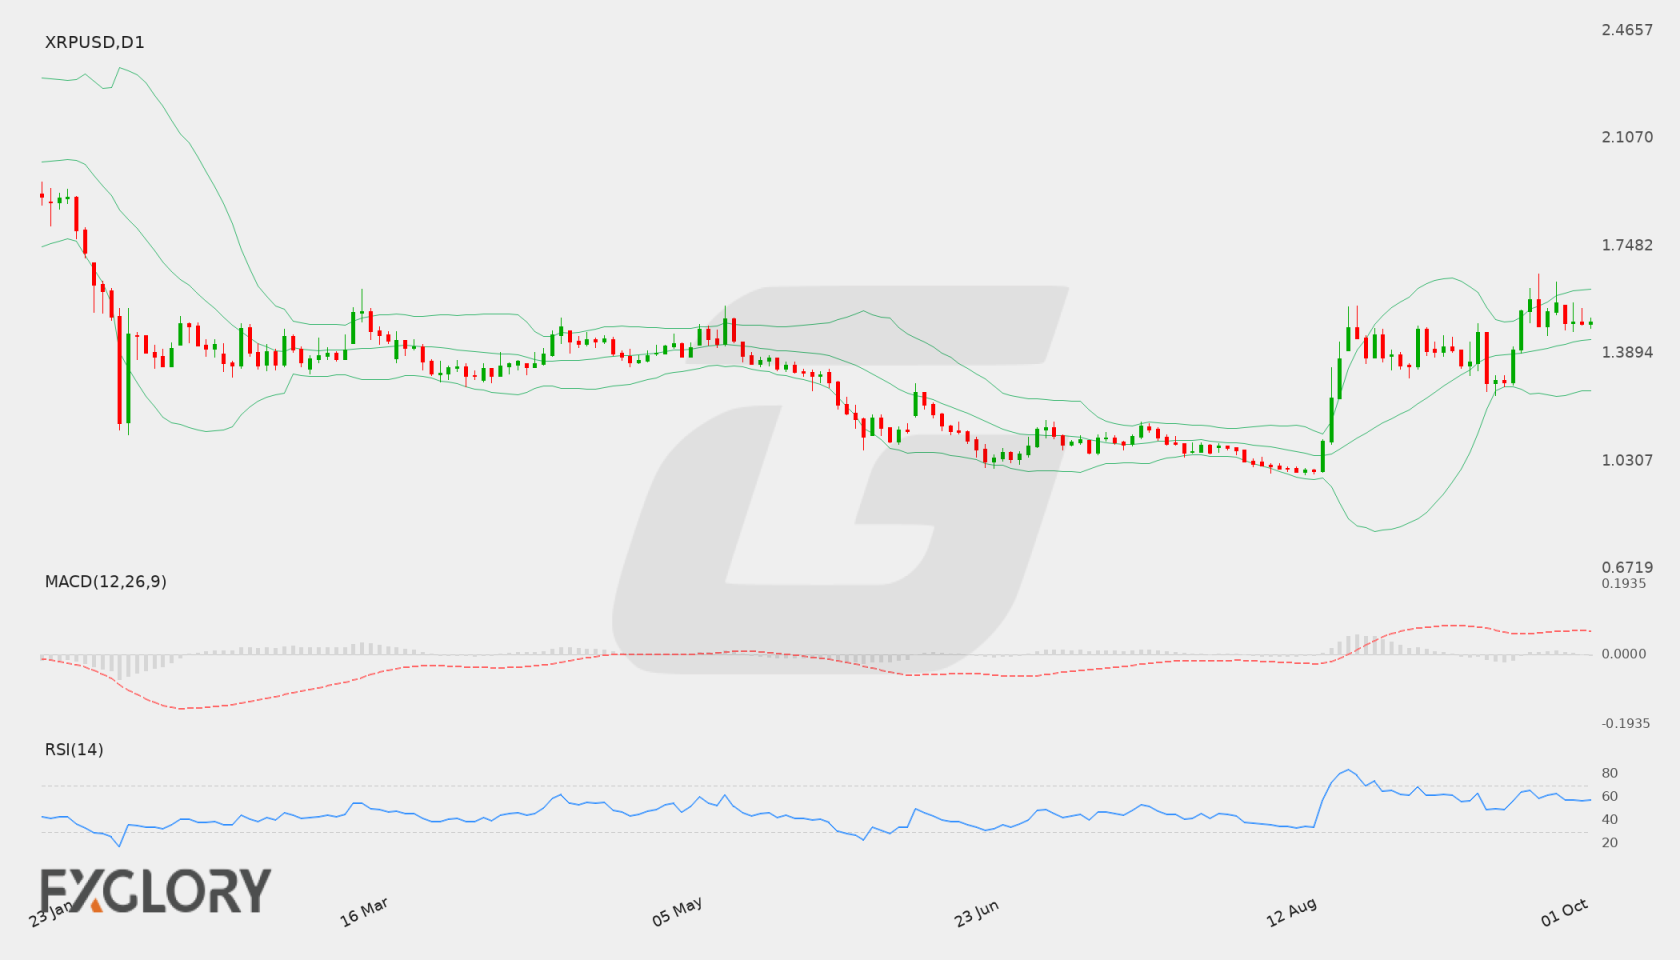
On the daily (D1) chart, XRP/USD has demonstrated strong upward momentum, surging from recent lows near 1.2905 up toward recent highs of 1.6539 before settling at a last close of 1.5280. The recent candlestick structure shows active buyers absorbing intraday pullbacks, keeping price action positioned firmly in positive territory over the recent trading sessions.
Key Technical Indicators:
Bollinger Bands: The daily Bollinger Bands highlight an expanded volatility envelope for XRP/USD, with the middle band located at 1.4051, the upper band at 1.5598, and the lower band at 1.2503. Trading at a close of 1.5280, the price remains elevated in the upper half of the band structure, approaching the upper band limit.
RSI: The 14-day Relative Strength Index (RSI) is currently reading 61.06. This places XRP/USD in bullish territory above the neutral 50 level, reflecting healthy buying pressure while staying clear of extreme overbought conditions.
MACD: The MACD indicator on the D1 timeframe stands at 0.0675, printing positive values above the signal baseline. This bullish reading indicates that upward momentum currently dominates short-to-medium term price development for XRP/USD.
Support and Resistance:
Key technical levels on the daily chart frame the current trading boundary, with primary resistance established at 1.6539 and primary support identified at 0.9855.
News to Watch for XRPUSD This Week:
ISM Manufacturing PMI: Tracks overall business conditions in the US manufacturing sector, potential risk-sentiment catalyst for digital assets.
ISM Manufacturing Prices: Measures input price inflation, providing clues on broader macroeconomic policy expectations that can impact the US dollar.
Weekly Outlook and Consideration:
The weekly perspective for XRP/USD remains constructive according to daily technical indicators. With the price holding at 1.5280, supported above the 20-day middle Bollinger band of 1.4051 and sustained by a positive MACD of 0.0675 and RSI of 61.06, bulls appear in control. A sustained move beyond the upper Bollinger band near 1.5598 could bring primary resistance at 1.6539 into focus, while a retracement could find initial stabilization near the middle band before testing primary support at 0.9855.
Disclaimer: The analysis provided for XRP/USD is for informational purposes only and does not constitute investment advice. Traders are encouraged to perform their own analysis and research before making any trading decisions. Market conditions can change quickly, so staying informed with the latest data is essential.
XRP/USD continues to reflect shifts in market-wide risk sentiment and broader USD liquidity dynamics. As digital assets react to changing macroeconomic expectations, upcoming US economic indicator releases could introduce broader market volatility and impact price trajectory for XRP/USD.
Price Action:
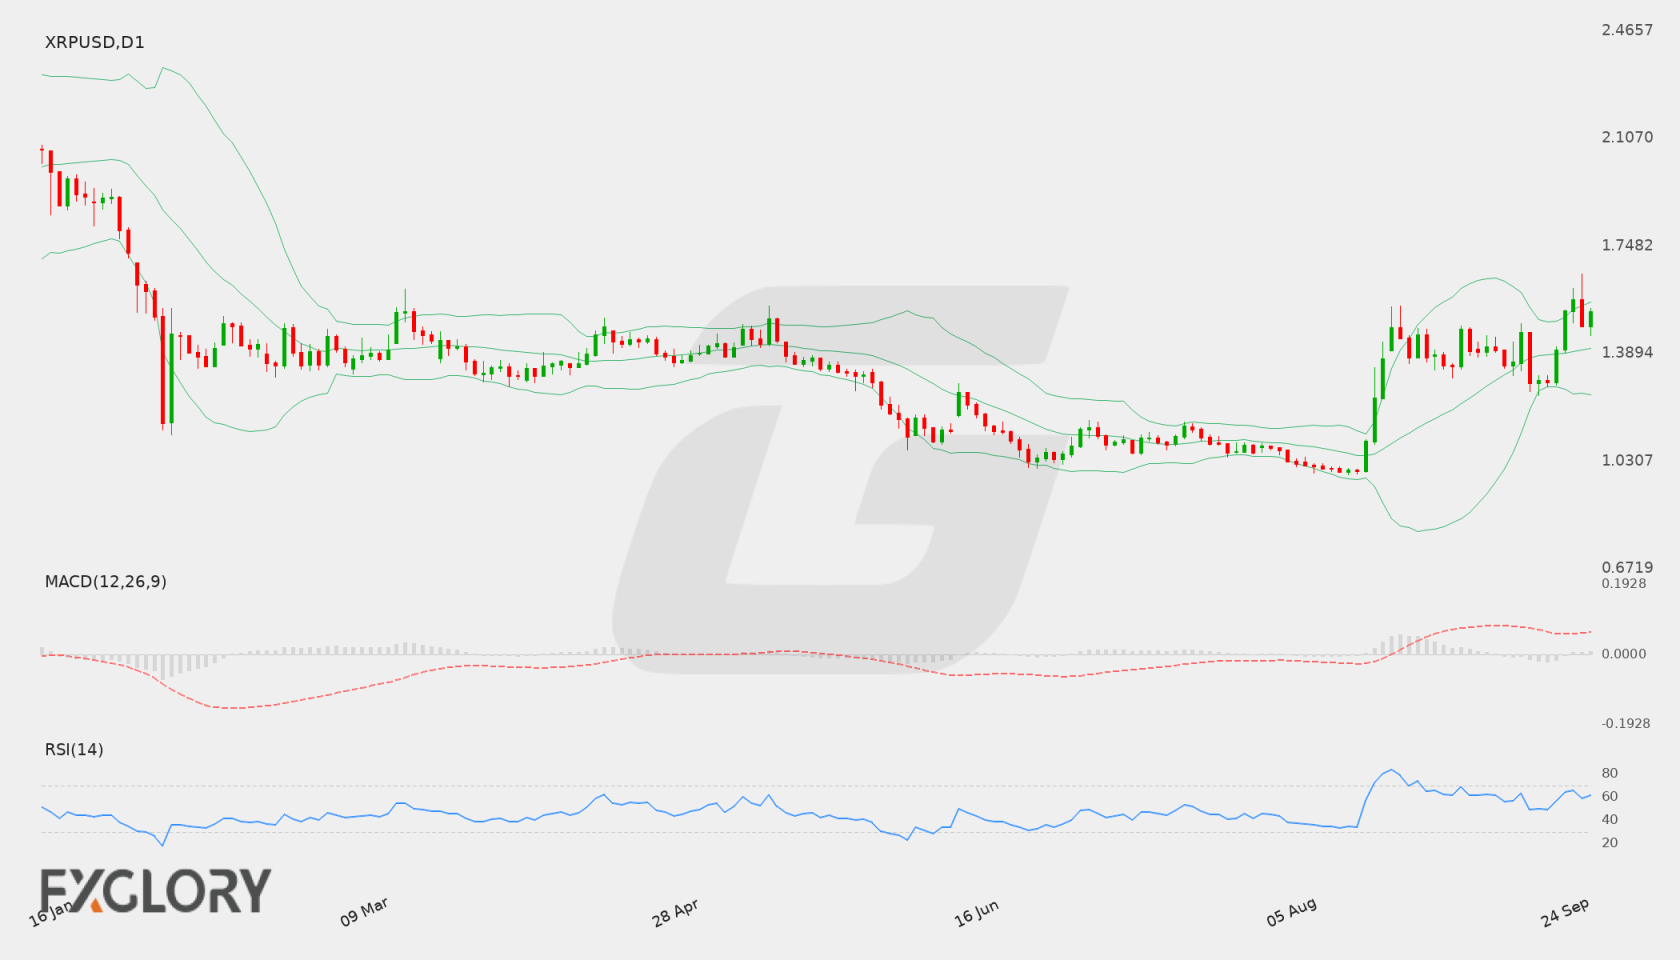
On the daily D1 chart, XRP/USD recently retraced from the 1.4600 region down to a recent close of 1.295. The short-term price action demonstrates a corrective phase following a previous bullish push, with price stabilizing just above lower dynamic technical boundaries.
Key Technical Indicators:
Bollinger Bands: The daily Bollinger Bands indicate a middle band at 1.38551, an upper band at 1.49402, and a lower band at 1.27700. With XRP/USD closing at 1.295, price is trading near the lower band, reflecting increased selling pressures while remaining within the defined volatility bands.
RSI: The 14-period Relative Strength Index (RSI) stands at 49.23. Sitting right near the neutral 50 threshold, the indicator reflects a balanced state between buyers and sellers on the daily timeframe.
MACD: The D1 MACD indicator shows a reading of 0.03927. While remaining slightly above the zero mark, the metric signals a weakening of upside momentum following the recent price decline.
Support and Resistance:
Key technical levels for XRP/USD feature a solid baseline support level at 0.9855 and a primary resistance level at 1.5464. The instrument currently trades at 1.295 between these major parameters.
News to Watch for XRPUSD This Week:
CB Consumer Confidence: Measures shifts in consumer optimism which can influence overall market risk appetite and dollar strength.
The full outlook for XRP/USD suggests a period of consolidation around the 1.295 region. Holding above the lower Bollinger band at 1.27700 may allow for a potential technical rebound toward the middle band at 1.38551, with stronger resistance higher at 1.5464. However, sustained pressure below the current support region could direct focus toward the lower key support level of 0.9855. Trader focus will remain split between daily technical indicators and incoming US macroeconomic updates.
Disclaimer: The analysis provided for XRP/USD is for informational purposes only and does not constitute investment advice. Traders are encouraged to perform their own analysis and research before making any trading decisions. Market conditions can change quickly, so staying informed with the latest data is essential.
Macroeconomic developments surrounding the US Dollar continue to play a pivotal role in shaping risk sentiment for XRP/USD (XRPUSD). Shifts in market liquidity expectations linked to monetary policy statements and retail spending metrics can influence overall trader appetite across crypto markets.
Price Action:
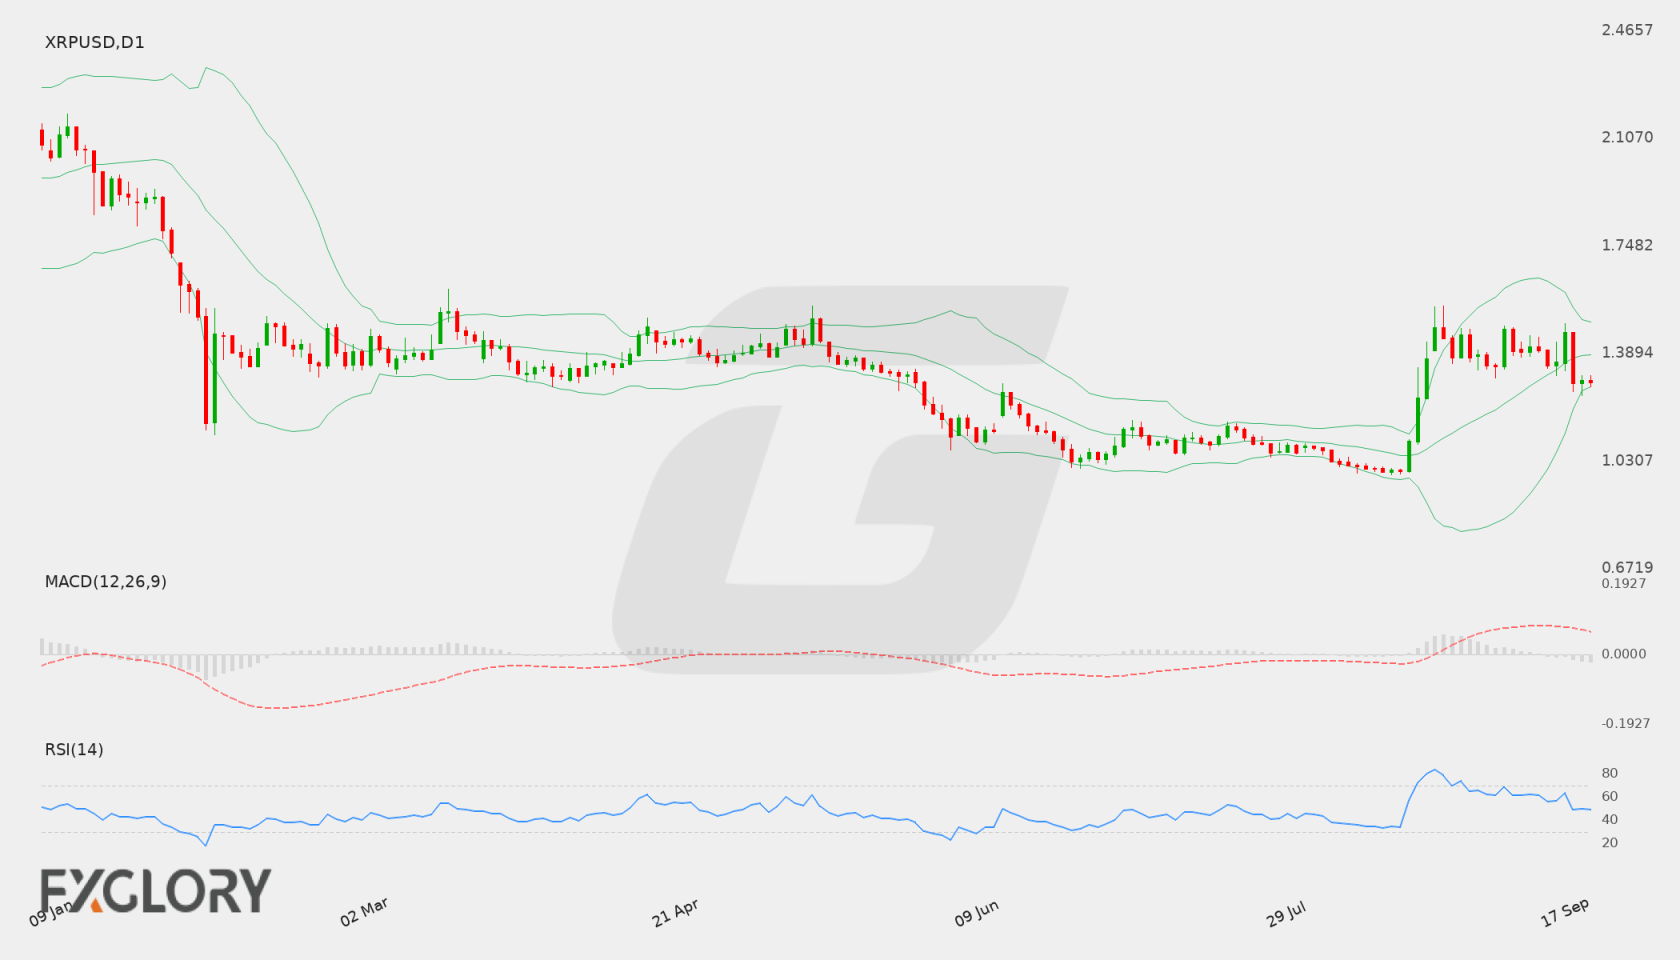
On the D1 timeframe, XRP/USD closed at 1.351 after fluctuating within a defined daily range. The pair recently recovered from lower levels around 0.9855, establishing a short-term consolidation phase above key moving averages.
Key Technical Indicators:
Bollinger Bands: The daily Bollinger Bands highlight a middle band at 1.31678, an upper band at 1.62965, and a lower band at 1.00391. With XRPUSD closing at 1.351, the price resides above the middle line, suggesting steady holding within the central band boundaries.
RSI: The 14-period Relative Strength Index (RSI) stands at 55.763, hovering in neutral territory with a slight upward tilt, indicating moderate market momentum without immediate overbought conditions.
MACD: The daily MACD indicator registers at 0.07296, remaining in positive territory. This indicates mild bullish momentum, though traders monitor histogram activity for signs of momentum expansion or slowdown.
Support and Resistance:
Key daily technical levels for XRP/USD show technical support located at 0.9855 and immediate resistance positioned at 1.5464.
News to Watch for XRPUSD This Week:
Core Retail Sales m/m: Shifts in retail demand offer key economic activity signals that can sway broader risk appetite.
Retail Sales m/m: Updated consumer spending figures influence US Dollar dynamics and market sentiment.
FOMC Economic Projections: Growth and policy rate outlooks provide vital context for global asset valuations.
FOMC Statement: Monetary policy language directly impacts overall market liquidity and investor positioning.
Federal Funds Rate: The benchmark rate decision shapes global yield environments and speculative sentiment.
FOMC Press Conference: Policy remarks during the conference frequently induce heightened volatility across financial markets.
The weekly outlook for XRP/USD (XRPUSD) suggests potential range-bound to cautiously bullish price development, anchored between the support level at 0.9855 and resistance at 1.5464. Technical indicators like the RSI at 55.763 and MACD at 0.07296 align with moderate upside momentum, while price action remains above the middle Bollinger Band at 1.31678. Broader market direction will likely be steered by upcoming US economic events, including the Federal Funds Rate decision and FOMC commentary, which could spark increased market volatility.
Disclaimer: The analysis provided for XRP/USD is for informational purposes only and does not constitute investment advice. Traders are encouraged to perform their own analysis and research before making any trading decisions. Market conditions can change quickly, so staying informed with the latest data is essential.