Current weekly forecast: This outlook covers 11–17 October 2026 and remains valid until 17 October 2026, unless its stated invalidation condition is triggered earlier.
In brief
LTC/USD has a bullish weekly bias from D1 structure, but bearish H4 conditions and mixed momentum make progress conditional on renewed higher-timeframe confirmation.
The weekly thesis is constructive because the D1 trend state is bullish, the EMA50 slope is rising, and the 62.29 reference close is above primary support at 58.22. The close sequence is mixed, however, while the D1 MACD histogram is negative, so the broader structure is not matched by uniformly strong momentum.
H4 introduces countertrend pressure: its tactical state is bearish, RSI is 35.08, MACD is below its signal, and the H4 close is below its EMA20 and EMA50. That tension keeps the bullish view conditional. A move through the supplied resistance framework would improve the upside case toward 75.74513 and 78.82, while weakness through the support structure would shift attention toward 56.32374 and 54.21.
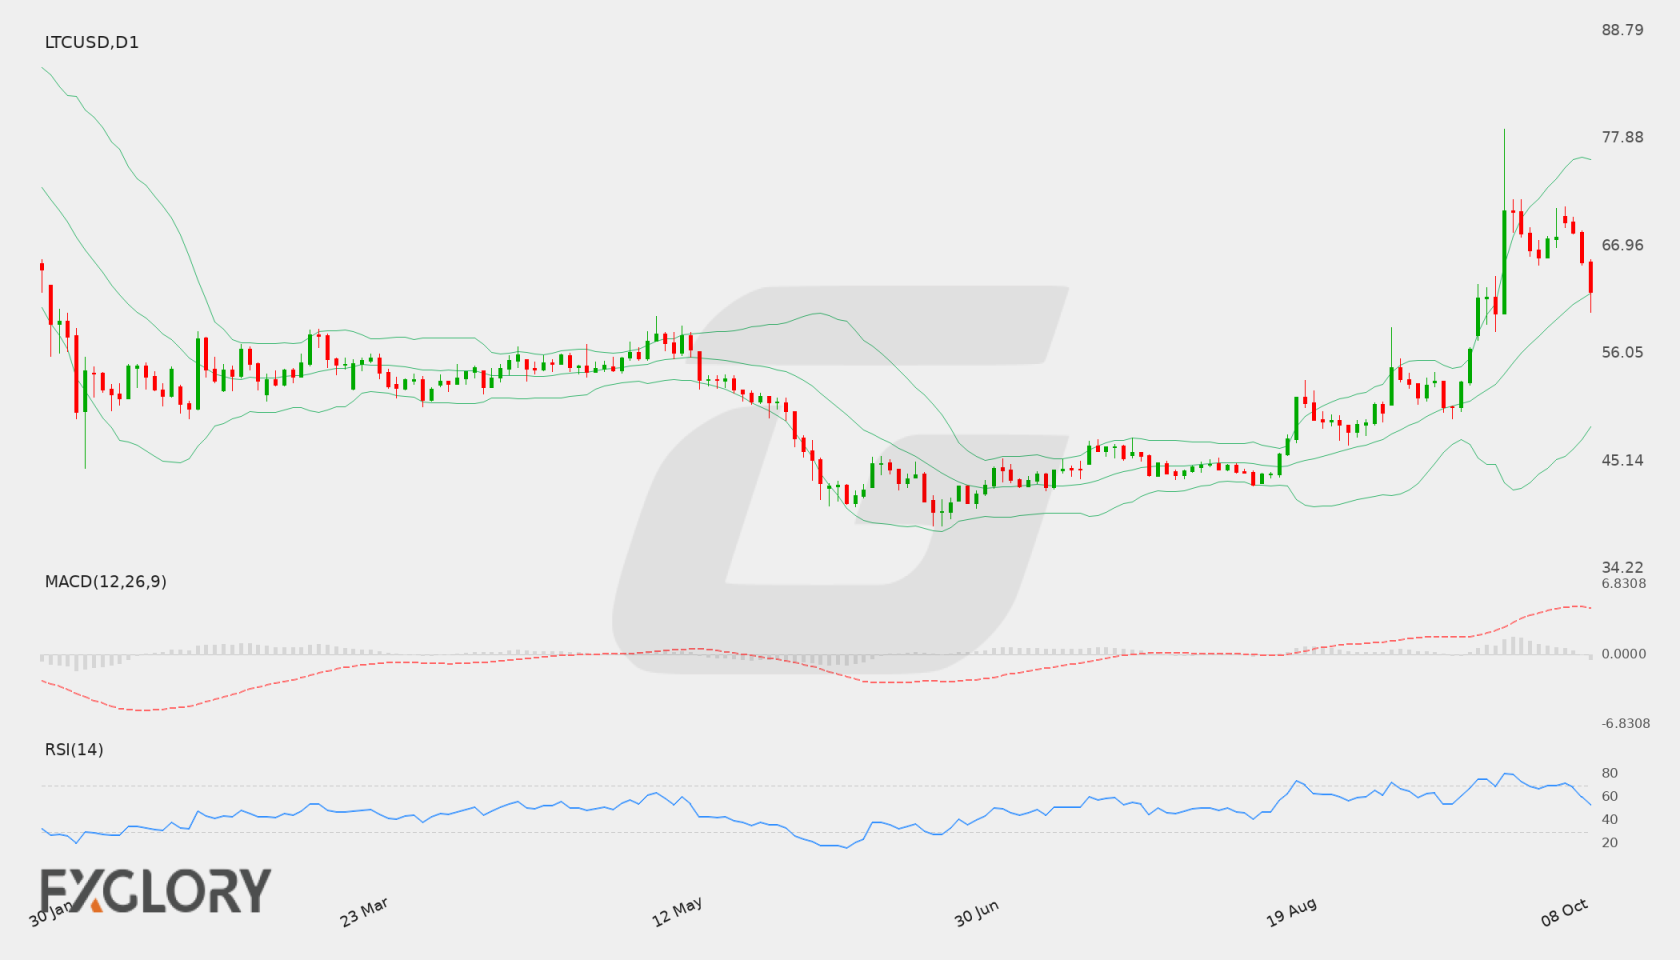
LTC/USD D1 technical-analysis context for the weekly forecast. Chart data captured 11 October 2026.
LTC/USD remains sensitive to scheduled market events and broader risk sentiment. Traders should watch high-impact calendar releases and USD movement where relevant before forming a directional view.
Price Action:
LTCUSD is trading near 67.7, with current daily movement framed by nearby support and resistance.
Key Technical Indicators:
Bollinger Bands: Price is being assessed against the 20-period Bollinger Bands, with middle band near 58.6255, upper band near 72.878268818724, and lower band near 44.372731181276.
RSI: RSI(14) is near 69.317578365232, suggesting traders should watch whether momentum holds, reaches overbought pressure, or weakens toward oversold territory.
MACD: MACD is near 5.0703778596392, so momentum should be watched for continuation or loss of strength on the daily chart.
Support and Resistance:
Key support is near 42.13, while key resistance is near 78.82.
News to Watch for LTCUSD This Week:
Watch scheduled high-impact releases, central bank comments, and broader risk sentiment this week; no specific calendar events are available in current plugin data.
Weekly Outlook and Consideration:
LTC/USD may remain guided by daily price action, support and resistance reactions, momentum indicators, and supplied calendar events. Traders should wait for confirmation around key levels and avoid assuming that current conditions guarantee the next move.
Disclaimer: The analysis provided for LTC/USD is for informational purposes only and does not constitute investment advice. Traders are encouraged to perform their own analysis and research before making any trading decisions. Market conditions can change quickly, so staying informed with the latest data is essential.
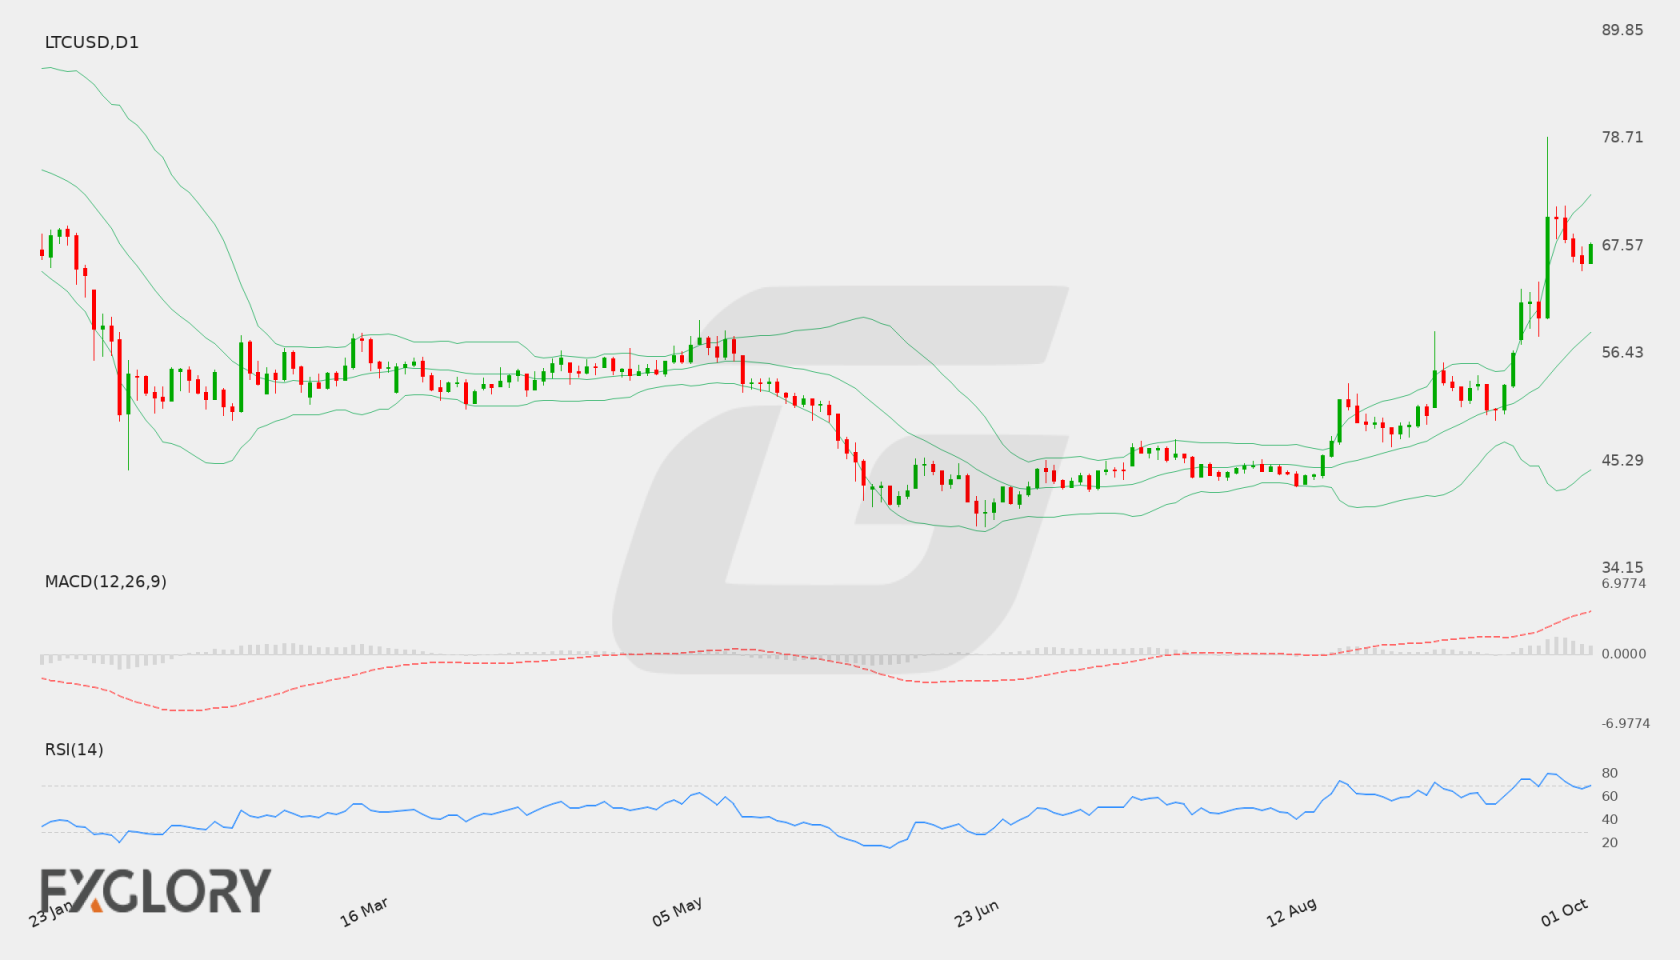
LTC/USD has experienced a notable upward move, closing at 70.56 after accelerating higher. As a digital asset priced against the US dollar, LTCUSD performance remains aligned with broader cryptocurrency market trends and shifts in market risk sentiment. Upcoming economic indicators from the United States may also impact broader dollar dynamics and market sentiment surrounding risk assets.
Price Action:
The Daily (D1) chart shows a rapid rise for LTC/USD from recent lows around 42.75 up through mid-range consolidation levels. The pair recently touched a high of 78.82 before settling at a close of 70.56, reflecting a strong bullish candle expansion accompanied by elevated trading volume.
Key Technical Indicators:
Bollinger Bands: The Bollinger Bands on the D1 timeframe indicate heightened volatility. The middle band stands at 53.97, with the upper band at 65.01 and the lower band at 42.94. LTC/USD closed at 70.56, positioning price action above the upper Bollinger Band.
RSI: The 14-day Relative Strength Index (RSI) is currently reading 79.84. This places the indicator firmly above the 70 threshold, signaling overbought condition after the swift price increase.
MACD: The MACD indicator reflects positive bullish momentum, printing a main value of 4.07. The positive trajectory aligns with the recent sharp price rally recorded on the daily chart.
Support and Resistance:
Key technical levels for LTC/USD include primary resistance at 78.82, which reflects the recent peak high. On the downside, identified major support is located at 42.13.
News to Watch for LTCUSD This Week:
ISM Manufacturing PMI: US manufacturing activity data can sway overall financial market risk sentiment and impact crypto asset valuations against the dollar.
ISM Manufacturing Prices: Inflationary signals within manufacturing data may influence broader macroeconomic expectations and risk appetite.
Weekly Outlook and Consideration:
LTC/USD displays powerful bullish momentum following its close at 70.56 and a test of resistance at 78.82. Technical parameters show price above the upper Bollinger Band (65.01) and a positive MACD at 4.07, though an RSI of 79.84 highlights overbought conditions. Traders will monitor whether LTCUSD can sustain levels above current support bands or if price consolidates back toward the middle band at 53.97 or technical support at 42.13.
Disclaimer: The analysis provided for LTC/USD is for informational purposes only and does not constitute investment advice. Traders are encouraged to perform their own analysis and research before making any trading decisions. Market conditions can change quickly, so staying informed with the latest data is essential.
Broader macroeconomic conditions and shifts in US Dollar sentiment continue to influence overall liquidity across digital asset markets. Upcoming economic data releases regarding the labor market and inflation are expected to drive risk sentiment, indirectly impacting the momentum of LTC/USD.
Price Action:
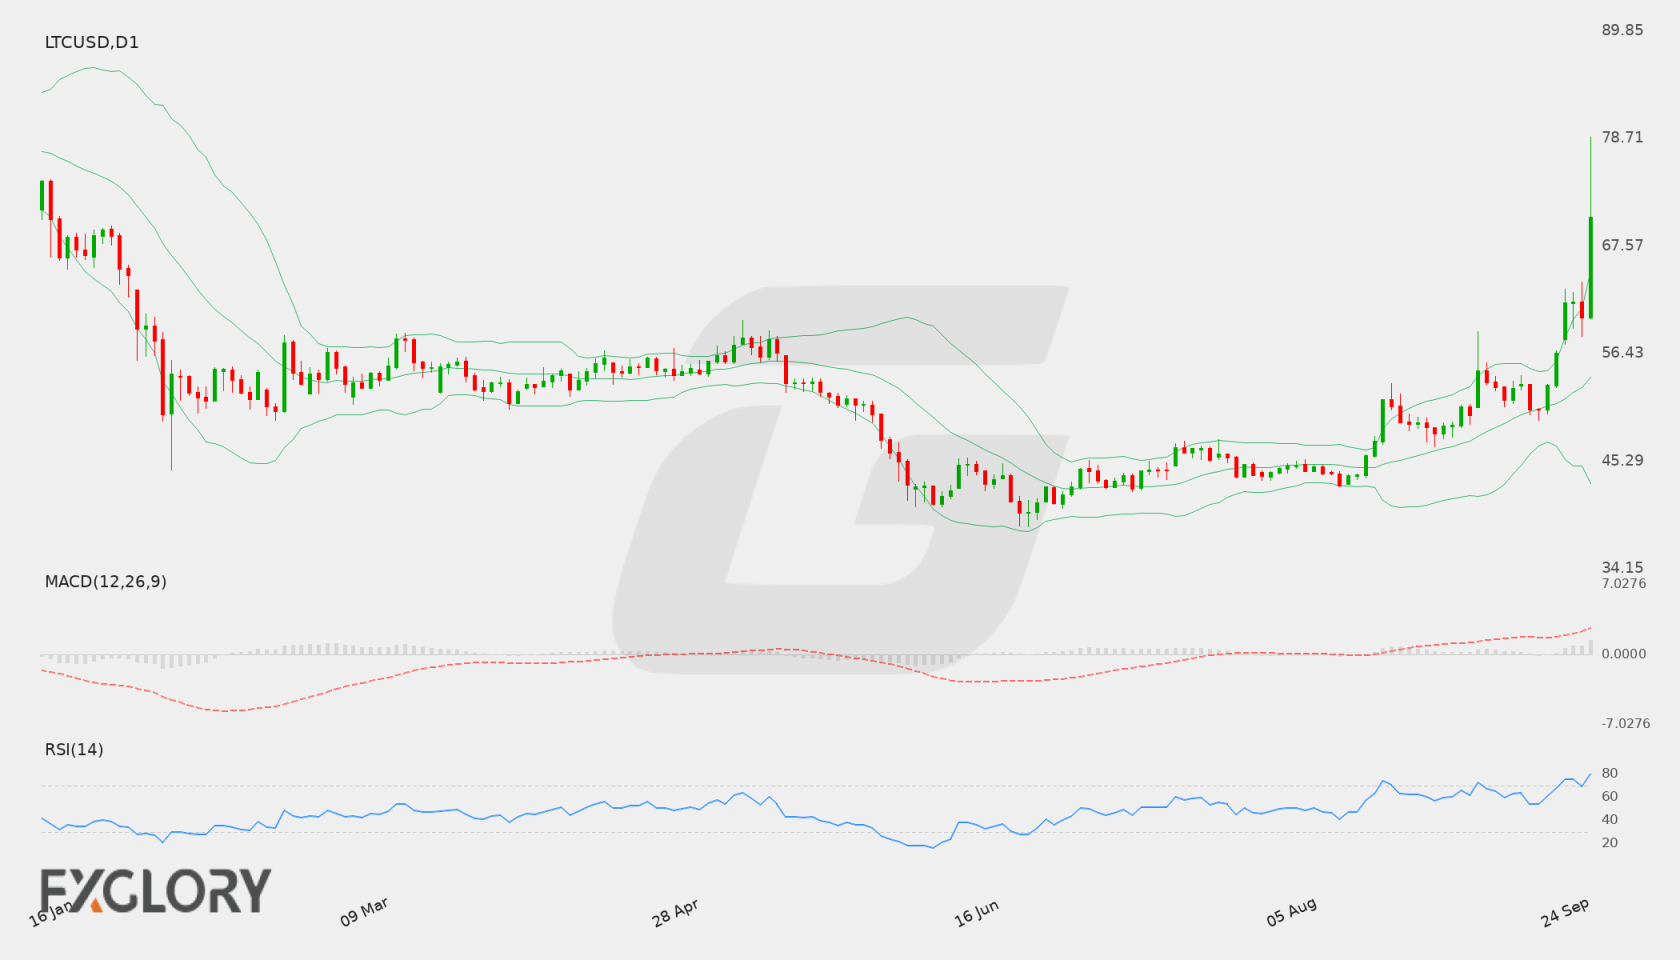
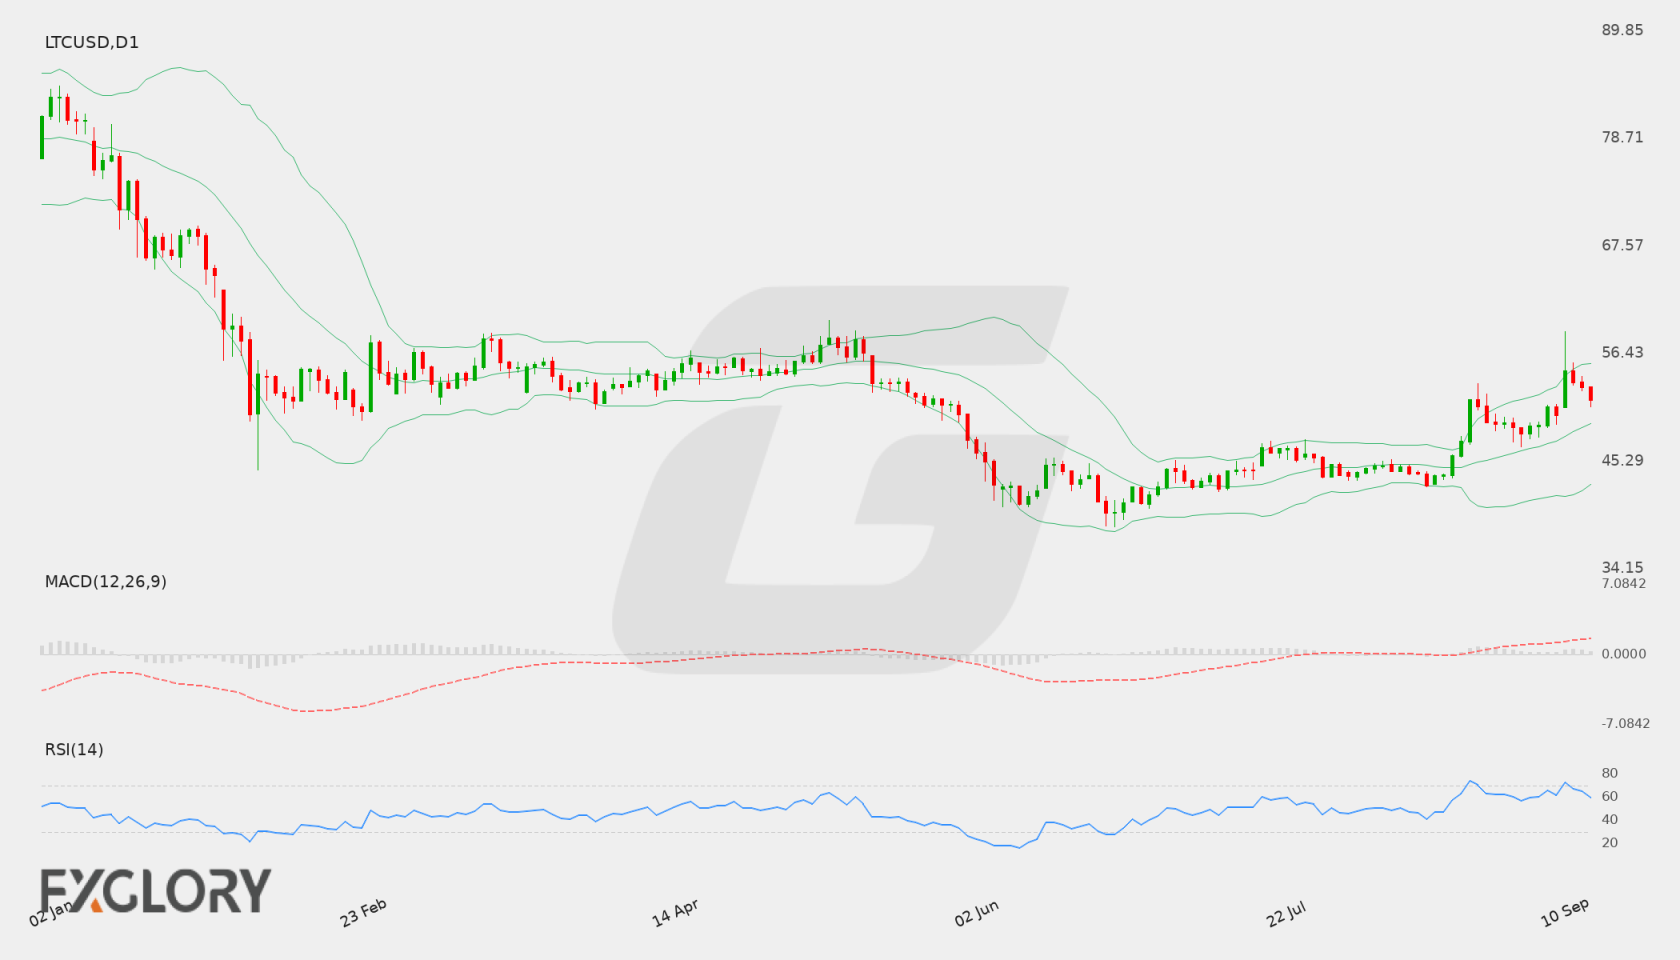
On the daily (D1) chart, LTC/USD recently closed at 53.13 after recovering from recent lows. The instrument has formed a steady series of higher closes, pushing toward the upper technical boundaries as bullish momentum attempts to establish control.
Key Technical Indicators:
Bollinger Bands: The Bollinger Bands display a middle line at 50.96, an upper band at 54.66, and a lower band at 47.26. Trading near 53.13 keeps LTC/USD comfortably above the middle boundary and approaching upper resistance.
RSI: The 14-day Relative Strength Index (RSI) stands at 60.48. Holding above the neutral 50 level, the oscillator indicates ongoing buying strength while remaining below overbought territory.
MACD: The MACD indicator is currently reading 1.58, maintaining a positive trajectory above the baseline and signaling active bullish momentum on the daily time frame.
Support and Resistance:
Key daily technical support is established at 39.24, while primary overhead resistance is located around 58.66.
News to Watch for LTCUSD This Week:
CB Consumer Confidence: Shifts in consumer sentiment provide insights into US economic momentum and overall market risk tolerance.
JOLTS Job Openings: Labor demand metrics influence broad expectations around central bank interest rate trajectories.
ADP Non-Farm Employment Change: Private sector employment trends help gauge broader economic health and liquidity conditions.
Core PCE Price Index m/m: Inflation measurements directly affect currency strength and broader asset price dynamics.
Final GDP q/q: Comprehensive growth figures shape market sentiment regarding US economic stability.
ISM Manufacturing PMI: Manufacturing activity trends serve as a key barometer for economic expansion or contraction.
Average Hourly Earnings m/m: Wage growth indicators inform inflationary pressure and potential policy responses.
The weekly outlook for LTC/USD remains constructive, supported by an RSI above 50 and positive MACD values. If buying interest persists above the middle Bollinger Band at 50.96, LTCUSD could attempt a challenge toward the resistance zone near 58.66. Conversely, a turn lower could see the pair test the lower Bollinger Band around 47.26, with major structural support remaining at 39.24.
Disclaimer: The analysis provided for LTC/USD is for informational purposes only and does not constitute investment advice. Traders are encouraged to perform their own analysis and research before making any trading decisions. Market conditions can change quickly, so staying informed with the latest data is essential.
The LTC/USD market remains sensitive to broader cryptocurrency sector sentiment and macroeconomic conditions impacting the US Dollar. Monetary policy signals from the Federal Reserve and consumer spending metrics influence market-wide liquidity, which directly affects risk assets like Litecoin.
Price Action:
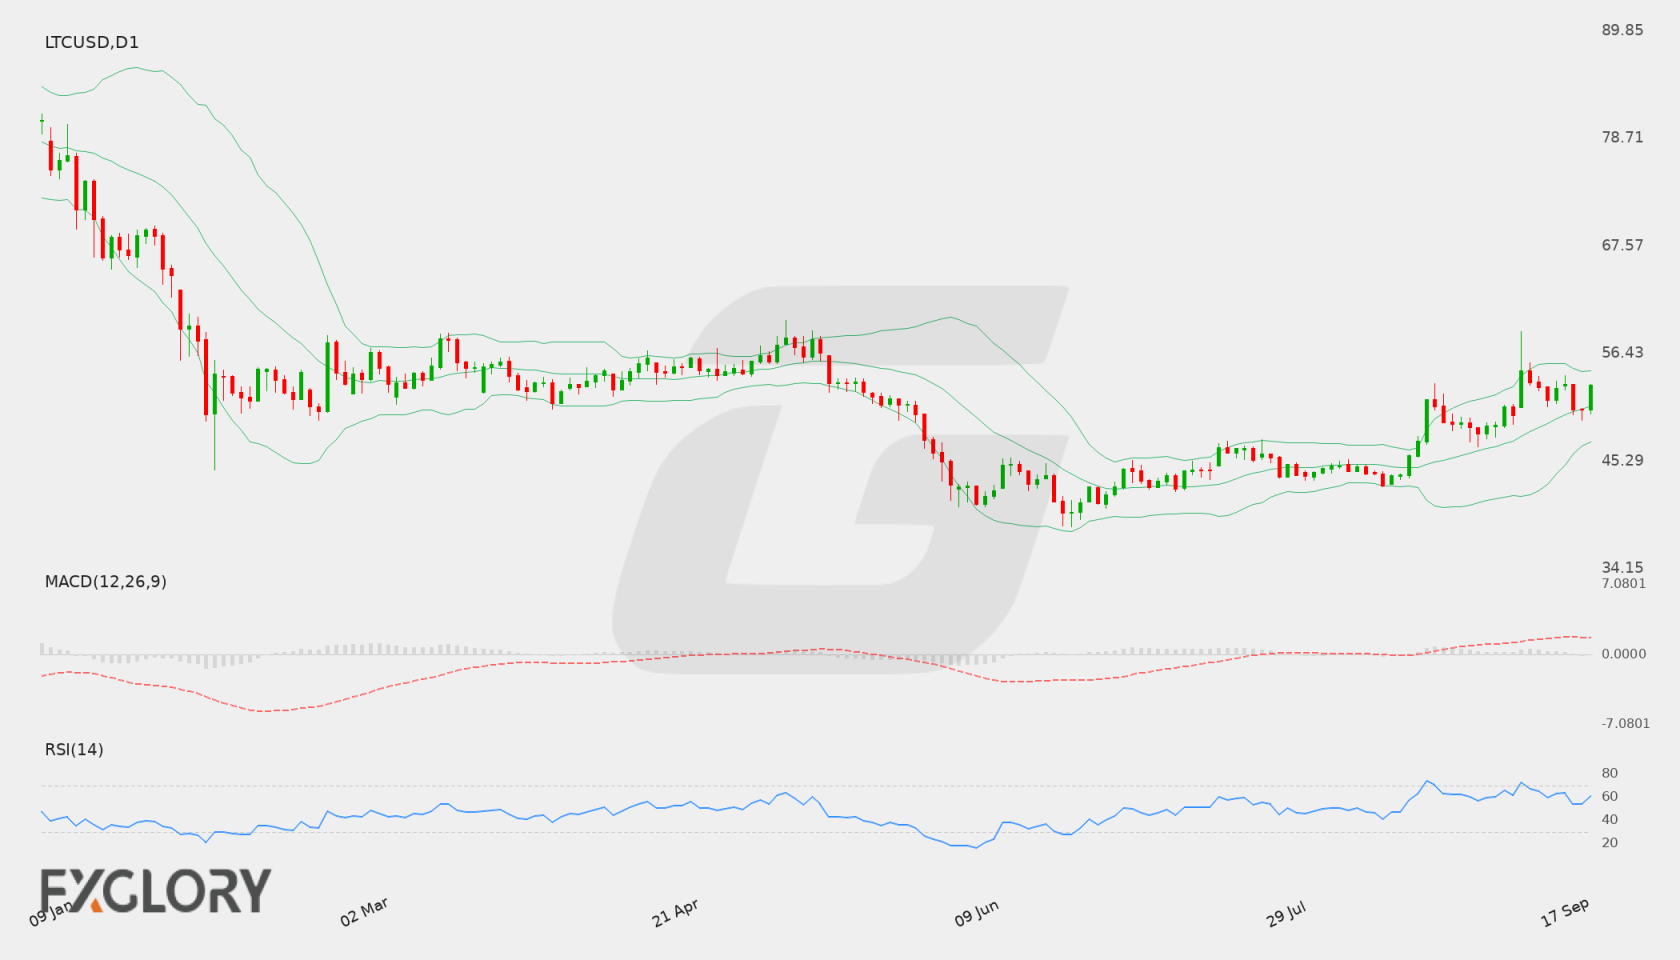
On the D1 chart, LTC/USD recently rallied from around the 42.75 low to a high of 58.66 before pulling back to settle at 51.6. The price action reflects a recent bullish push that has entered a brief consolidation phase above the 50.00 mark.
Key Technical Indicators:
Bollinger Bands: The daily Bollinger Bands display a middle band at 49.12, an upper band at 55.37, and a lower band at 42.86. With LTC/USD closing at 51.6, price trades between the middle and upper bands, signaling modest bullish momentum within an expanding channel.
RSI: The 14-period Relative Strength Index (RSI) registers at 59.38. Positioned above the 50 neutral mark and below the 70 overbought threshold, the indicator reflects steady buying interest without immediate overextended conditions.
MACD: The MACD main value stands at 1.89, holding above the zero line. This positive reading indicates active bullish momentum on the daily timeframe, though traders monitor for potential signal line convergence during pullbacks.
Support and Resistance:
Key technical levels for LTC/USD on the D1 chart feature immediate support at 38.49 and primary resistance at 58.66. A sustained move above resistance could open space for further gains, whereas a breakdown below support may trigger deeper downside risks.
News to Watch for LTCUSD This Week:
Core Retail Sales m/m: Shifts in core consumer spending can impact US Dollar strength and broader risk sentiment.
Retail Sales m/m: Headline retail figures provide insight into economic health, influencing broader market liquidity.
FOMC Economic Projections: Updated growth and inflation forecasts offer long-term guidance on interest rate trajectories.
FOMC Statement: Official policy remarks clarify the Federal Reserve's monetary stance and risk appetite across financial markets.
Federal Funds Rate: Interest rate decisions directly influence US Dollar valuations and capital allocation into digital assets.
Unemployment Claims: Weekly labor market data serves as a key economic barometer for US Dollar volatility.
Weekly Outlook and Consideration:
The weekly outlook for LTC/USD remains cautious to constructive while price holds above the daily Bollinger middle band at 49.12. With RSI at 59.38 and MACD at 1.89, technical indicators favor mild upside bias toward the 58.66 resistance level. However, upcoming high-impact macroeconomic events, including the Federal Funds Rate decision and FOMC Statement, could introduce heightened volatility and dictate the next directional move between support at 38.49 and resistance at 58.66.
Disclaimer: The analysis provided for LTC/USD is for informational purposes only and does not constitute investment advice. Traders are encouraged to perform their own analysis and research before making any trading decisions. Market conditions can change quickly, so staying informed with the latest data is essential.