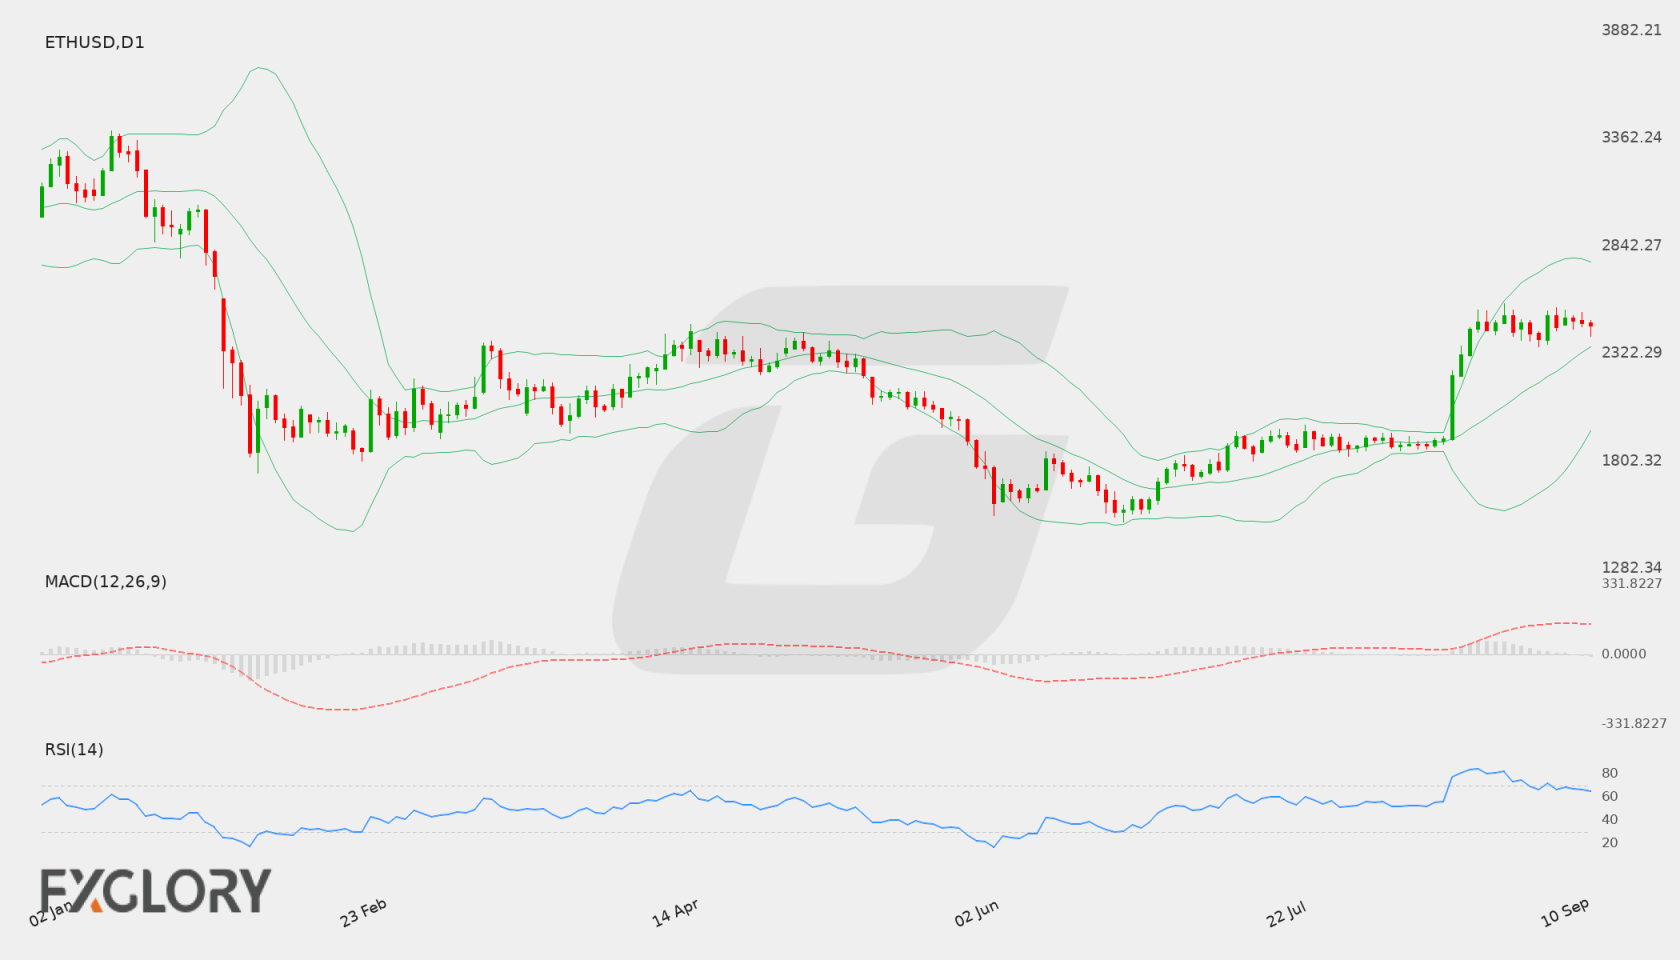
Current weekly forecast: This outlook covers 11–17 October 2026 and remains valid until 17 October 2026, unless its stated invalidation condition is triggered earlier.
In brief
ETHUSD has a conditional bullish weekly bias, supported by D1 structure but restrained by negative momentum and bearish H4 positioning.
The D1 trend remains bullish and the EMA50 slope is rising, placing the broader structure on the constructive side despite a last close of 2471.06 below the EMA20 at 2593.50938. The close sequence is mixed, while RSI at 43.99 and a negative MACD histogram of -33.904297 show that momentum is not confirming the trend cleanly.
H4 adds near-term downside pressure rather than independent weekly direction: its bearish tactical state, RSI at 34.72 and negative MACD histogram of -3.813218 contrast with the D1 thesis. A move through 2530.6 would improve the bullish structure toward 2620.1385, while weakness through 2416.34651 would keep 2355.04 and 2283.78 relevant as bearish alternatives.
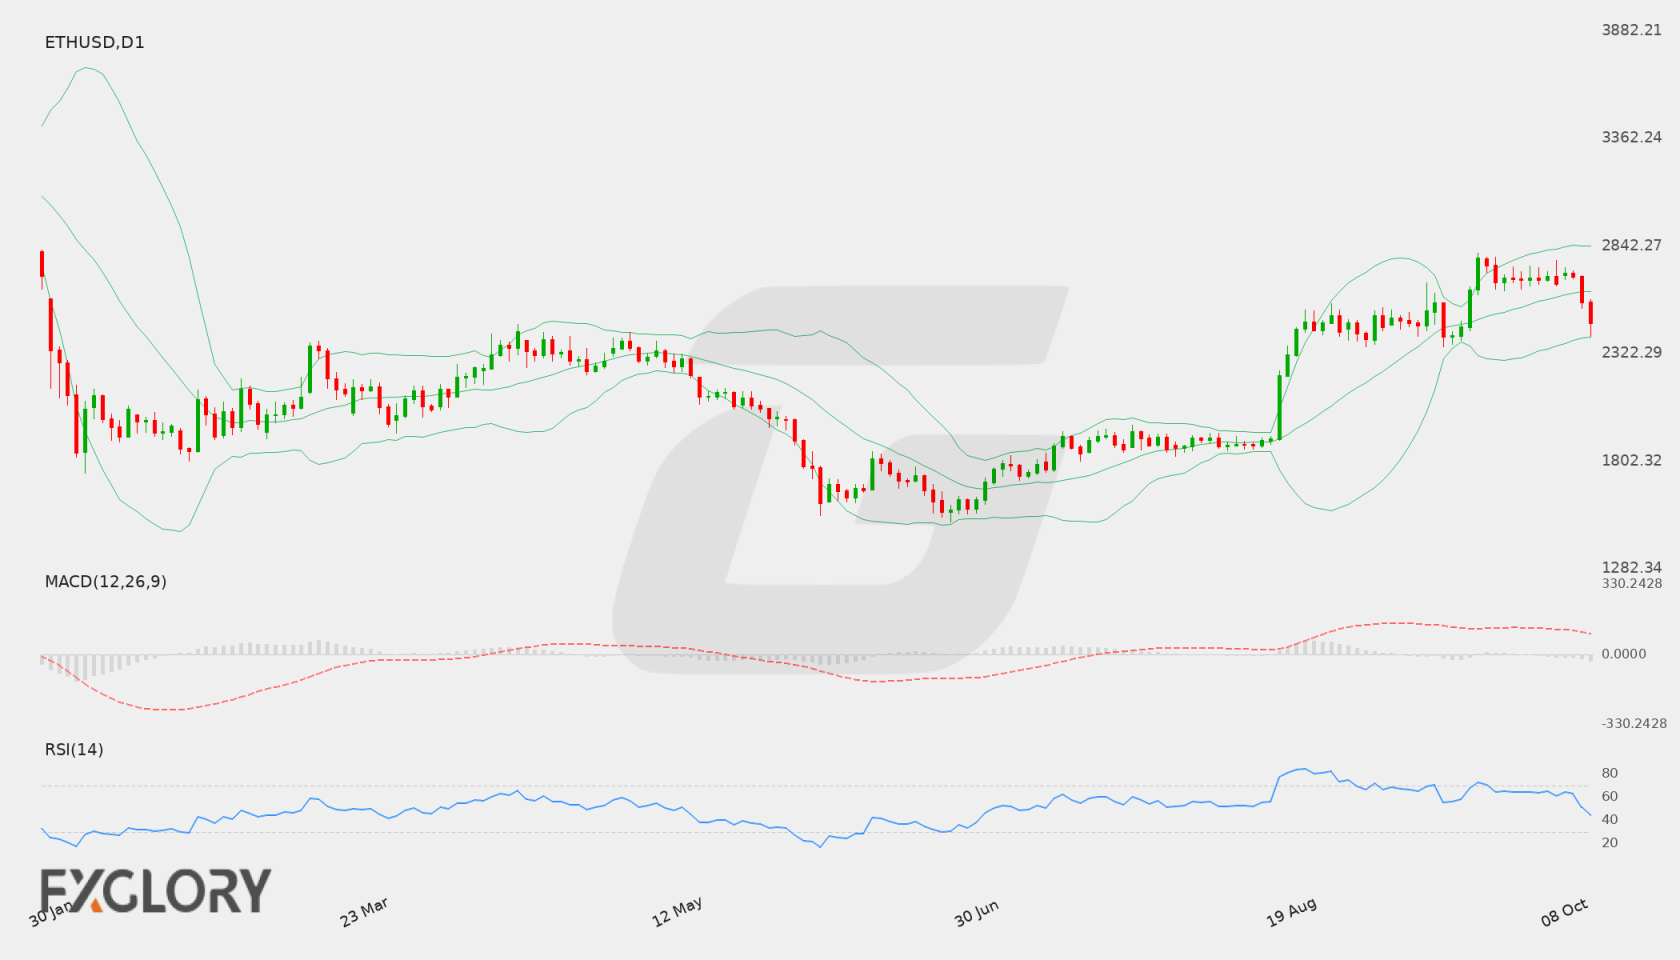
ETH/USD D1 technical-analysis context for the weekly forecast. Chart data captured 11 October 2026.
Broader macroeconomic conditions, interest rate expectations, and shifts in risk appetite continue to influence ETH/USD (ETHUSD). Market participants monitor overall digital asset liquidity alongside key economic releases to gauge general directional sentiment.
Price Action:
ETH/USD closed the latest daily session at 2695.5, consolidating following a prior advance to a high of 2804.97. Daily price action indicates that the pair has held above recent pullbacks, maintaining steady positioning after reaching higher territory.
Key Technical Indicators:
Bollinger Bands: Daily Bollinger Bands show the middle band at 2582.32, the upper band at 2822.36, and the lower band at 2342.27. Trading at 2695.5 positions ETH/USD comfortably in the upper half of the envelope above the 20-day moving average.
RSI: The 14-day RSI is currently at 64.62, reflecting solid bullish momentum while remaining beneath overbought boundaries.
MACD: The MACD indicator for ETH/USD currently stands at 111.42, remaining in positive territory and signaling ongoing bullish momentum across the daily timeframe.
Support and Resistance:
Immediate resistance for ETH/USD sits at 2804.97, reinforced by the upper Bollinger Band near 2822.36. On the downside, dynamic support is positioned at the middle band of 2582.32, with primary horizontal support established at 1734.45.
News to Watch for ETHUSD This Week:
ISM Services PMI: This survey assesses business activity in the service sector and can drive shifts in overall market risk sentiment.
FOMC Meeting Minutes: Insights into Federal Reserve monetary policy debates may influence the US dollar and broader cryptocurrency liquidity.
Unemployment Claims: Weekly labor market updates provide indications of employment stability that affect risk asset demand.
Prelim UoM Inflation Expectations: Revisions to consumer price projections can influence monetary policy expectations and speculative appetite.
Prelim UoM Consumer Sentiment: Confidence metrics offer perspective on household economic views that may impact participation in financial markets.
Weekly Outlook and Consideration:
ETH/USD (ETHUSD) enters the week with positive technical indicators, highlighted by a daily close of 2695.5, an RSI of 64.62, and a positive MACD of 111.42. Sustained trading above the middle Bollinger Band at 2582.32 could allow buyers to retest the resistance level at 2804.97 and the upper band at 2822.36. Should upside momentum moderate, a corrective retracement could target dynamic support at 2582.32, with 1734.45 serving as the key underlying support marker.
Disclaimer: The analysis provided for ETH/USD is for informational purposes only and does not constitute investment advice. Traders are encouraged to perform their own analysis and research before making any trading decisions. Market conditions can change quickly, so staying informed with the latest data is essential.
ETH/USD market dynamics remain tied to broader macroeconomic risk sentiment and liquid capital flows influencing the cryptocurrency sector. Upcoming US manufacturing indicators may affect overall dollar strength and market liquidity, impacting investor appetite across risk assets like Ethereum.
Price Action:
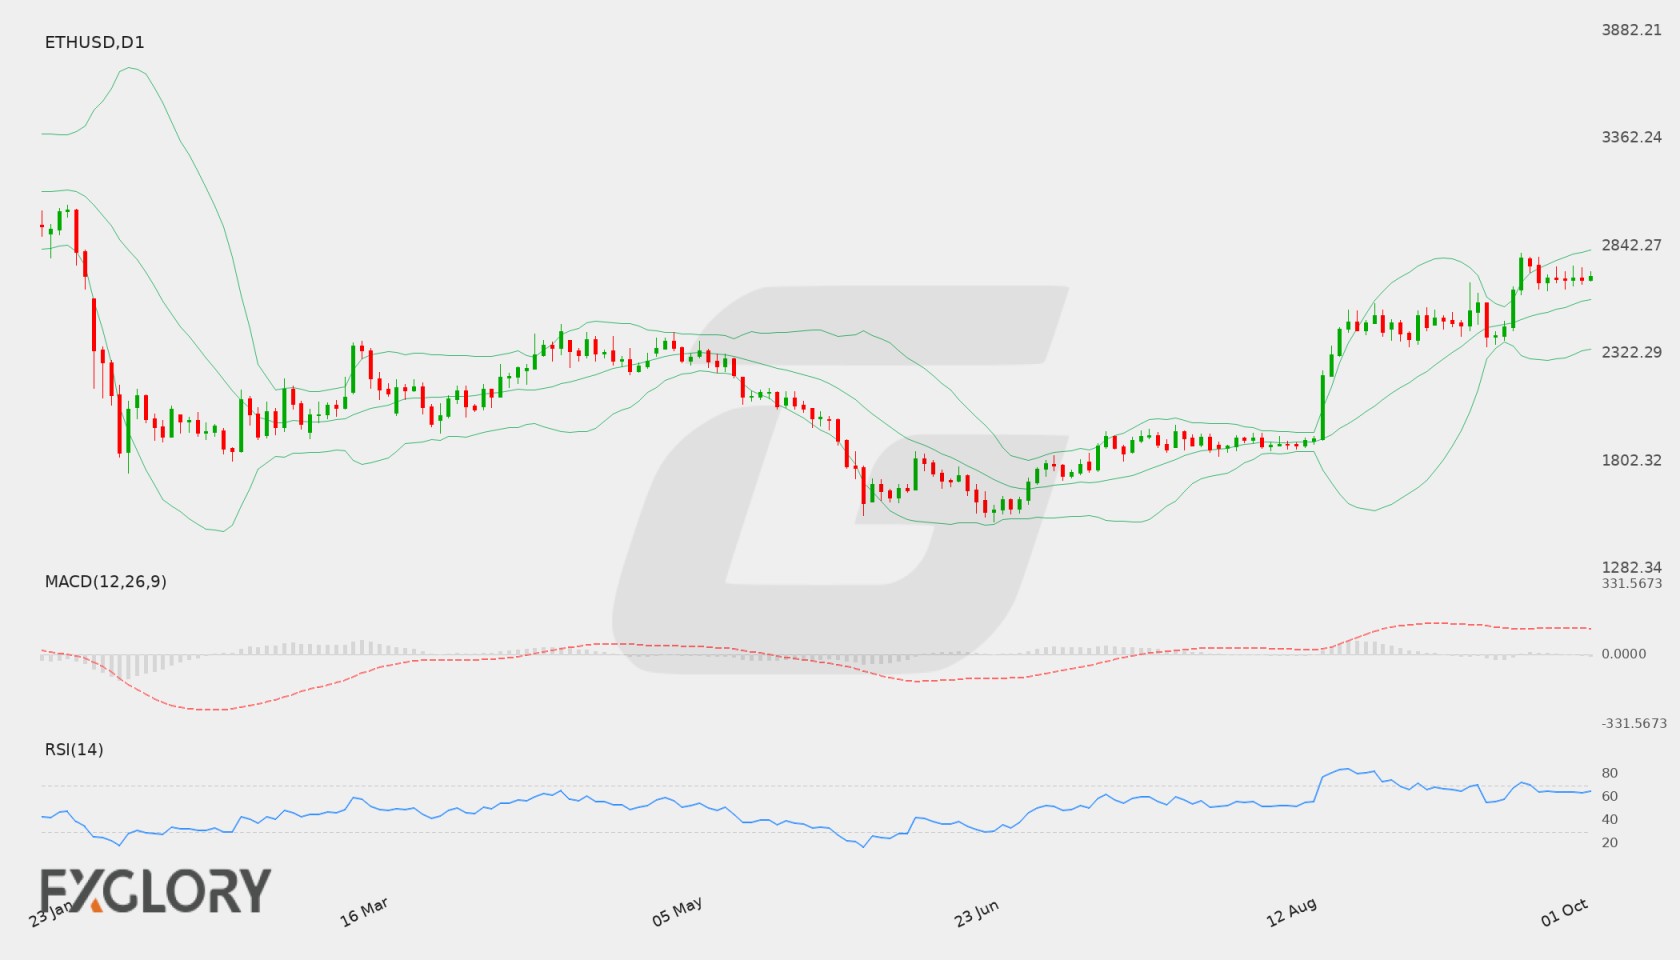
ETH/USD showed a significant upward move on the daily chart, surging from recent lows near 2403.93 up to a high of 2804.97 before settling around 2685.41. The price action demonstrates strong buying pressure during the push upward, followed by a slight consolidation phase near the recent peak.
Key Technical Indicators:
Bollinger Bands: The daily Bollinger Bands highlight elevated volatility. The upper band is situated at 2753.50, the middle band at 2521.59, and the lower band at 2289.68. Trading above the middle band at 2685.41 keeps ETH/USD positioned in the upper portion of its volatility channel.
RSI: The 14-day Relative Strength Index (RSI) stands at 64.52, confirming constructive buying interest while staying comfortably below overbought conditions.
MACD: The MACD indicator registers at 129.20, remaining firmly positive and reflecting sustained bullish momentum on the daily timeframe.
Support and Resistance:
Immediate key resistance is located at 2804.97, corresponding to recent daily peaks. On the downside, broad technical support is identified at 1688.23.
News to Watch for ETHUSD This Week:
ISM Manufacturing PMI: Shifts in broad manufacturing strength can influence market risk appetite and impact digital asset valuations.
ISM Manufacturing Prices: Inflationary trends within manufacturing can drive US dollar movements and affect capital allocation to risk assets.
Weekly Outlook and Consideration:
ETH/USD carries positive momentum into the week after testing resistance at 2804.97 and maintaining its ground near 2685.41. With the RSI at 64.52 and MACD at 129.20, technical indicators point to ongoing strength. As long as price holds above the middle Bollinger Band at 2521.59, the constructive bias remains, though macroeconomic releases could induce temporary volatility.
Disclaimer: The analysis provided for ETH/USD is for informational purposes only and does not constitute investment advice. Traders are encouraged to perform their own analysis and research before making any trading decisions. Market conditions can change quickly, so staying informed with the latest data is essential.
ETH/USD trading dynamics continue to be driven by general cryptocurrency market risk appetite alongside broader macroeconomic sentiment. Market participants closely evaluate oncoming economic indicators, which frequently influence investor sentiment across risk-sensitive digital assets like Ethereum.
Price Action:
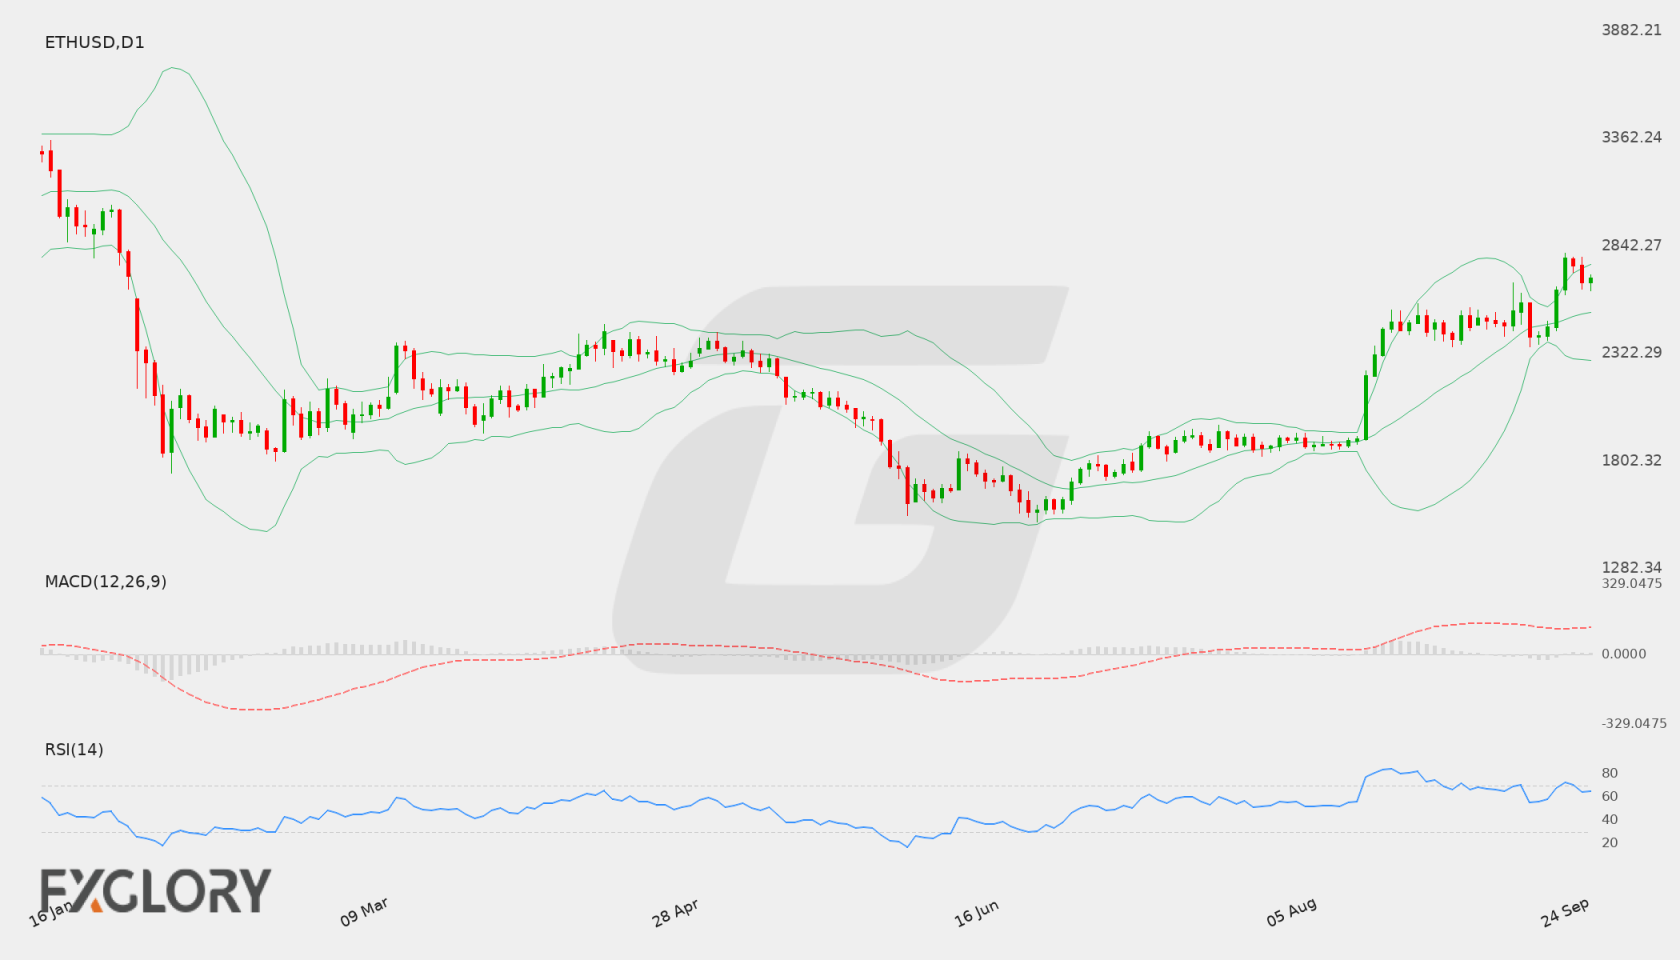
On the daily D1 chart, ETH/USD pushed toward a high near 2664.32 before undergoing a minor pullback to 2403.93. The pair subsequently recovered to settle at a last close of 2449.51, demonstrating consolidation after recent upward moves.
Key Technical Indicators:
Bollinger Bands: The Bollinger Bands indicate a middle band at 2461.89, an upper band at 2548.31, and a lower band at 2375.48. Price action near the 2461.89 middle band reflects market balance within the current volatility bounds.
RSI: The 14-day RSI stands at 58.28, remaining in constructive neutral-to-bullish territory while staying clear of overbought extremes.
MACD: The MACD sits at 97.03, maintaining a positive stance above the signal baseline and reflecting continued underlying bullish momentum on the daily timeframe.
Support and Resistance:
Key technical benchmarks on the daily chart feature strong support at 1508.09 and upper resistance at 2664.32.
News to Watch for ETHUSD This Week:
CB Consumer Confidence: Measures consumer economic outlook which can influence overall market risk sentiment.
JOLTS Job Openings: Indicates labor demand strength that can impact broader market dynamics.
ADP Non-Farm Employment Change: Provides an early indicator of private payroll trends affecting market risk appetite.
Core PCE Price Index m/m: Tracks key inflation metrics that influence market liquidity conditions.
Final GDP q/q: Reflects broader economic health and overall investor sentiment.
ISM Manufacturing PMI: Assesses manufacturing activity that sways general risk asset demand.
Unemployment Rate: Highlights labor market health driving global economic risk preference.
Weekly Outlook and Consideration:
ETH/USD enters the week consolidated near 2449.51, slightly below its daily Bollinger middle band of 2461.89. Supportive technical readings, including an RSI of 58.28 and MACD of 97.03, favor a constructive tone. A renewed bullish drive could see price approach key resistance at 2664.32, whereas sustained downside pressure beneath the lower band at 2375.48 might shift attention toward long-term support at 1508.09.
Disclaimer: The analysis provided for ETH/USD is for informational purposes only and does not constitute investment advice. Traders are encouraged to perform their own analysis and research before making any trading decisions. Market conditions can change quickly, so staying informed with the latest data is essential.
ETH/USD market dynamics remain sensitive to global liquidity conditions and overall risk appetite. Macroeconomic announcements from the United States, particularly central bank rate decisions and consumer spending data, frequently influence broader market sentiment, impacting crypto valuations including ETHUSD. Traders closely monitor upcoming monetary policy updates and economic indicators for directional cues.
Price Action:
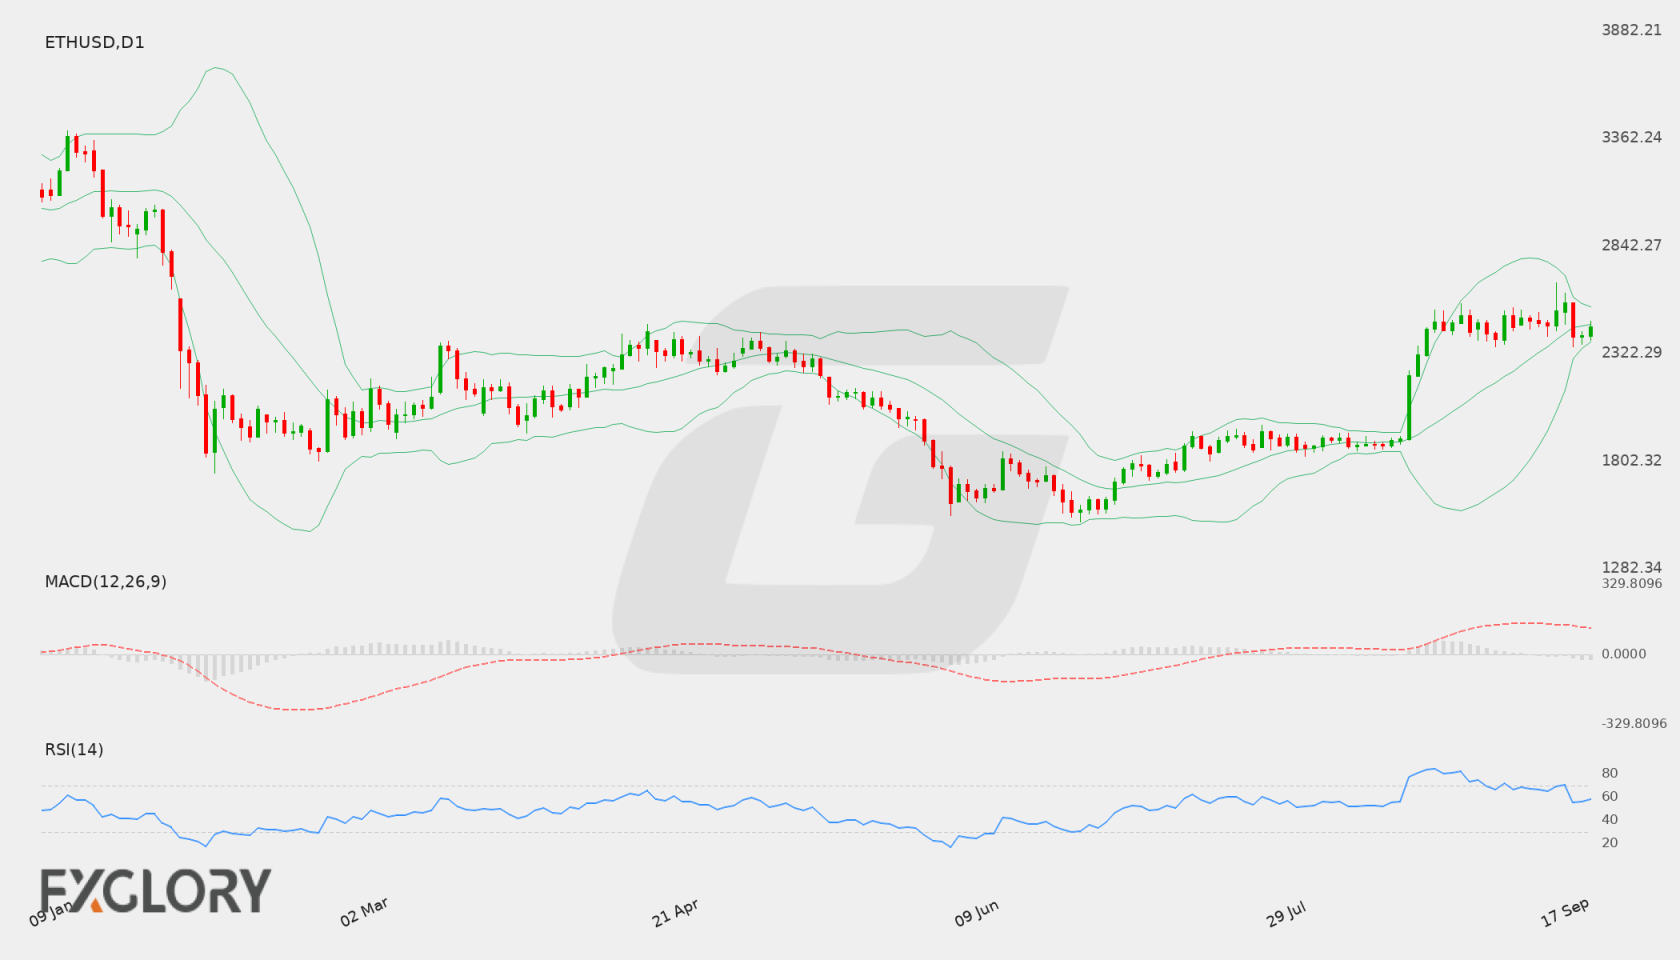
The ETH/USD pair recently closed at 2458.84, demonstrating sustained buying interest after building momentum from lower levels. The daily chart reflects a series of higher closes, pushing price action toward local peak levels as buyers test overhead supply. Current price structure indicates a strong consolidation near key resistance areas.
Key Technical Indicators:
Bollinger Bands: The Bollinger Bands display a middle band at 2355.11, an upper band at 2762.23, and a lower band at 1947.99. ETH/USD is trading near 2458.84, holding above the middle band, which indicates a positive trend orientation within the expanded envelope.
RSI: The 14-day Relative Strength Index (RSI) stands at 64.90. Operating above the neutral 50 level without crossing into overbought territory above 70, the indicator suggests ongoing bullish strength with potential room for further price exploration.
MACD: The MACD indicator prints a reading of 131.86, remaining well above the zero line. This positive value highlights active bullish momentum across daily timeframes, reflecting persistent upward pressure on ETHUSD.
Support and Resistance:
Key technical levels for ETH/USD include immediate resistance at 2564.28 and broader major support at 1508.09. A sustained breach above resistance could clear the way toward upper band targets, while failure to hold gains may lead back toward intermediate support levels.
News to Watch for ETHUSD This Week:
Core Retail Sales m/m: Shifts in core consumer purchasing patterns offer insight into broader US economic strength that impacts market risk sentiment.
Retail Sales m/m: Overall consumer spending figures provide key indications of economic activity that can influence asset valuations.
FOMC Economic Projections: Updated macroeconomic forecasts present the central bank outlook on inflation and growth, affecting financial markets.
FOMC Statement: Official policy communications outline the monetary stance and liquidity conditions driving global asset prices.
Federal Funds Rate: Official benchmark rate decisions directly influence borrowing costs, liquidity, and general market risk appetite.
FOMC Press Conference: Detailed commentary from Fed leadership provides crucial context regarding future policy paths and market volatility.
Unemployment Claims: Weekly labor market updates offer timely snapshots of economic stability and investor sentiment.
Weekly Outlook and Consideration:
ETH/USD enters the week with a positive bias after closing at 2458.84. Technical indicators support buyer control, with the RSI at 64.90 and MACD at 131.86 signaling steady momentum above the middle Bollinger Band at 2355.11. The primary challenge for bulls lies at the immediate resistance level of 2564.28. A clear breakout above this threshold could see price action test the upper Bollinger Band at 2762.23. Conversely, if resistance holds firm, a corrective phase toward middle support at 2355.11 or lower could unfold, especially in response to upcoming high-tier US macroeconomic releases. Major long-term structural support remains anchored at 1508.09.
Disclaimer: The analysis provided for ETH/USD is for informational purposes only and does not constitute investment advice. Traders are encouraged to perform their own analysis and research before making any trading decisions. Market conditions can change quickly, so staying informed with the latest data is essential.