
BTCEUR Forecast

BTC/EUR Forecast — 20 September 2026

Time Zone: GMT +3

Time Frame: Daily (D1) / Weekly Outlook

Weekly Fundamental Overview:

The fundamental environment for BTC/EUR (BTCEUR) is shaped by dynamic global crypto market liquidity alongside economic conditions within the Eurozone. Changes in European inflation metrics can alter Euro strength, impacting how the pair trades relative to broader risk appetite across financial markets.

Price Action:

On the daily D1 chart, BTC/EUR (BTCEUR) closed at 66638.79 following recent fluctuations. Price action demonstrates an overall holding pattern above the key support zone at 50609.45, while upside advances currently face technical overhead near the primary resistance level at 70712.60.

Key Technical Indicators:

Bollinger Bands: The D1 Bollinger Bands show a middle line at 67356.47, an upper band at 69383.66, and a lower band at 65329.29. With the latest close at 66638.79 sitting just beneath the middle line, price action reflects moderate short-term consolidation within the broader volatility band.

RSI: The 14-period Daily RSI is currently reading 56.59. This places the oscillator in neutral-to-bullish territory, suggesting healthy upward bias without signaling overbought conditions.

MACD: The D1 MACD indicator records a positive value of 1786.91. This indicates that underlying bullish momentum remains present on the daily timeframe despite current sideways trading activity.

Support and Resistance:

Key technical benchmarks for BTC/EUR (BTCEUR) include primary resistance at 70712.60, which limits recent upward attempts. On the downside, critical support is established at 50609.45 to defend against potential pullbacks.

News to Watch for BTCEUR This Week:

  • German Prelim CPI m/m: German inflation figures offer fundamental context regarding economic health that can impact Euro strength and risk asset sentiment.
  • CPI Flash Estimate y/y: Headline Eurozone consumer price data provides key insights into broader inflation dynamics across the monetary union.
  • Core CPI Flash Estimate y/y: Core inflation releases help clarify underlying pricing trends that influence overall currency valuation and market sentiment.

Weekly Outlook and Consideration:

The weekly outlook for BTC/EUR (BTCEUR) indicates a technical setup defined by neutral-to-bullish momentum. Supported by an RSI of 56.59 and a positive MACD of 1786.91, the pair holds an intact broader structure. However, trading slightly below the daily Bollinger middle band at 67356.47 suggests potential consolidation before any sustained test of the 70712.60 resistance. Traders should monitor price behavior around the 50609.45 support and key Eurozone macroeconomic releases for further directional cues.

Disclaimer: The analysis provided for BTC/EUR is for informational purposes only and does not constitute investment advice. Traders are encouraged to perform their own analysis and research before making any trading decisions. Market conditions can change quickly, so staying informed with the latest data is essential.
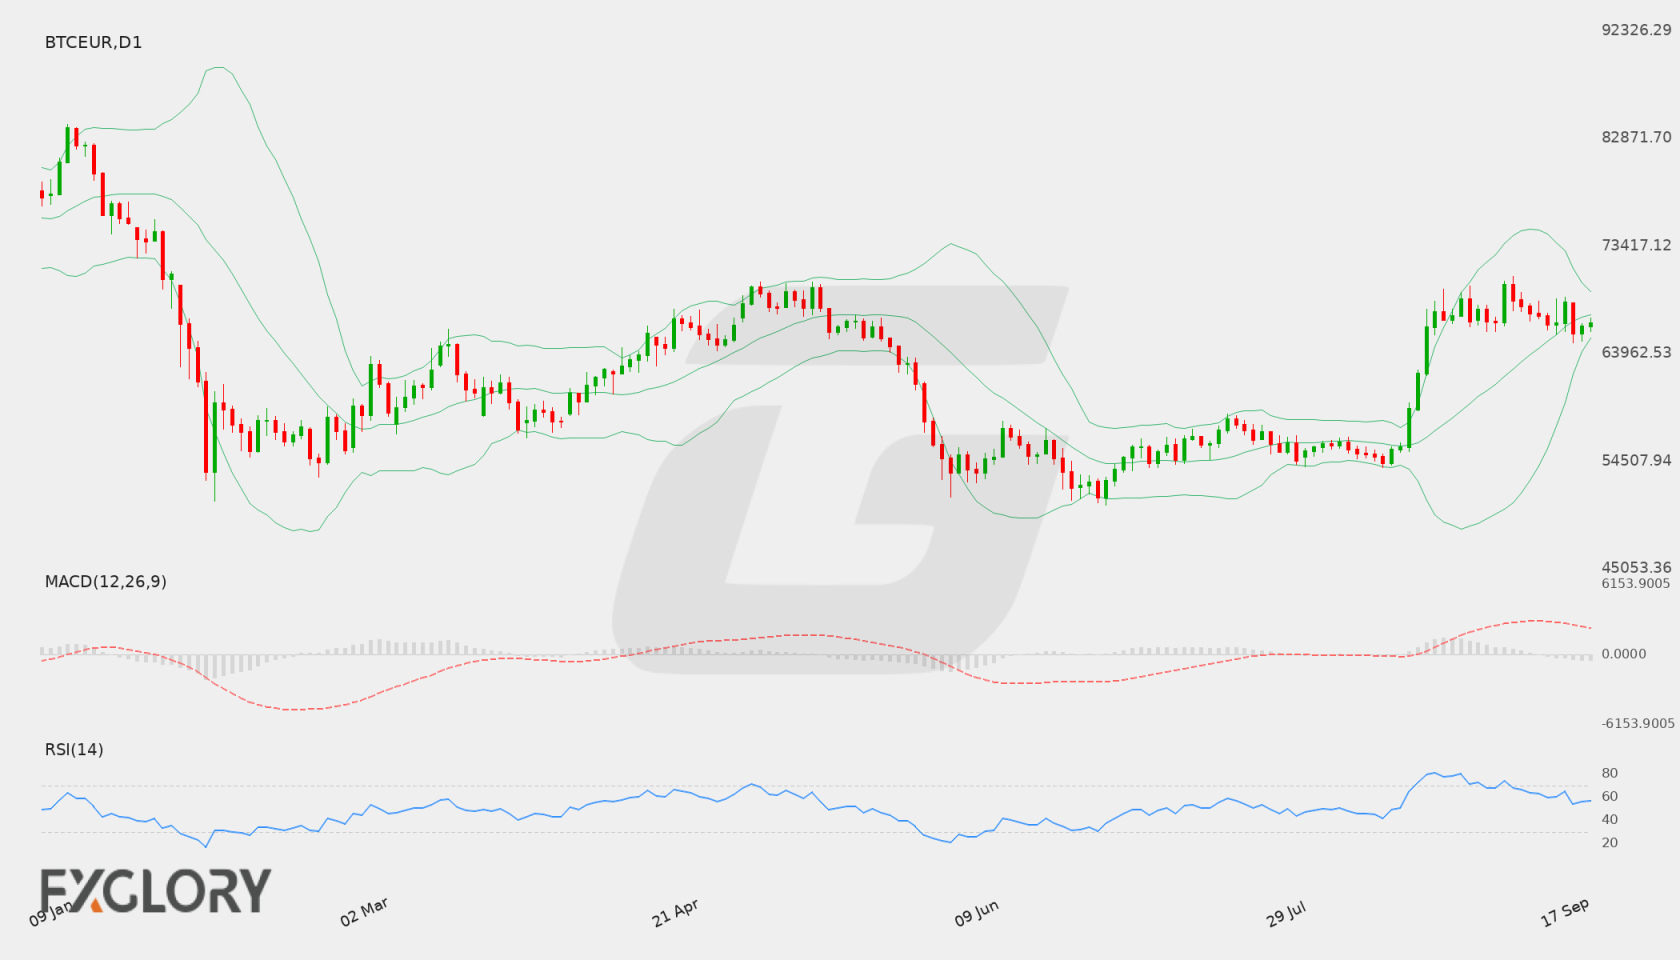
BTC/EUR D1 technical analysis chart
BTC/EUR D1 Technical Analysis for 09.20.2026

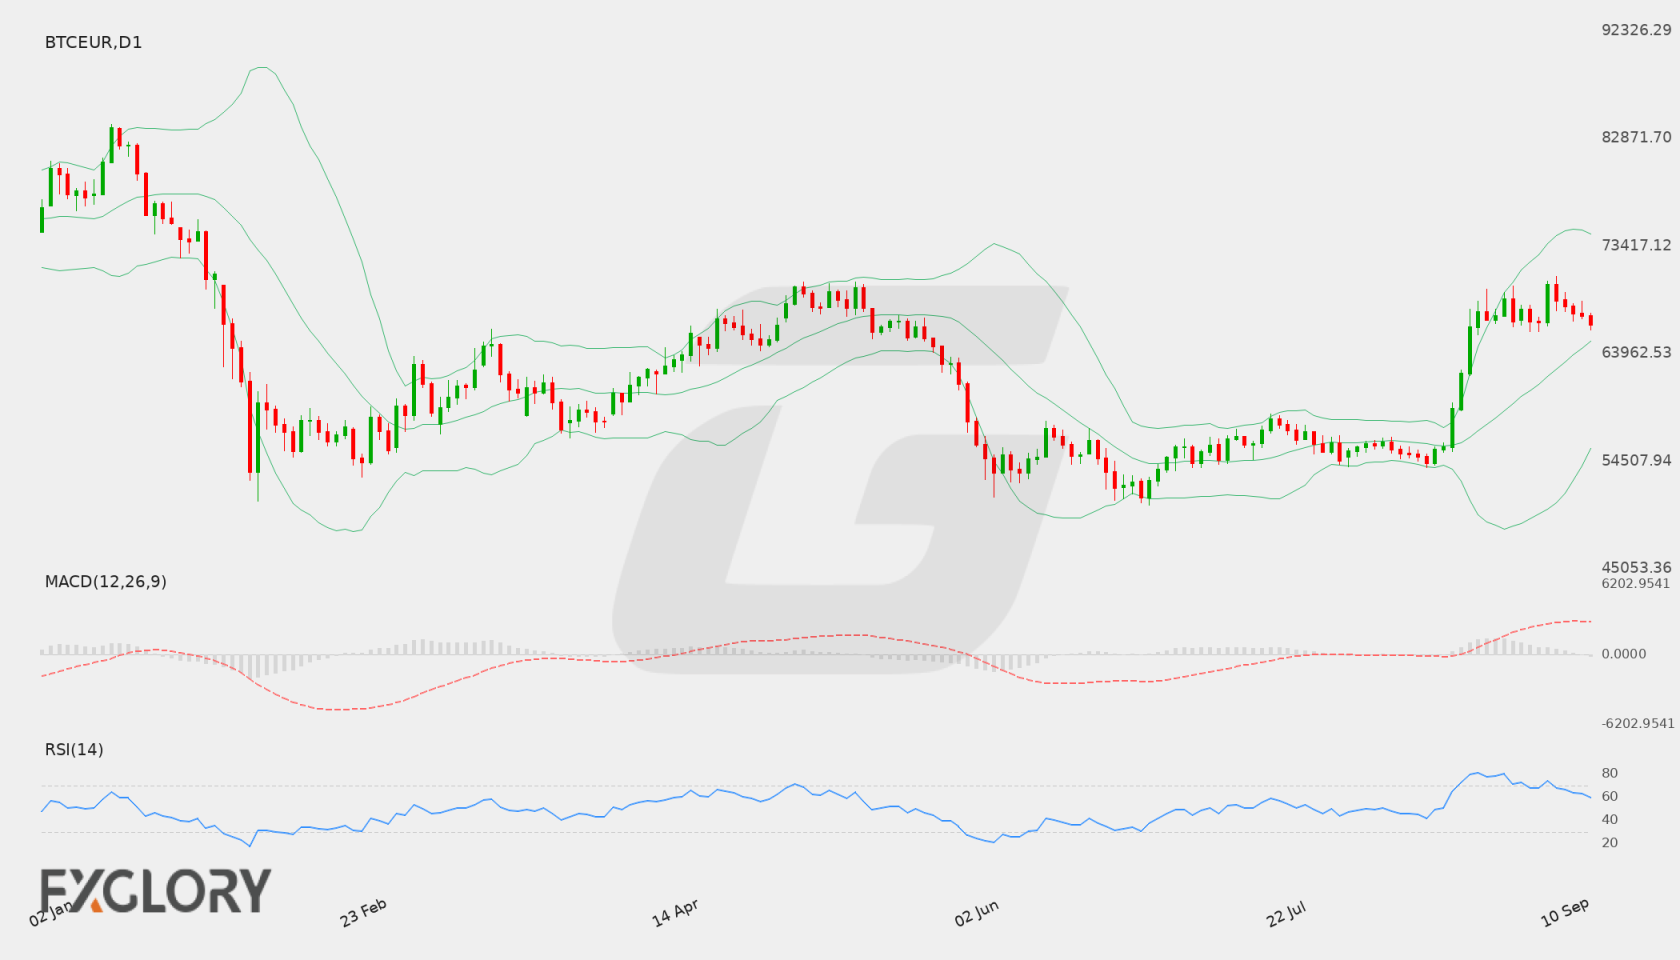
BTC/EUR Forecast — 12 September 2026

Time Zone: GMT +3

Time Frame: Daily (D1) / Weekly Outlook

Weekly Fundamental Overview:

BTC/EUR price dynamics remain tied to global cryptocurrency risk sentiment and macroeconomic conditions within the Eurozone. Fluctuations in risk appetite and Euro liquidity can influence price behavior across digital asset markets.

Price Action:

The daily chart shows BTC/EUR recently pulling back slightly to close at 66511.73 after attempting a run toward recent highs. The price structure shows sustained recovery from earlier consolidated lows near the 54000 area, maintaining a higher-range posture overall.

Key Technical Indicators:

Bollinger Bands: The Bollinger Bands display a middle band at 65007.10, an upper band at 74436.56, and a lower band at 55577.64. Trading at 66511.73 places BTCEUR above the middle line, suggesting a moderate upside bias within the current volatility channel.

RSI: The 14-period RSI is currently at 59.28, remaining above the neutral 50 level and pointing to modest bullish strength without entering overbought territory.

MACD: The MACD indicator is positive at 2642.42, signaling persistent upward momentum on the daily timeframe despite brief pullbacks.

Support and Resistance:

Key daily technical levels are marked by major resistance at 70712.60 and primary support down at 50609.45.

News to Watch for BTCEUR This Week:

  • French Flash Manufacturing PMI: Measures manufacturing sector health in France, which can influence broader Euro sentiment and financial markets.
  • French Flash Services PMI: Reflects economic activity in the French services industry and may impact risk appetite across European assets.
  • German Flash Manufacturing PMI: Tracks factory output conditions in Germany, serving as a primary indicator of Eurozone economic momentum.

Weekly Outlook and Consideration:

BTC/EUR maintains a slightly bullish technical stance, trading above its daily middle Bollinger Band of 65007.10 with an RSI of 59.28 and a positive MACD of 2642.42. Further upside potential may depend on testing resistance near 70712.60, while key support remains established at 50609.45. Upcoming Eurozone Flash PMI releases could impact Euro valuations, providing secondary macro context for the pair.

Disclaimer: The analysis provided for BTC/EUR is for informational purposes only and does not constitute investment advice. Traders are encouraged to perform their own analysis and research before making any trading decisions. Market conditions can change quickly, so staying informed with the latest data is essential.
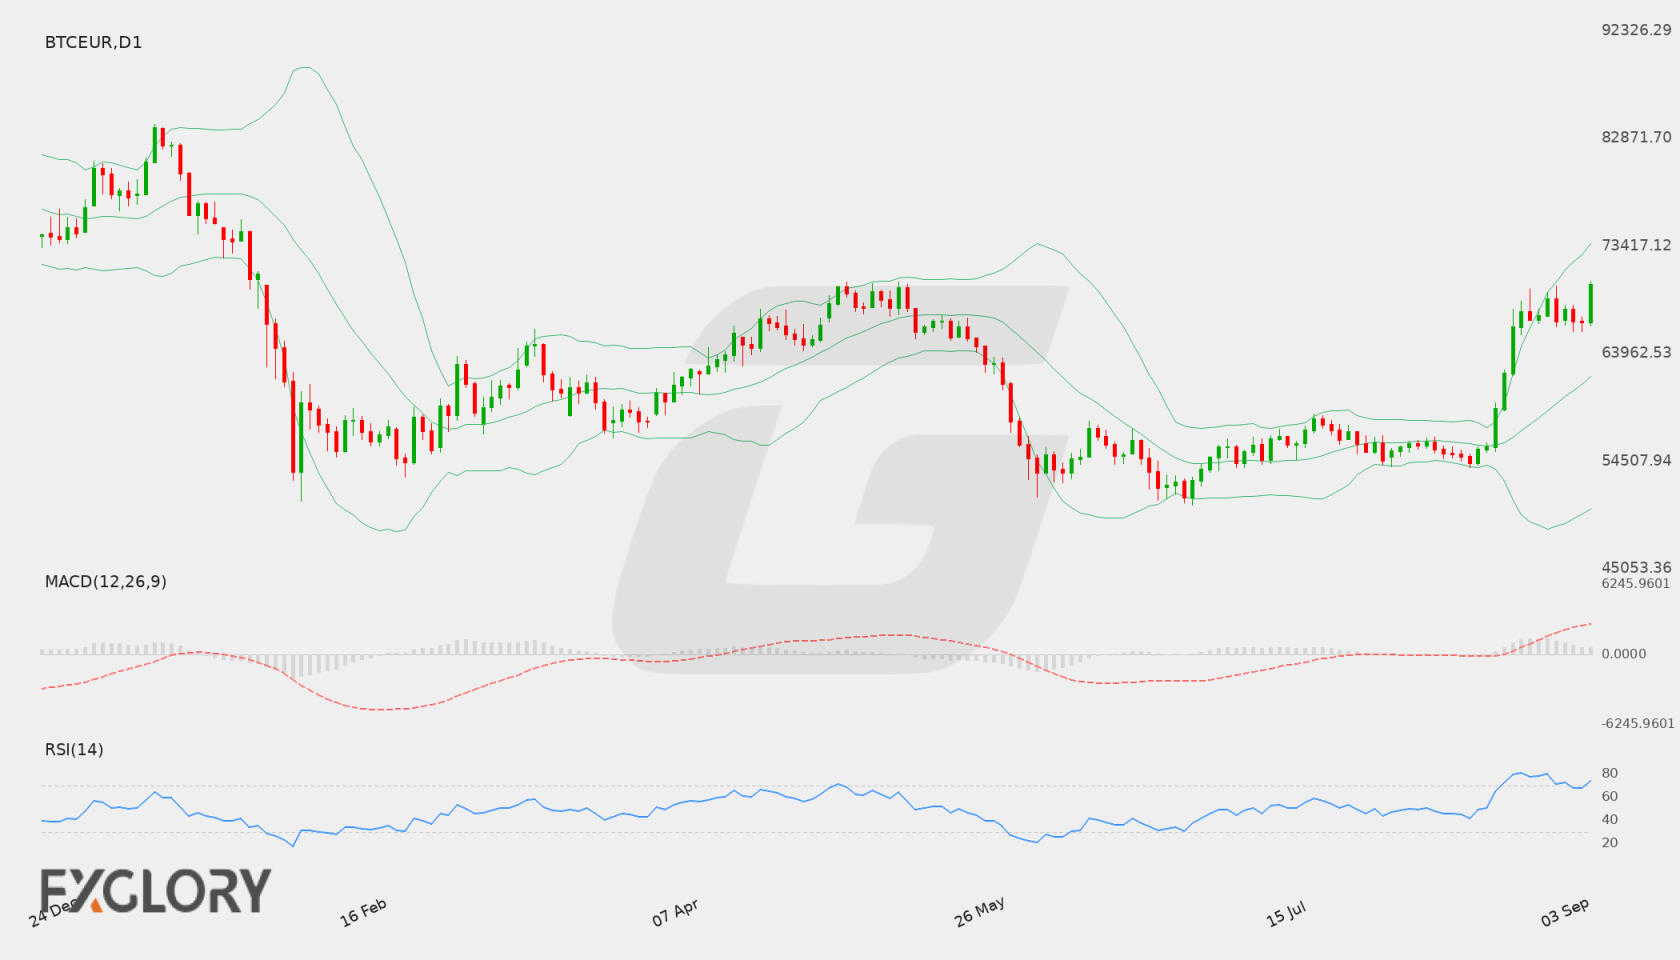
BTC/EUR D1 technical analysis chart
BTC/EUR D1 Technical Analysis for 09.12.2026

BTC/EUR Forecast — 5 September 2026

Time Zone: GMT +3

Time Frame: Daily (D1) / Weekly Outlook

Weekly Fundamental Overview:

Fundamental dynamics for BTC/EUR (BTCEUR) are influenced by broader digital asset adoption and key European economic developments. European monetary policy decisions and liquidity conditions remain critical drivers for euro valuation, which indirectly impacts pricing and volatility across BTCEUR trading pairs.

Price Action:

Daily price action shows a strong bullish expansion, with BTC/EUR reaching a close of 70044.53. The pair has steadily advanced from previous consolidation areas around 54000 to 56000, bringing price near local high resistance at 70306.97.

Key Technical Indicators:

Bollinger Bands: The price trades solidly above the middle Bollinger Band of 61945.40, moving toward the upper band at 73649.00. The lower band sits at 50241.79, reflecting increased volatility and upside market pressure on the D1 chart.

RSI: The 14-period Relative Strength Index (RSI) stands at 73.75, placing the indicator in overbought territory. While this underscores robust buying pressure, it also flags the possibility of temporary pullbacks or brief consolidation.

MACD: The MACD indicator records a value of 3295.00, maintaining a positive position above the signal line. This indicates persistent upside momentum for BTCEUR.

Support and Resistance:

Immediate resistance for BTC/EUR is located at 70306.97, with secondary upper boundaries defined near the upper Bollinger Band of 73649.00. Key daily support is identified at 50609.45, backed by dynamic support near the middle Bollinger Band at 61945.40.

News to Watch for BTCEUR This Week:

  • Monetary Policy Statement: Official insights into central bank economic sentiment can influence euro liquidity and crypto demand.
  • Main Refinancing Rate: Decisions regarding benchmark rates affect overall risk appetite and capital allocation in financial markets.
  • ECB Press Conference: Statements during the conference can generate market volatility across euro-denominated asset classes.

Weekly Outlook and Consideration:

The BTC/EUR daily outlook remains overall bullish following a surge to 70044.53, placing price action right below technical resistance at 70306.97. Supported by a positive MACD reading of 3295.00 and trading above the middle Bollinger Band at 61945.40, the trend favors buyers. Nevertheless, an overbought RSI reading of 73.75 suggests traders should stay mindful of potential short-term pullbacks toward primary support at 50609.45 before attempting further upward trajectory.

Disclaimer: The analysis provided for BTC/EUR is for informational purposes only and does not constitute investment advice. Traders are encouraged to perform their own analysis and research before making any trading decisions. Market conditions can change quickly, so staying informed with the latest data is essential.
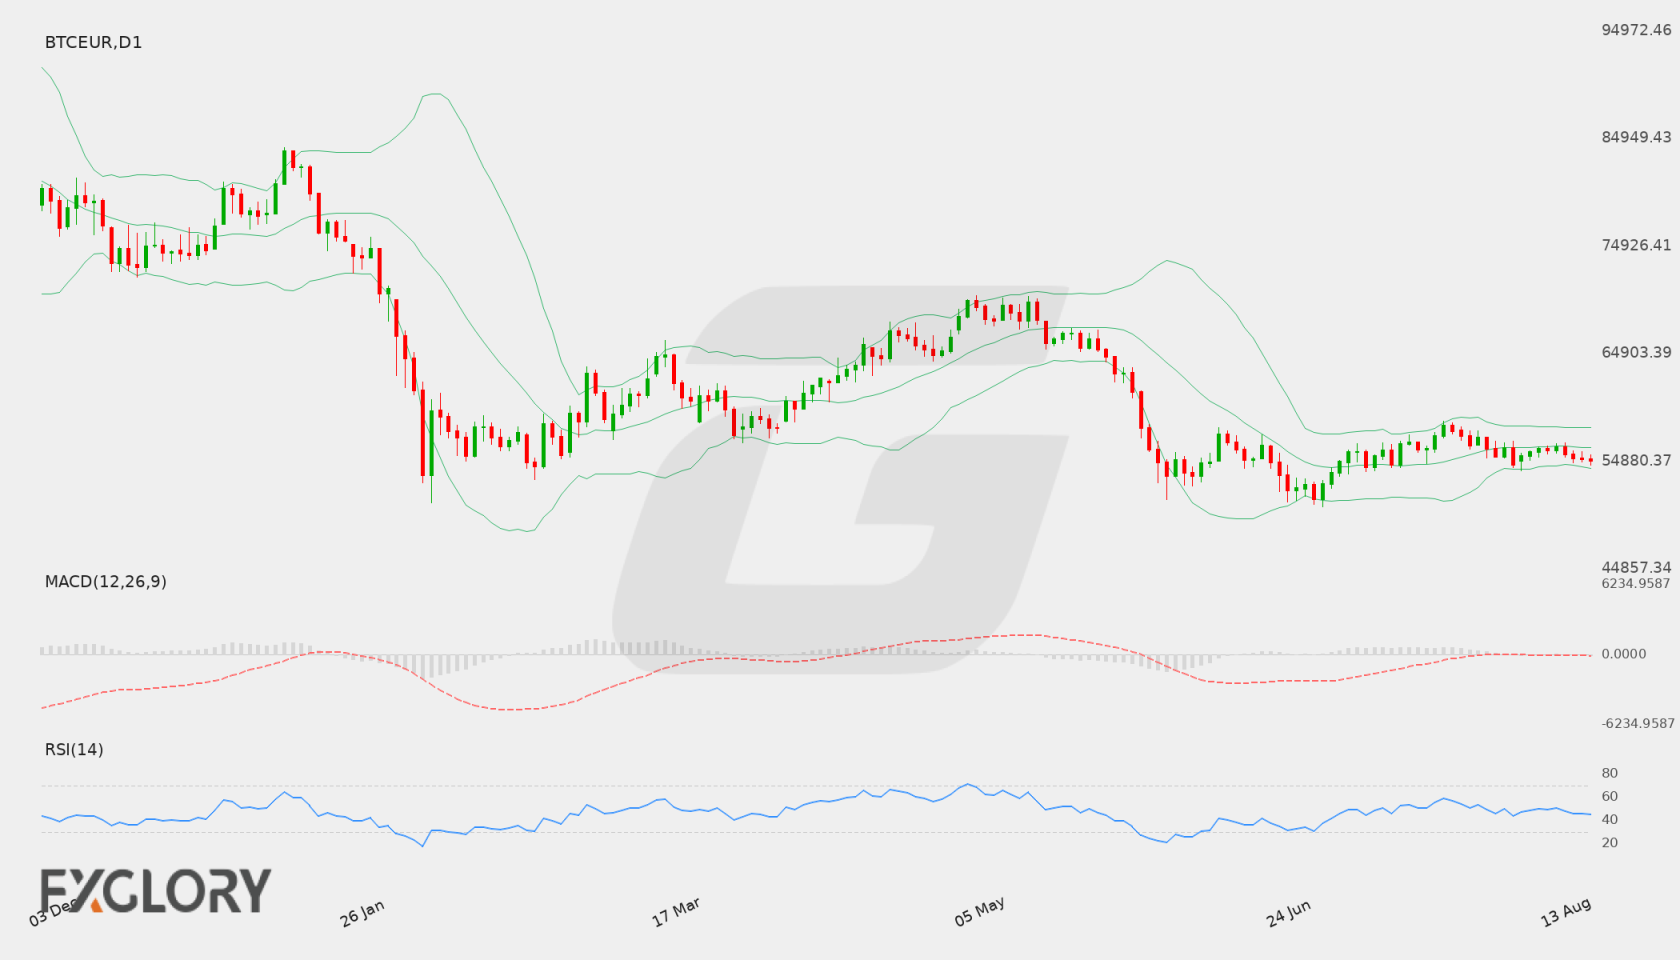
BTC/EUR D1 technical analysis chart
BTC/EUR D1 Technical Analysis for 09.05.2026

BTC/EUR Forecast — 22 August 2026

Time Zone: GMT +3

Time Frame: Daily (D1) / Weekly Outlook

Weekly Fundamental Overview:

Broad market risk sentiment and Eurozone macroeconomic developments continue to influence capital flows into digital assets like BTC/EUR. As inflation data from the region enters focus, traders monitor how monetary policy expectations might affect liquidity and market volatility.

Price Action:

The daily chart for BTC/EUR (BTCEUR) reflects a powerful upward movement, pushing the asset from recent lows near 54,307.27 up to a close at 62,193.61. This sharp rally indicates dominant buying pressure, although the rapid rise leaves open the possibility of short-term consolidation.

Key Technical Indicators:

Bollinger Bands: The daily Bollinger Bands display a middle line at 56,111.38, an upper band at 59,520.63, and a lower band at 52,702.13. With the current price of 62,193.61 closing well above the upper band, market conditions reflect heightened volatility and a strong short-term bullish stretch.

RSI: The 14-period RSI stands at 72.45, crossing above the 70 overbought threshold. While this underscores the current strength of the buyers, it also alerts traders to potential overextended conditions that could precede a brief pause or pullback.

MACD: The MACD indicator is currently at 557.07, positioning itself well above the signal line in positive territory. This confirms strong bullish momentum on the daily timeframe, though traders keep an eye out for potential signs of slowing momentum.

Support and Resistance:

Key price levels on the daily timeframe reveal immediate resistance at 63,602.43. On the downside, technical support is anchored at 50,609.45, with intermediate dynamic support aligned near the middle Bollinger Band around 56,111.38.

News to Watch for BTCEUR This Week:

  • German Prelim CPI m/m: Inflation trends in Germany can impact Euro sentiment and influence overall liquidity across European financial markets.
  • CPI Flash Estimate y/y: Eurozone inflation figures provide insights into central bank policy expectations and risk appetite.
  • Core CPI Flash Estimate y/y: Core inflation measurements offer a clearer view of underlying price pressures that affect broader asset valuations.

Weekly Outlook and Consideration:

BTCEUR maintains a strong bullish outlook following a steep ascent to the 62,193.61 mark. Indicator signals are supportive of the uptrend, as demonstrated by the positive MACD value of 557.07. However, with the RSI at 72.45 and price trading above the upper Bollinger Band at 59,520.63, the pair is in overbought territory. A sustained move higher could target primary resistance at 63,602.43, whereas a temporary corrective move could test support levels near 50,609.45. Market participants will also monitor upcoming economic developments for shifts in broader market sentiment.

Disclaimer: The analysis provided for BTC/EUR is for informational purposes only and does not constitute investment advice. Traders are encouraged to perform their own analysis and research before making any trading decisions. Market conditions can change quickly, so staying informed with the latest data is essential.

BTC/EUR Forecast — 15 August 2026

Time Zone: GMT +3

Time Frame: Daily (D1) / Weekly Outlook

Weekly Fundamental Overview:

Broader economic conditions across Europe and overall cryptocurrency market sentiment continue to influence BTC/EUR. Shifts in institutional capital flows, regulatory developments, and economic indicators within the Eurozone can impact market volatility and trader sentiment.

Price Action:

On the Daily (D1) chart, BTC/EUR closed recently at 54,934.46 after experiencing a period of sideways movement and consolidation following a pullback from higher levels. Prices have been testing lower boundary levels while attempting to stabilize near current market prices.

Key Technical Indicators:

Bollinger Bands: The Bollinger Bands indicator shows a middle band at 56,086.10, an upper band at 57,975.72, and a lower band at 54,196.48. Price action near the lower band suggests potential support, while the middle band remains an immediate upside resistance area.

RSI: The 14-period Relative Strength Index (RSI) stands at 44.56, placing the instrument in neutral-to-bearish territory below the 50 level without signaling oversold conditions.

MACD: The Daily MACD prints a negative value of -246.61, reflecting ongoing bearish momentum over recent trading sessions, though histogram contraction could hint at potential momentum shifts.

Support and Resistance:

Key technical levels on the Daily chart show key support at 50,609.45 and major resistance at 67,092.26, providing critical boundaries for prospective price moves.

News to Watch for BTCEUR This Week:

  • French Flash Services PMI: Measures economic activity in the French services sector which can impact Euro volatility and broader market sentiment.

Weekly Outlook and Consideration:

BTC/EUR is expected to consolidate within the current range, with potential tests of the lower support boundary if bearish momentum persists.

Disclaimer: The analysis provided for BTC/EUR is for informational purposes only and does not constitute investment advice. Traders are encouraged to perform their own analysis and research before making any trading decisions. Market conditions can change quickly, so staying informed with the latest data is essential.

BTC/EUR D1 technical analysis chart
BTC/EUR D1 Technical Analysis for 08.15.2026
1BTC = –––EUR –––%
BTCEUR
Loading chart...