Current weekly forecast: This outlook covers 11–17 October 2026 and remains valid until 17 October 2026, unless its stated invalidation condition is triggered earlier.
In brief
BCH/USD has a neutral weekly bias as mixed D1 structure and momentum meet bearish H4 pressure between 267.28726 support and 296.49 resistance.
The D1 framework remains balanced: the 279.56 close is above primary support at 267.28726 but below primary resistance at 296.49, while the mixed close sequence and mixed momentum do not establish a clean directional trend. The D1 EMA50 slope is rising, but the falling SMA200 slope and price below the D1 EMA20 add conflicting structural signals.
H4 conditions lean weaker, with a bearish tactical state, RSI at 26.88, negative MACD histogram and a 270.92 close below H4 resistance at 277.47. That pressure can complicate any upside development, while stable volatility suggests movement may remain contained until a supplied weekly level is tested or a scheduled event introduces repricing risk.
BCH/USD D1 technical-analysis context for the weekly forecast. Chart data captured 11 October 2026.
Fundamental sentiment surrounding BCH/USD remains linked to broader cryptocurrency market flows and US dollar liquidity conditions. Upcoming US economic data releases and central bank commentary may influence overall investor risk appetite, impacting dollar-denominated digital assets.
Price Action:
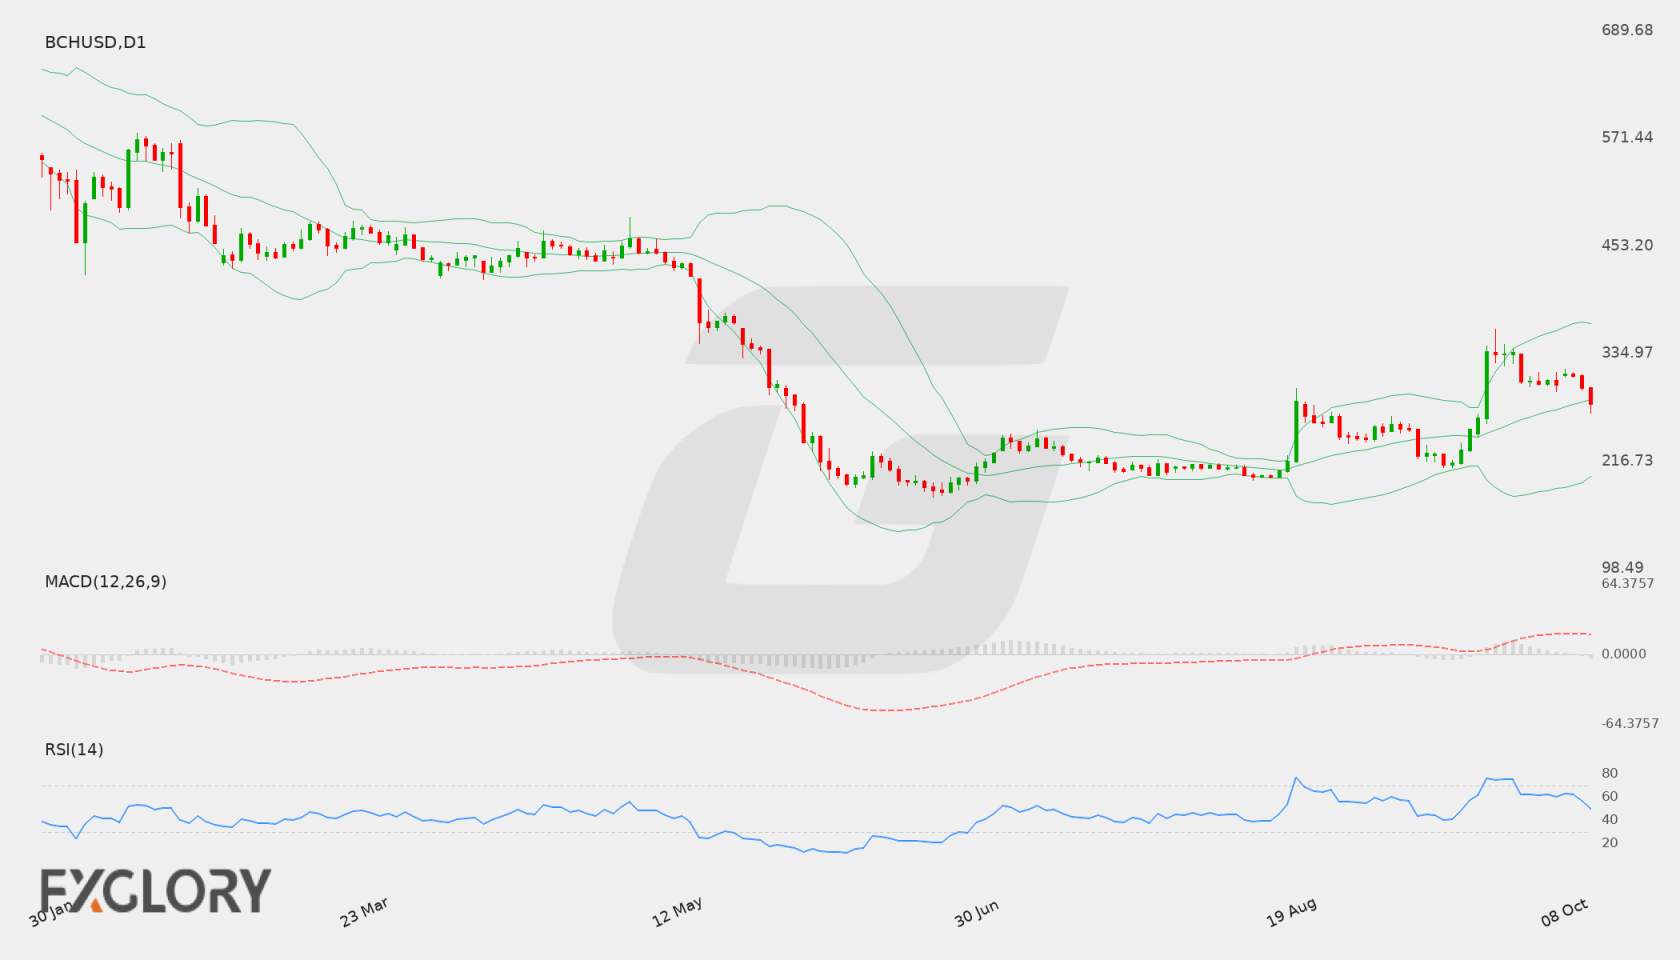
On the daily chart, BCH/USD recently surged from the 212.00 area to reach a peak of 361.71 before experiencing a pullback. The market is currently consolidating around the 305.00 zone, with the latest daily session closing at 305.55 as trading ranges compress following elevated volume.
Key Technical Indicators:
Bollinger Bands: The Bollinger Bands display a middle band at 270.49, an upper band at 357.18, and a lower band at 183.81. BCH/USD closed at 305.55, positioning price action in the upper half of the band structure after retreating from levels near the upper band envelope.
RSI: The 14-day RSI is currently registered at 61.97. This places the oscillator in moderately bullish territory while remaining below the overbought threshold of 70, signaling that upside interest persists without immediate technical exhaustion.
MACD: The MACD indicator is currently positioned at 21.29, standing firmly in positive territory above the baseline. This alignment indicates that prevailing bullish momentum remains active following the recent upward expansion, though the slope is stabilizing during consolidation.
Support and Resistance:
Key technical levels for BCH/USD show dynamic resistance at 361.71, representing the recent swing high. On the downside, primary support is identified at 195.60, with the middle Bollinger band near 270.49 serving as an intermediate reference point.
News to Watch for BCHUSD This Week:
ISM Services PMI: Shifts in services sector data could influence the US dollar and speculative asset appetite.
FOMC Meeting Minutes: Detailed monetary policy perspectives may drive dollar volatility and affect crypto market flows.
Unemployment Claims: Weekly labor market updates can alter expectations for Federal Reserve interest rate trends.
Prelim UoM Inflation Expectations: Changes in consumer inflation outlook can shift risk tolerance across financial markets.
Prelim UoM Consumer Sentiment: Gauges consumer confidence which may affect risk sentiment across asset classes.
Weekly Outlook and Consideration:
The weekly outlook for BCH/USD reflects a market in consolidation after an impulsive advance toward the 361.71 resistance level. With the last close at 305.55, the pair maintains a constructive profile above the middle Bollinger band of 270.49, supported by a positive MACD of 21.29 and an RSI reading of 61.97. A renewed push could bring the 361.71 resistance back into view, while continued consolidation may test lower intermediate levels toward 270.49, with structural support established at 195.60.
Disclaimer: The analysis provided for BCH/USD is for informational purposes only and does not constitute investment advice. Traders are encouraged to perform their own analysis and research before making any trading decisions. Market conditions can change quickly, so staying informed with the latest data is essential.
BCH/USD has experienced a significant shift in market sentiment, backed by elevated trading volumes during recent daily sessions. As a major cryptocurrency, BCHUSD remains sensitive to broad market risk sentiment, macro USD trends, and incoming economic data that shape broader liquidity expectations.
Price Action:
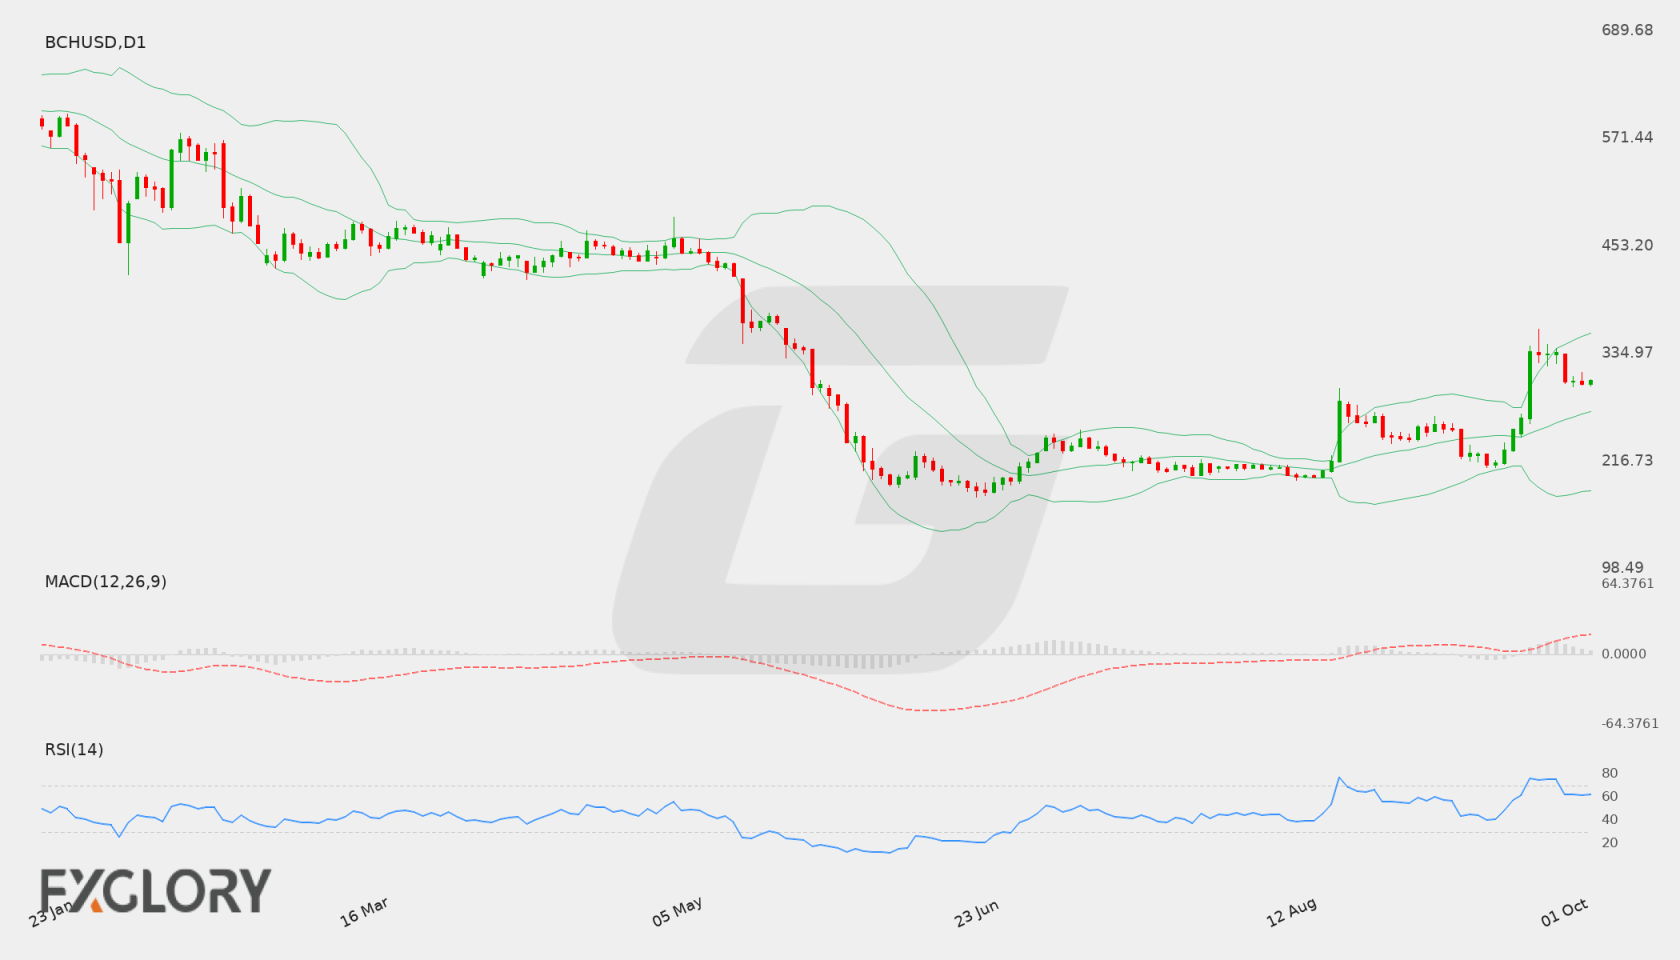
On the daily (D1) timeframe, BCH/USD has rallied sharply from recent lows near 212.98, climbing through key levels to push past 336.49 before settling near the latest close of 334.31. High volume during recent bullish candles reflects aggressive buyer participation, though price action shows slight deceleration below key high levels.
Key Technical Indicators:
Bollinger Bands: The D1 Bollinger Bands show significant expansion with the middle band at 254.18, upper band at 327.50, and lower band at 180.85. With the latest close at 334.31 trading above the upper band, the pair reflects strong upside volatility and potential overextended conditions.
RSI: The 14-period Daily RSI stands at 74.86, placing BCH/USD in overbought territory. While this underscores robust buying pressure, it also signals the potential for consolidation or temporary corrective retracements.
MACD: The D1 MACD main line sits firmly in positive territory at 20.20, confirming powerful bullish momentum in the recent price advance for BCHUSD.
Support and Resistance:
Key technical levels on the daily chart include major resistance at 361.71, representing the immediate hurdle for extended bullish moves, and fundamental support located down at 195.60.
News to Watch for BCHUSD This Week:
ISM Manufacturing PMI: Evaluates activity levels in the manufacturing sector, impacting overall market risk appetite and US dollar movements.
ISM Manufacturing Prices: Tracks price inflation within manufacturing, providing signals regarding monetary expectations that can filter into risk assets.
Weekly Outlook and Consideration:
BCH/USD enters the week with strong momentum, having surged to a close at 334.31. Technical indicators align with a strong rally, highlighted by a positive MACD of 20.20 and price trading above the 327.50 upper Bollinger Band. However, with the RSI at 74.86 indicating overbought conditions, traders should watch for potential pullbacks toward mid-band areas near 254.18 if resistance at 361.71 caps further immediate upside. A break above 361.71 could pave the way for continued bullish expansion, whereas a broader decline would bring focus back toward the support zone at 195.60.
Disclaimer: The analysis provided for BCH/USD is for informational purposes only and does not constitute investment advice. Traders are encouraged to perform their own analysis and research before making any trading decisions. Market conditions can change quickly, so staying informed with the latest data is essential.
The crypto asset BCH/USD (BCHUSD) remains sensitive to shifts in global market liquidity and broad sentiment driven by major macroeconomic data releases. Upcoming US economic indicators could impact risk appetite across broader financial markets, influencing trading conditions for digital assets like Bitcoin Cash.
Price Action:
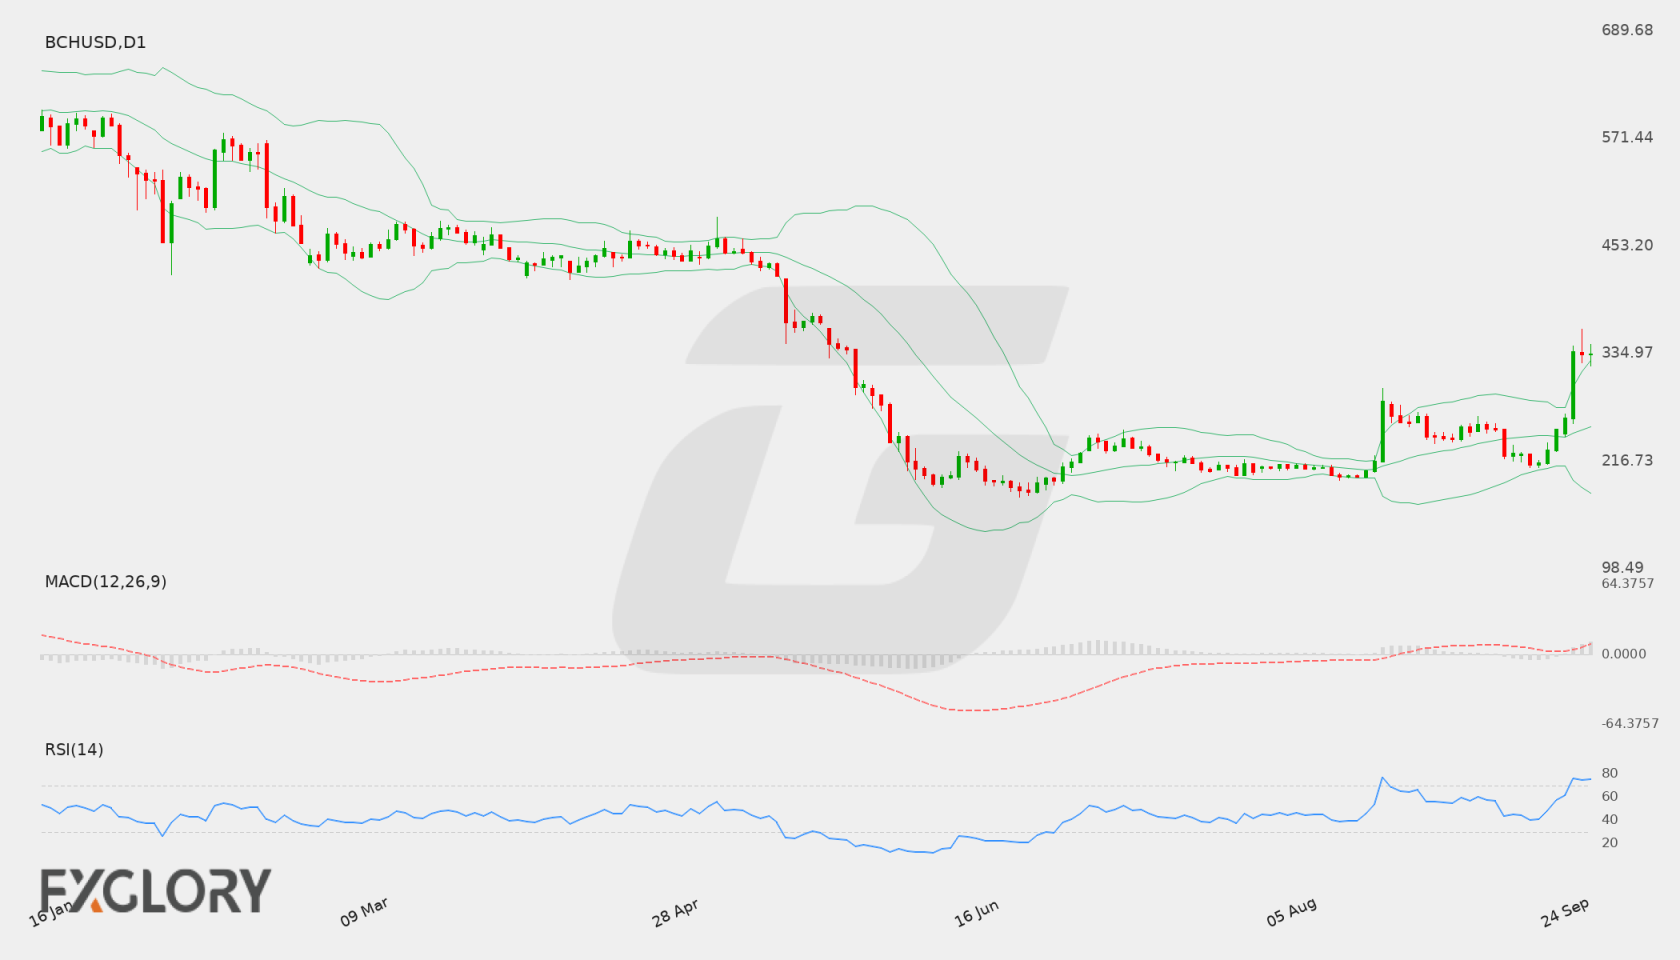
BCH/USD recently settled at a close of 228.92. Price action shows a recent pull back from the high of 296.49 followed by a slight bounce from lower daily levels near 212.98, maintaining a period of short-term consolidation.
Key Technical Indicators:
Bollinger Bands: The daily Bollinger Bands reflect a middle band at 244.83, an upper band at 281.16, and a lower band at 208.49. With the current close at 228.92 positioned between the middle and lower bands, price action suggests mild downside pressure within the channel.
RSI: The 14-period Relative Strength Index (RSI) stands at 48.37. Sitting near the mid-50 level, the RSI indicates a balanced market state without strong overbought or oversold extremes.
MACD: The daily MACD indicator registers at -1.35, remaining below the zero line. This negative value indicates lingering bearish momentum, though traders continue to watch for potential signal line convergence if support holds.
Support and Resistance:
Key chart levels identify immediate support at 180.79 and key resistance at 296.49. Intermediate technical reference points include the middle Bollinger Band around 244.83.
News to Watch for BCHUSD This Week:
CB Consumer Confidence: Measures consumer sentiment which can influence broader market appetite for risk assets.
ADP Non-Farm Employment Change: Provides an early reading on private employment growth influencing market sentiment.
Core PCE Price Index m/m: Serves as a key inflation metric sways broad liquidity conditions.
Final GDP q/q: Reports comprehensive economic growth and shapes overall risk sentiment.
ISM Manufacturing PMI: Gauges manufacturing activity to reflect wider macroeconomic health.
Average Hourly Earnings m/m: Measures wage growth dynamics that feed into inflation perspectives.
Non-Farm Employment Change: Serves as a primary labor health indicator driving market volatility.
Unemployment Rate: Provides crucial context on overall employment market conditions.
Weekly Outlook and Consideration:
The weekly outlook for BCH/USD (BCHUSD) shows a neutral to slightly soft technical structure with the RSI at 48.37 and MACD at -1.35. While the price at 228.92 rests below the middle Bollinger band of 244.83, the technical levels between primary support at 180.79 and primary resistance at 296.49 mark the current trading range. Dynamic movements will depend on whether key US economic releases boost risk sentiment or trigger further consolidation.
Disclaimer: The analysis provided for BCH/USD is for informational purposes only and does not constitute investment advice. Traders are encouraged to perform their own analysis and research before making any trading decisions. Market conditions can change quickly, so staying informed with the latest data is essential.
Market sentiment for BCH/USD (BCHUSD) remains tied to overall digital asset risk appetite and broader macroeconomic developments. Decisions and economic signals from global financial authorities, alongside changes in liquidity conditions, continue to influence price swings across the cryptocurrency space.
Price Action:
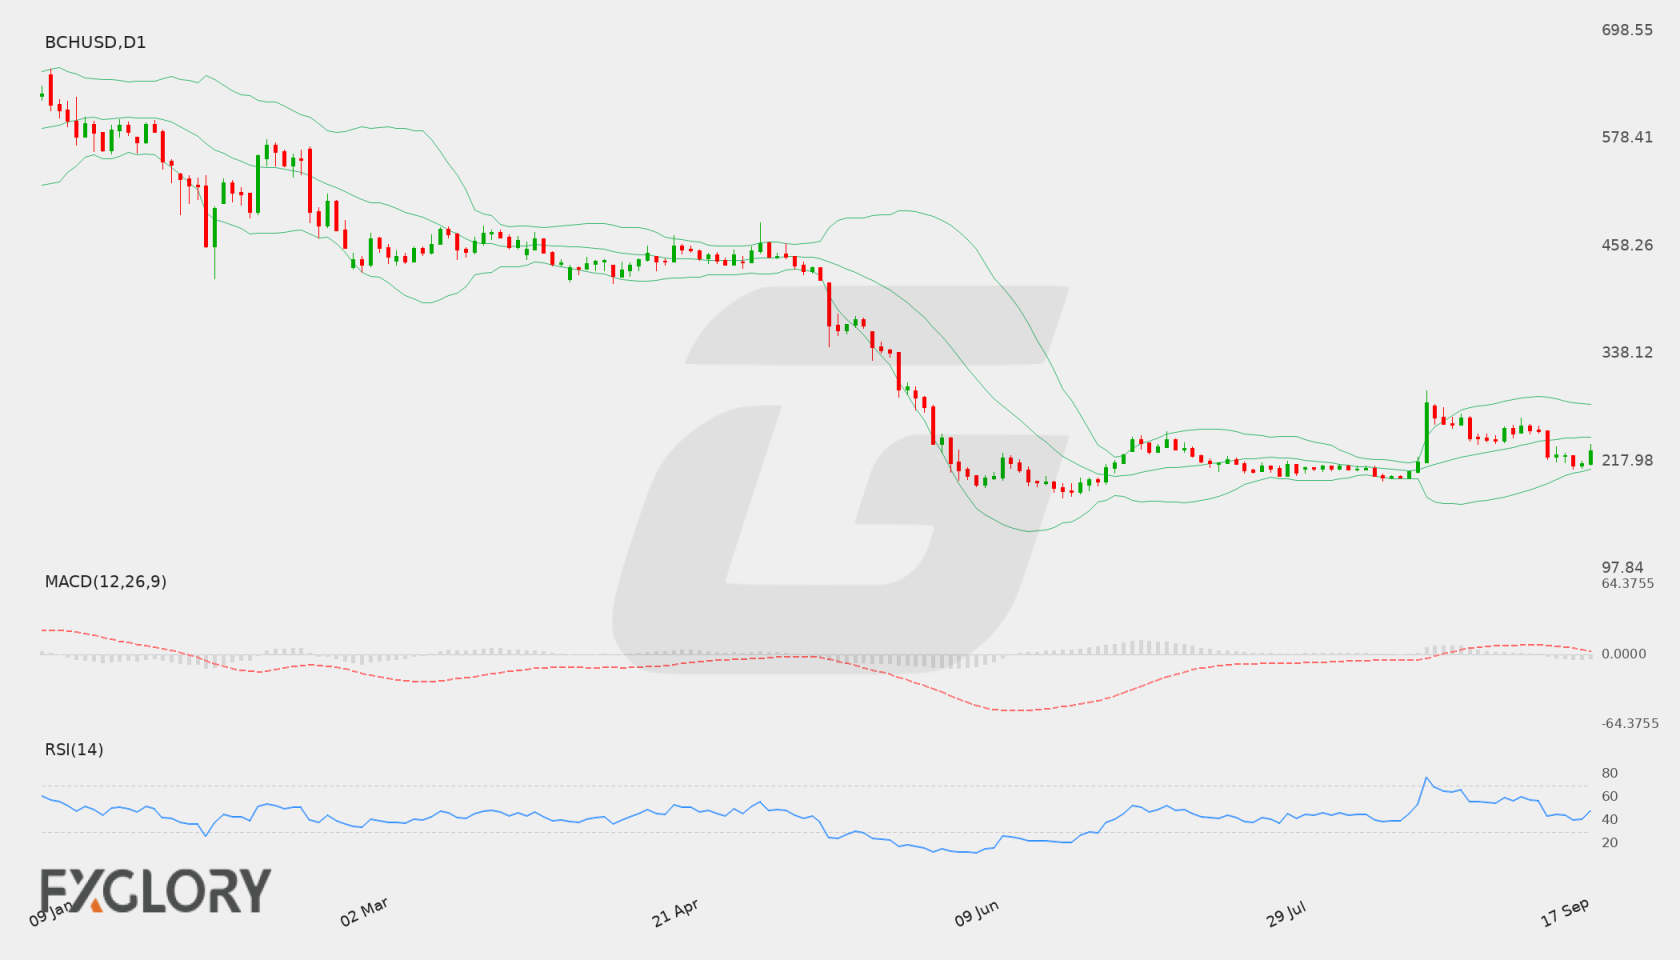
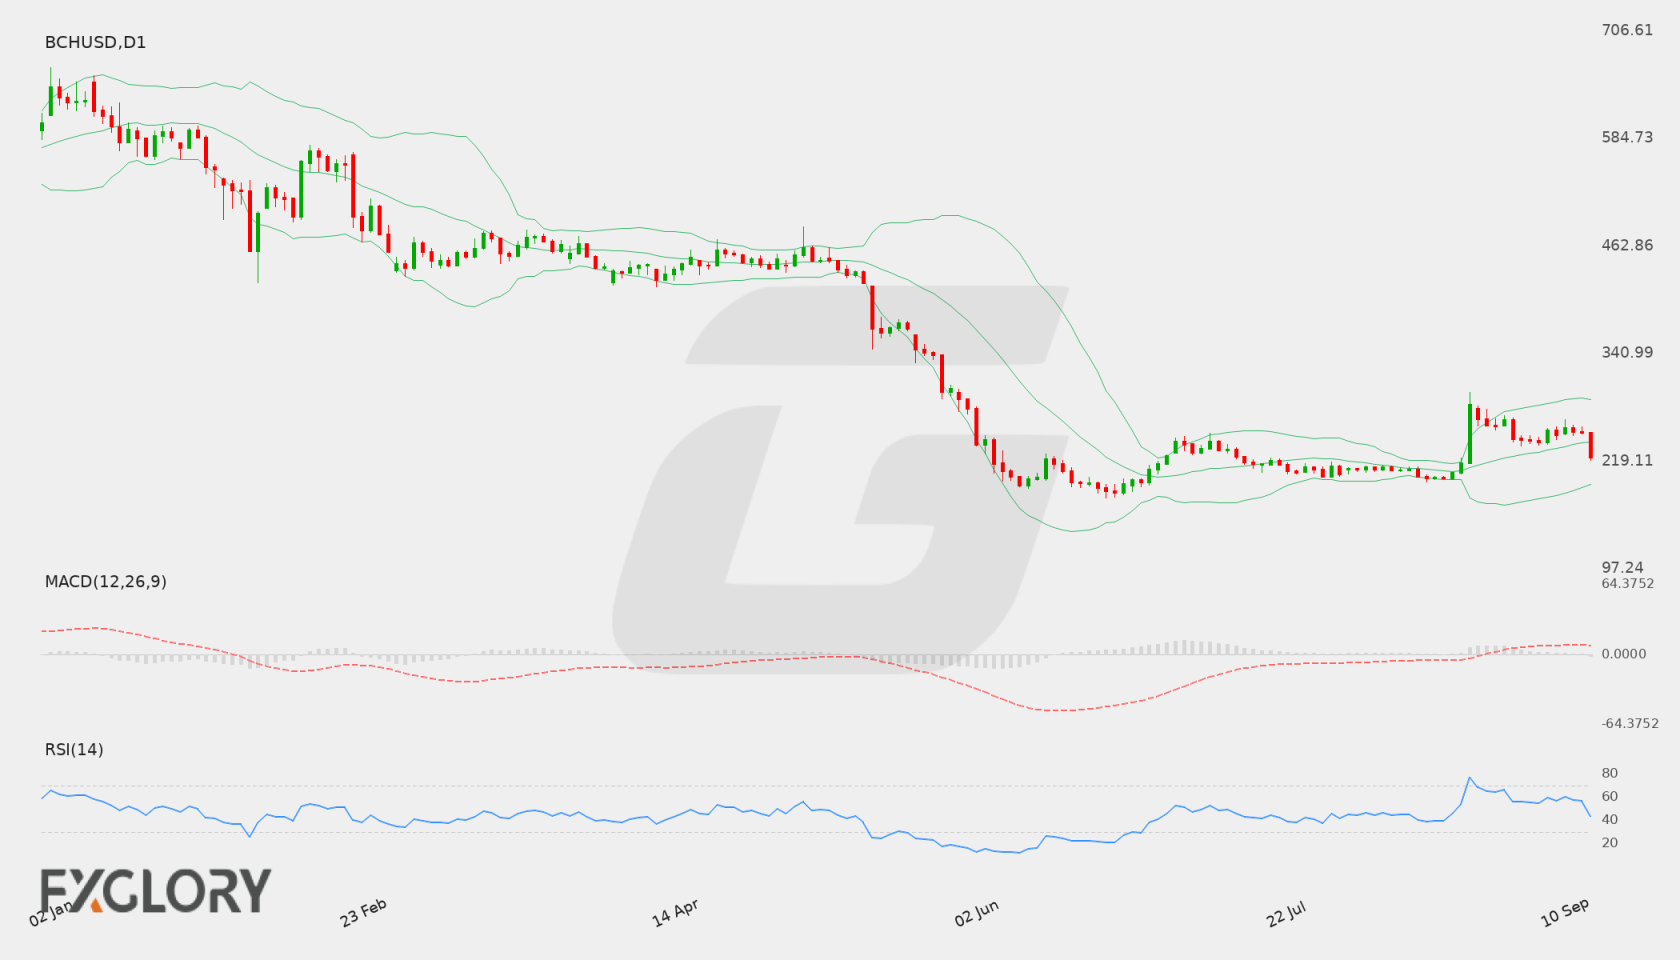
The daily chart for BCH/USD shows recent price activity pulling back toward 222.96 after reaching a high of 296.49. Price movement has seen notable fluctuations between the support zone of 176.80 and resistance near 296.49, reflecting a period of heightened volatility and localized selling pressure.
Key Technical Indicators:
Bollinger Bands: The Bollinger Bands on the D1 timeframe indicate a middle band at 240.65, with an upper band of 288.87 and a lower band of 192.42. The recent close of 222.96 places BCHUSD below the middle band, suggesting price is trading in the lower half of the band range.
RSI: The 14-period Relative Strength Index (RSI) is positioned at 43.78. This reading sits below the neutral 50 level, indicating a mild bearish bias without entering oversold territory.
MACD: The MACD indicator stands at 6.21, reflecting positive baseline momentum from prior upward moves, though recent downward price action suggests momentum could be consolidating.
Support and Resistance:
Key technical levels for BCH/USD include primary support at 176.80 and immediate resistance at 296.49. Additionally, the Bollinger Bands highlight key reference areas around the lower band near 192.42 and the middle band near 240.65.
News to Watch for BCHUSD This Week:
Core Retail Sales m/m: Changes in core retail sales may shift broad market sentiment and influence dollar-denominated assets.
Retail Sales m/m: Shifts in consumer spending data can affect broad risk appetite and market liquidity.
FOMC Economic Projections: Central bank economic outlooks provide guidance on monetary policy trajectories that can impact financial markets.
FOMC Statement: Official policy statements offer insights into monetary policy stance, driving market sentiment across asset classes.
Federal Funds Rate: Interest rate decisions heavily influence broader financial conditions and liquidity for risk assets.
FOMC Press Conference: Official commentary during the press conference can spark volatility across global markets.
Unemployment Claims: Labor market figures reflect economic health and can influence overall market risk posture.
Weekly Outlook and Consideration:
Looking ahead, BCH/USD (BCHUSD) displays a cautious technical posture as price trades around 222.96. Holding above the key support at 176.80 could allow for potential stabilization or retests toward the middle Bollinger Band near 240.65. Conversely, further selling pressure below current levels could bring the lower Bollinger Band around 192.42 into focus. Traders should monitor upcoming macroeconomic events closely, as changes in broader risk sentiment may impact market direction.
Disclaimer: The analysis provided for BCH/USD is for informational purposes only and does not constitute investment advice. Traders are encouraged to perform their own analysis and research before making any trading decisions. Market conditions can change quickly, so staying informed with the latest data is essential.