
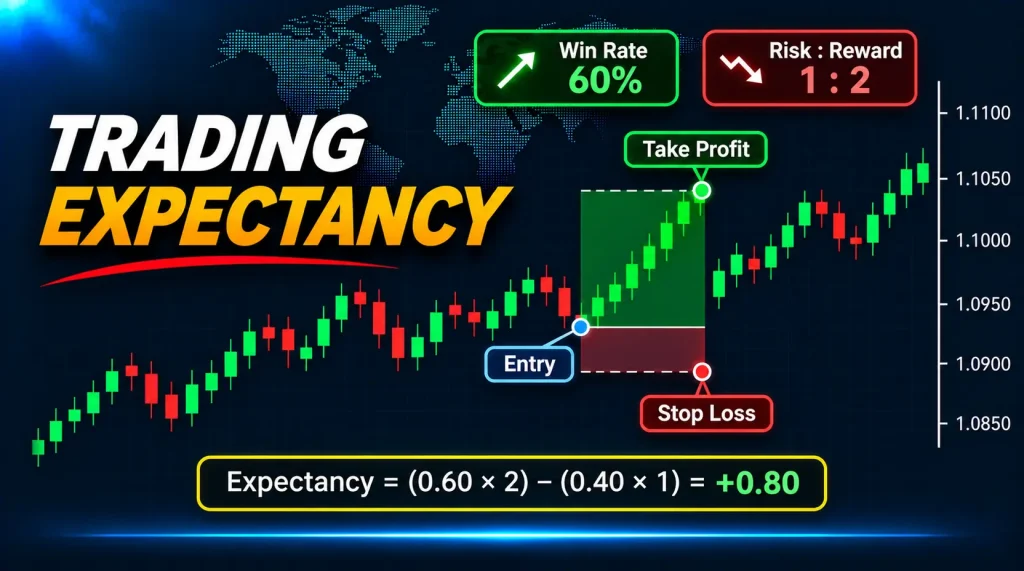
Expectancy in trading is the average gain or loss per completed trade in a defined sample. It combines how frequently trades win with the usual size of winning and losing outcomes. A strategy can win most of the time yet lose money overall if the losing trades are sufficiently large.
For forex traders, the most useful starting point is the net result after relevant trading costs, not a headline win rate. An expectancy of +$16 per trade, for example, means that a particular group of closed trades averaged $16 each. It does not promise $16 on the next trade, prove that the strategy has a persistent edge, or predict how much an account will grow.
This guide explains the expectancy formula, provides hypothetical EUR/USD trade-journal calculations, compares strategies with different win rates and explains why the estimate can change after costs, position sizing and market conditions. The examples are educational arithmetic, not observed FXGlory account performance or recommendations to trade a specified size.
What Is Expectancy in Trading?
Trading expectancy summarises the average outcome of a trading process over a set of completed trades. You may measure it in account currency, such as US dollars, or in units of initial planned risk, often called R-multiples. Both can be informative, but they answer slightly different questions.
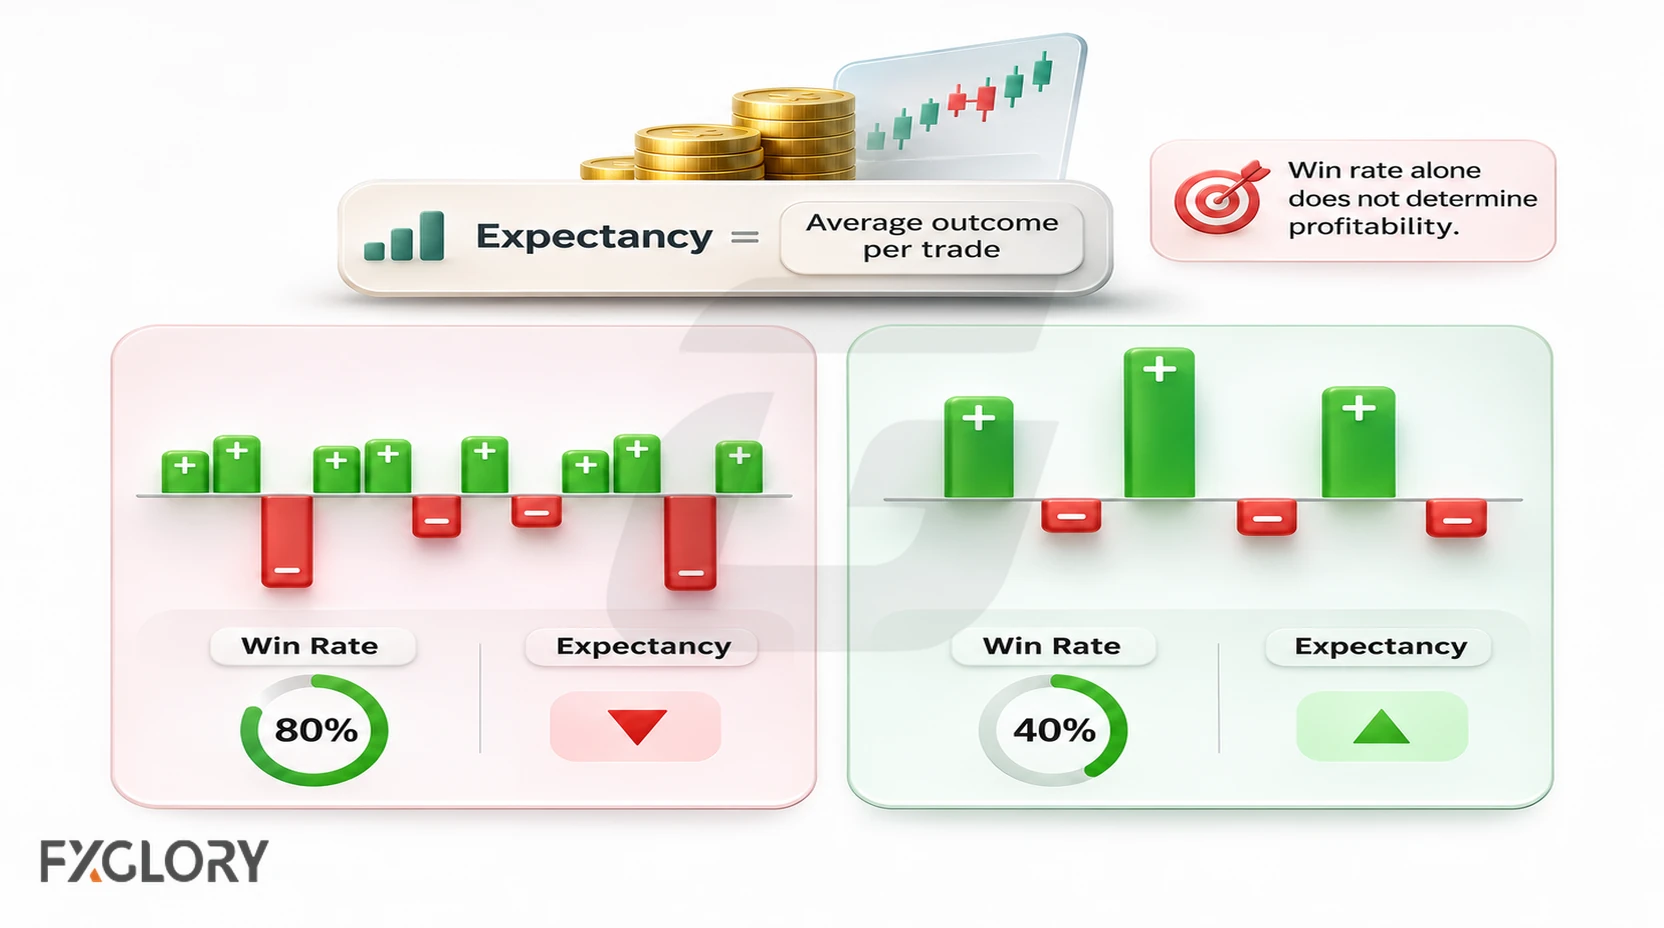
Imagine two traders who each close ten forex positions. One records eight small winners and two very large losers. The other wins less often but receives substantially more on winners than was lost on losers. Win rate counts positive outcomes; expectancy accounts for their sizes too. This is why the same win rate can produce different financial results.
Expectancy calculated from a journal is a historical sample average. Applying that estimate to future trades requires assumptions about comparable setups, execution, costs and market conditions. There is no fixed period or magic number of trades that makes an estimated expectancy reliable by itself.
Trading Expectancy Formula
For a journal in which every completed trade is classified as a win, loss or exactly zero net result, a convenient version is:
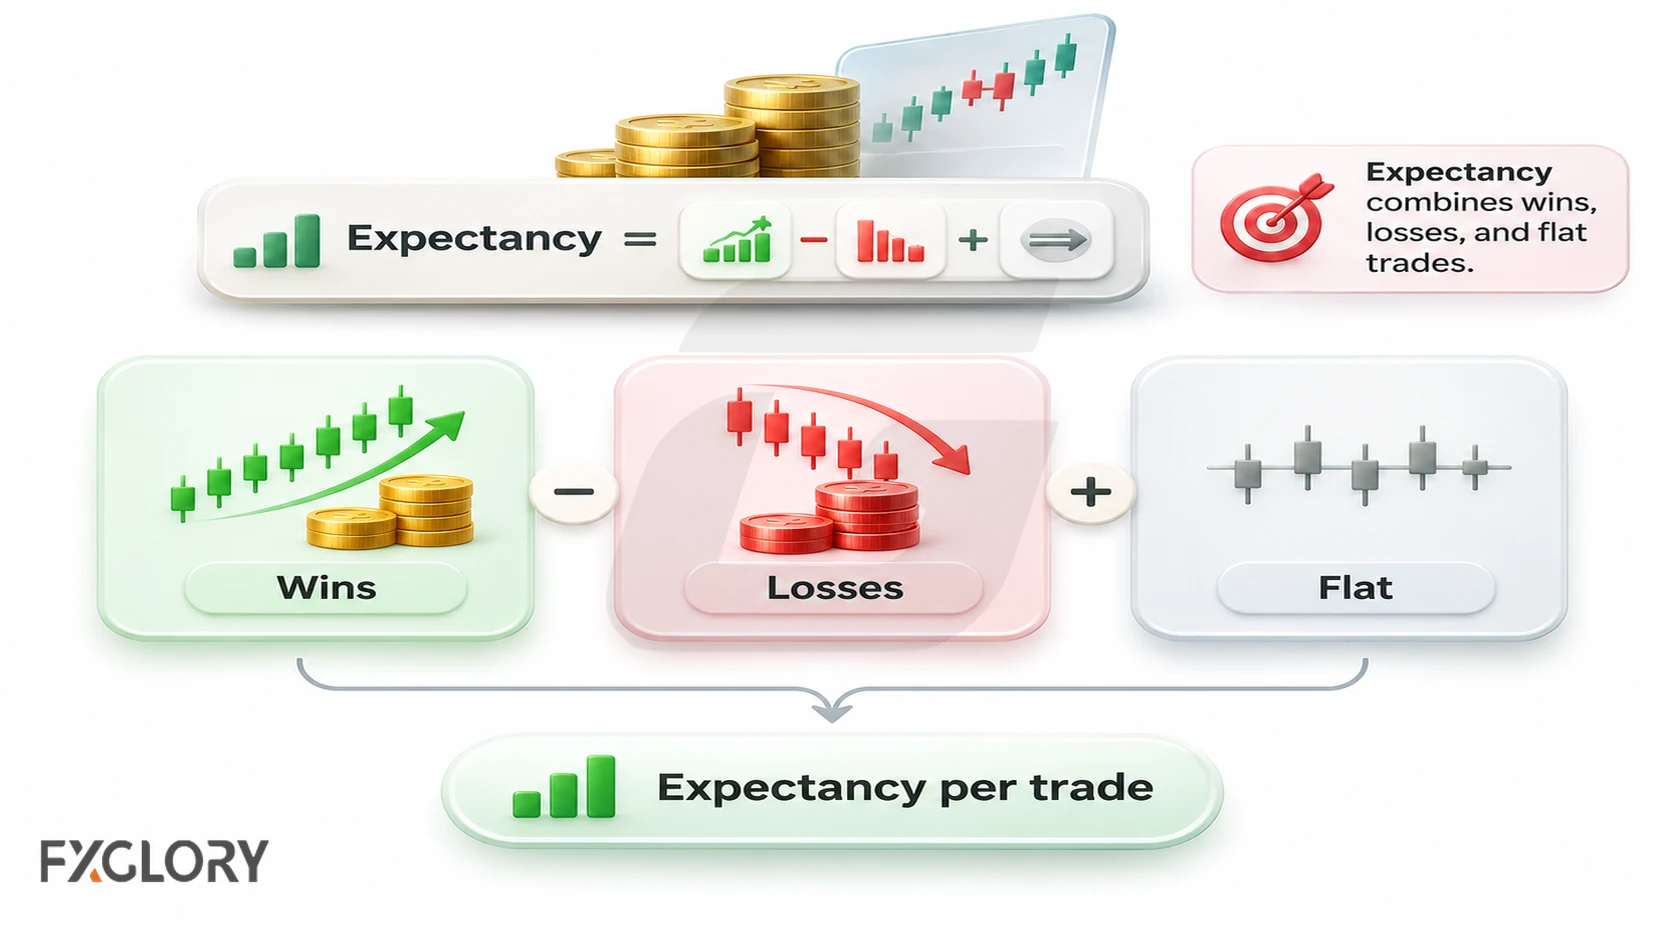
Expectancy per trade = (Win share × Average net win) − (Loss share × Average absolute net loss) + (Flat share × $0).
Win share is the number of trades with positive net P&L divided by all completed trades. Loss share uses negative-net-P&L trades divided by that same total. Average net win is positive; average absolute net loss is entered as a positive magnitude. A net-flat trade contributes zero but still counts in the denominator.
When every trade is either a winner or a loser, with no flat trades, the familiar shortcut is E = (Win rate × Average win) − ((1 − Win rate) × Average loss). Do not use 1 − win rate as the loss rate if your dataset also includes flat outcomes. All percentages in the calculation must be expressed as decimals: 40% becomes 0.40.
An even simpler cross-check is total net P&L ÷ number of completed trades. For a journal with correctly grouped trades and the same cost treatment, the grouped formula and this direct average must agree. If they do not, check which trades, charges or partial exits were counted.
Worked Forex Example: 100 EUR/USD Trades
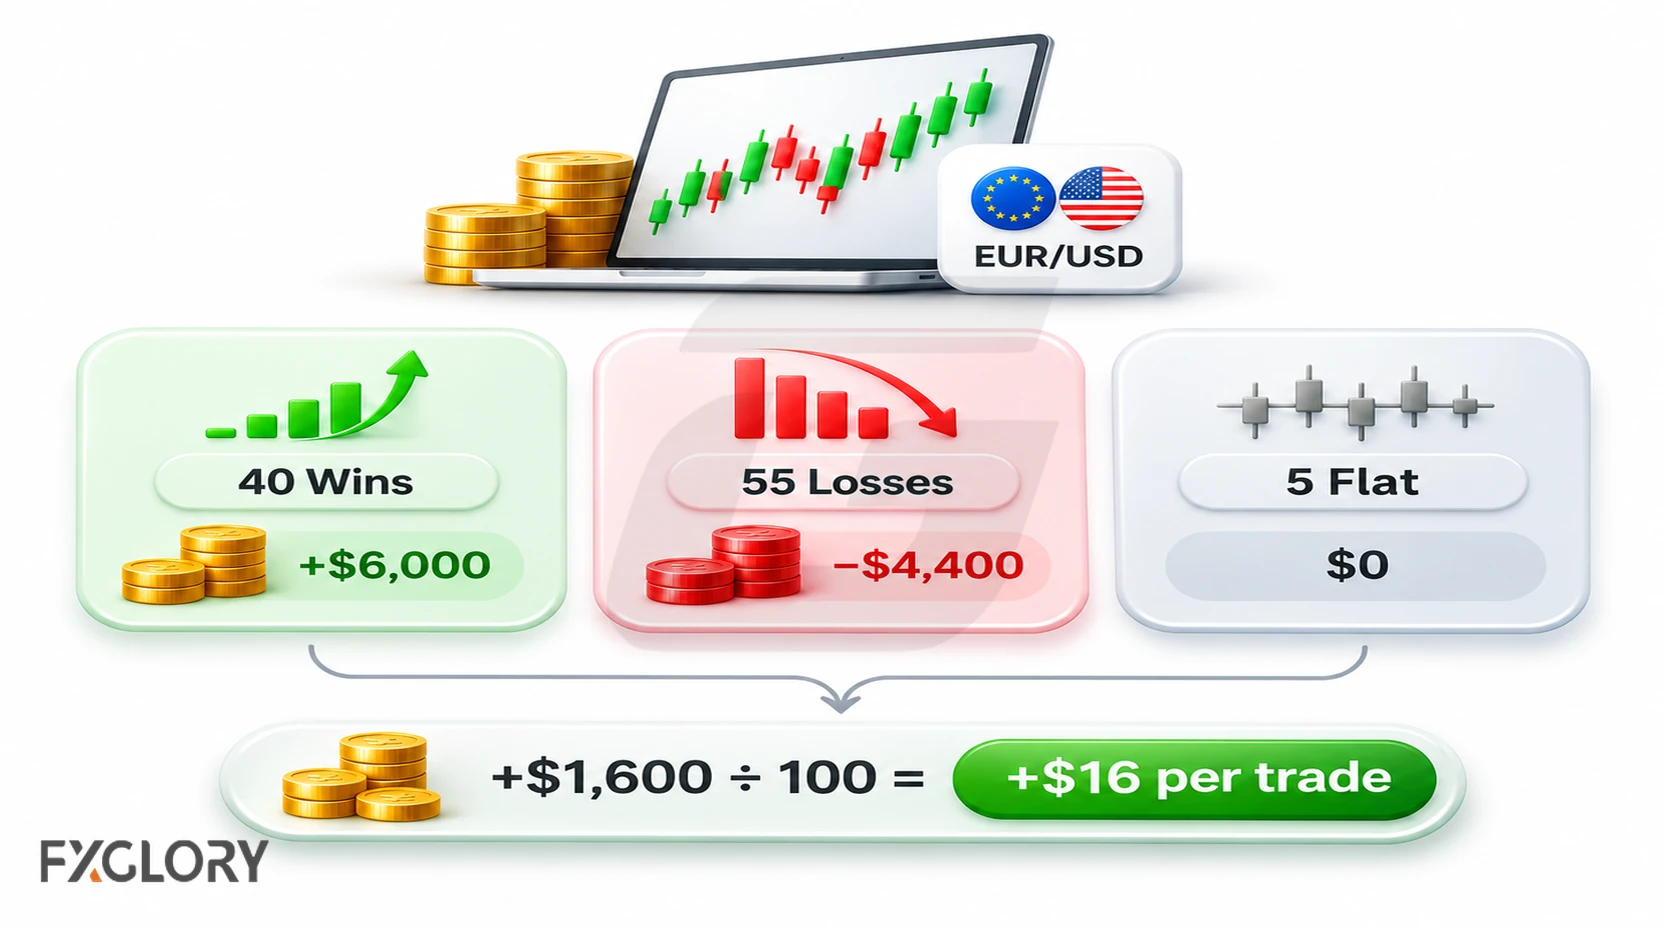
Consider a hypothetical journal of 100 fully closed EUR/USD trades. Assume each trade uses 100,000 EUR of notional position size (one standard lot under the illustrative contract convention), and the account is denominated in USD. For this EUR/USD size, a one-pip change is $10. The net outcomes below already reflect the trading costs and actual fills assigned in the example; they must not be charged again.
| Outcome | Trades | Average net result | Subtotal |
|---|---|---|---|
| Winning trades | 40 (40%) | +$150 (+15 net pips) | +$6,000 |
| Losing trades | 55 (55%) | −$80 (−8 net pips) | −$4,400 |
| Flat trades | 5 (5%) | $0 | $0 |
| Total | 100 | — | +$1,600 |
- Convert the outcome shares to decimals: 40 ÷ 100 = 0.40 winners; 55 ÷ 100 = 0.55 losers; 5 ÷ 100 = 0.05 flat.
- Calculate weighted winning and losing contributions: 0.40 × $150 = $60; 0.55 × $80 = $44.
- Subtract the loss contribution: $60 − $44 = +$16 in sample expectancy per completed trade.
- Cross-check using the journal totals: ($6,000 − $4,400) ÷ 100 = +$16.
The result is positive for this illustrative sample. It says nothing by itself about account suitability: one-standard-lot exposure may be too large for a given account, and real pip values and contract specifications depend on the instrument and account currency. The example does not prescribe lot size, trade frequency, stop distance or achievable results.
The five zero-result trades are important. If they were dropped, the same $1,600 would be divided by 95, giving about $16.84 per nonflat trade. That might be a legitimate different metric, but it is not the average per all 100 completed trades and must be labelled accordingly.
Why a High Win Rate Can Still Lose Money
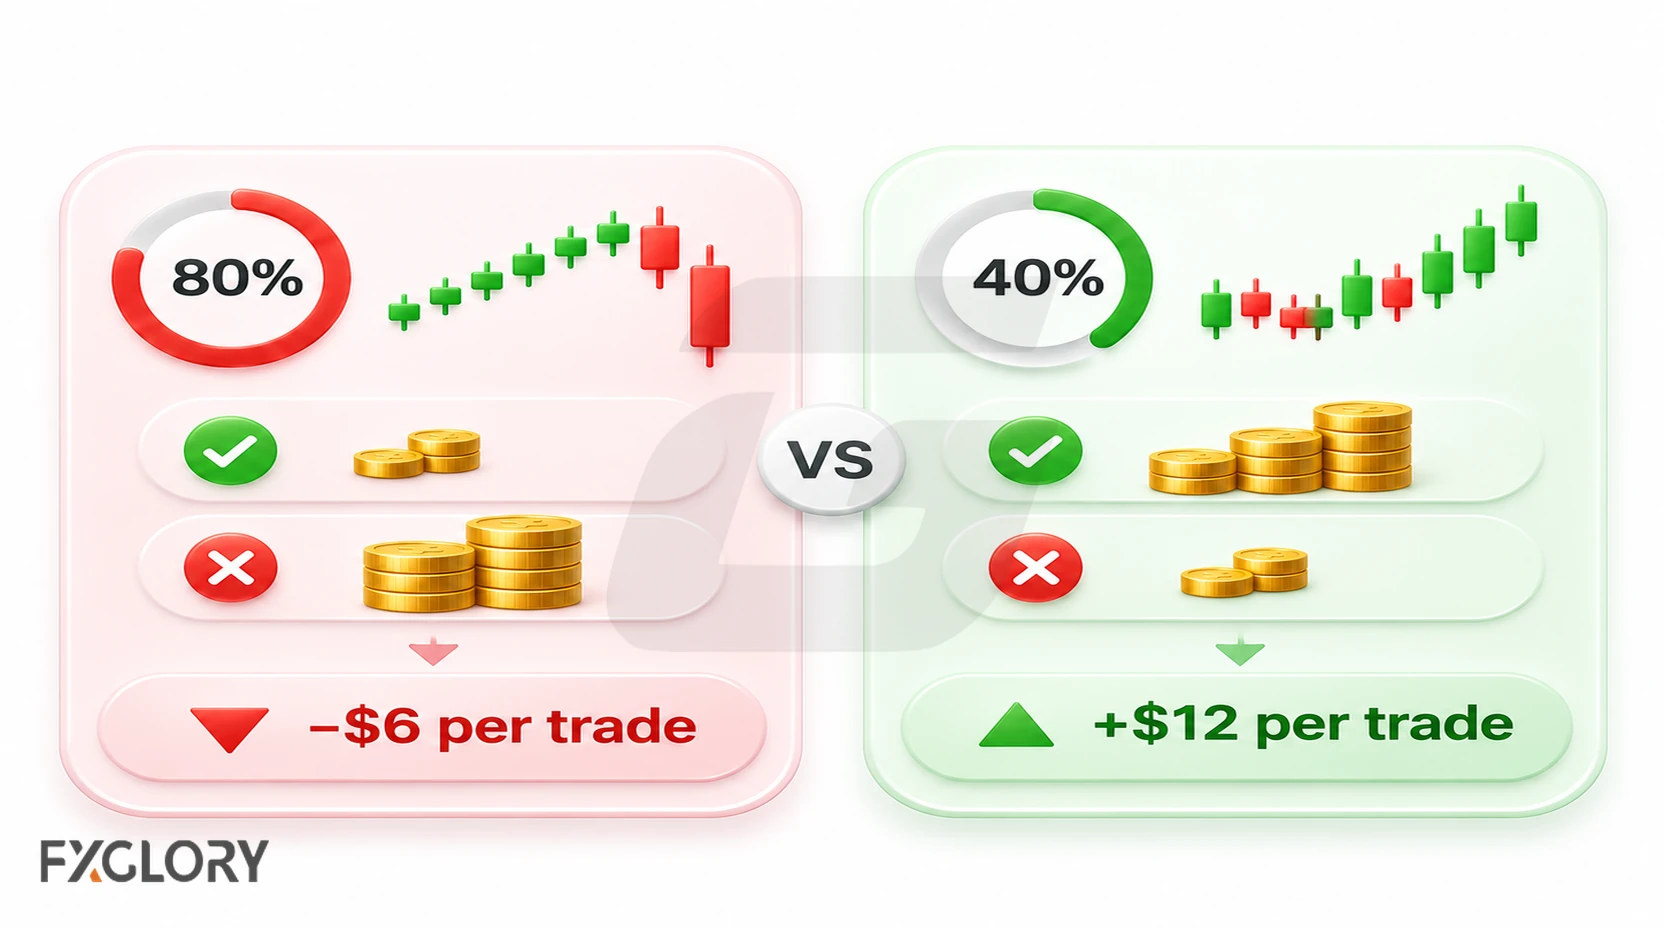
A percentage of profitable trades tells you how often a result was positive, not how much was gained or lost. The size and frequency of losses can overwhelm many small wins. Consider two further hypothetical, no-flat, 100-trade samples with net monetary outcomes:
| Strategy sample | Wins / losses | Average win / loss | Total net | Expectancy |
|---|---|---|---|---|
| High win rate | 80 / 20 | +$30 / −$150 | −$600 | −$6 per trade |
| Lower win rate | 40 / 60 | +$150 / −$80 | +$1,200 | +$12 per trade |
The first sample wins 80% of the time, yet 80 × $30 − 20 × $150 = −$600. The second wins only 40% of the time, yet 40 × $150 − 60 × $80 = +$1,200. Neither sample proves what will happen next. They demonstrate why win rate and payoff size must be examined together.
Compare the size of average loss with average win, then review the full trade distribution. A few unusually large losses can erase months of small winners. Conversely, a positive average driven by one exceptional winning position may disappear when that outlier is removed. Checking your worst trades and the size of account drawdowns is therefore a separate and necessary part of a risk review.
Expectancy in R-Multiples When Trade Risk Changes
Dollar expectancy is affected by position size. To compare the quality of outcomes relative to the loss planned for each setup, some traders calculate each trade's R-multiple: net closed-trade P&L ÷ initial planned cash risk for that trade. For instance, a $150 result from a trade with $100 initial planned risk is +1.5R. A $100 loss against $200 of initial planned risk is −0.5R.
| Trade | Initial planned risk | Net result | R-multiple |
|---|---|---|---|
| A | $100 | +$150 | +1.50R |
| B | $200 | −$100 | −0.50R |
| C | $50 | +$25 | +0.50R |
| D | $100 | −$100 | −1.00R |
Average R is (1.50 − 0.50 + 0.50 − 1.00) ÷ 4 = +0.125R per trade. The actual net cash sum, however, is $150 − $100 + $25 − $100 = −$25, or −$6.25 per trade. This is not contradictory: the trades used different dollar risk amounts, so R-based and cash-based averages weight outcomes differently.
Record initial planned risk rather than changing the denominator after the trade. If a stop is moved, slippage occurs or a position is partially closed, the actual net result may differ from the intended risk. Avoid treating +0.125R as a universal 12.5% account return. To study the effect of position sizing, inspect dollar outcomes, R-multiples, cash risk and account equity together.
What Is a Good Trading Expectancy?
Positive expectancy means the observed or modelled average net outcome is above zero. Negative expectancy means it is below zero. An estimate of exactly zero means the sample averaged break-even after the included costs. There is no universal dollar figure, R value or “good expectancy ratio” appropriate for every forex system.
Whether an estimate is meaningful depends on the number and independence of observations, the range of market conditions, execution costs, leverage exposure, the consistency of trading rules, how frequently opportunities occur and how extreme the losing tail can become. A positive average over a handful of trades might be an accident. Even a longer backtest can mislead if parameters were repeatedly optimized on the same data.
Interpretation note: Historical positive expectancy is an observation or a conditional model estimate, not evidence that future trades must have a positive expected value. No fixed sample size guarantees a stable result. Re-evaluate when position sizing, execution, symbols, strategy rules or volatility conditions change.
It may help to compare the result across separate time windows and strategy setups, calculate the average without the largest winning trade, and review the losing streaks. Also ask whether the trading process was reproducible: discretionary exceptions, selective logging and omitted losses can inflate the estimate.
Breakeven Win Rate and Payoff Ratio
For a simplified system with only winners and losers, consistent average payoffs and no flat trades, the breakeven win rate is:
Breakeven win rate = Average absolute loss ÷ (Average win + Average absolute loss).
Using net average wins of $150 and net average losses of $80 gives $80 ÷ ($150 + $80) = 80 ÷ 230 ≈ 34.78%. At that percentage the simplified net expectancy would be zero. A 40% win share would give (0.40 × $150) − (0.60 × $80) = +$12 per trade in this two-outcome model.
The payoff ratio is average win ÷ average absolute loss: $150 ÷ $80 = 1.875. It shows average reward relative to average loss, but it does not incorporate win frequency on its own. If those average outcomes are gross rather than net, execution costs must still be included and the breakeven threshold will rise. With actual breakeven trades, use all outcome shares in the full expectancy calculation instead.
How Spread, Slippage and Commissions Change the Result
Forex execution and holding costs can change average wins and losses. These may include the bid–ask spread, commissions, price slippage and overnight financing, depending on the trading instrument and holding period. The right treatment depends on the source of your trade record.
If your journal records actual entry and exit fills and a complete net P&L including fees, those effects are already reflected. Do not subtract the spread a second time from each closed-trade result. If you instead model mid-price movements or gross outcomes before charges, estimate the missing costs separately and label those assumptions.
For example, take the separate gross two-outcome model above that produces +$12 per trade before a new, additional per-trade charge. If each completed trade incurs a hypothetical incremental cost not yet reflected in the model, the following sensitivity calculation applies:
| Previously uncounted cost per trade | Modelled net expectancy |
|---|---|
| $0 | +$12 |
| $5 | +$7 |
| $12 | $0 |
| $15 | −$3 |
These amounts are hypothetical, not FXGlory pricing. Costs are not always constant per trade, and unexpected fills may vary with liquidity and market volatility. For more background on actual versus requested execution prices, see What Is Slippage in Forex?. Sensitivity testing can help reveal whether a small positive result disappears under modest changes in assumptions.
Expectancy vs Profit Factor, Expected Payoff and Risk of Ruin
Related trading metrics are not interchangeable. Expectancy is an average outcome per trade in stated units. Profit factor is the sum of positive trade results divided by the absolute sum of negative trade results for the selected dataset; it is unitless. The 100-trade illustrative journal above has profit factor $6,000 ÷ $4,400 ≈ 1.36 and expectancy +$16 per trade. These measures describe different aspects of the same hypothetical history.
Expected Payoff in the MT5 Strategy Tester also describes a historical average result, but platform reports may count trades, deals and costs differently from a manually grouped journal. Check the report conventions before comparing the displayed number with your own calculation. FXGlory's guide to reading an MT5 backtest report explains those fields and their limitations.
Risk of ruin estimates a chance of reaching a defined loss boundary under specified modelling assumptions; it is not the same as the mean result per trade. A strategy can show positive sample expectancy yet experience severe drawdowns or an unacceptable chance of breaching a loss threshold. Review Risk of Ruin in Forex Trading for that separate question.
Finally, the phrase “expectancy ratio” is not used consistently across trading publications. Some authors mean average expectancy divided by risk, others mean a payoff-related ratio. When comparing claims, ask for the exact equation and units instead of treating a quoted ratio as a standard benchmark.
How to Calculate Expectancy From Your Trade Journal
Choose a coherent set of completed positions, such as one well-defined EUR/USD setup over a documented period. For each position, record the information necessary to reproduce the calculation and assess what the average leaves out.
- Define the observation: decide whether one record represents a complete position, a partial closing deal or another unit. Apply the same rule to every row.
- Capture context: record symbol, entry and exit times, setup, direction, position size, initial planned risk and market conditions.
- Use the same profit basis: document actual entry/exit fills, spread treatment, commissions, financing and net P&L in a common account currency.
- Count all results: include losing positions, breakeven outcomes and rejected or omitted trades only where the measurement definition calls for them; do not silently exclude an inconvenient closed trade.
- Calculate the direct average: total net P&L divided by all included completed trades. Independently reconcile the weighted-win/loss formula.
- Compare risk-adjusted outcomes: if risk varies, compute each trade's net R-multiple using its own initial planned risk; keep the cash average separate.
- Stress-test the result: compare different periods, adverse cost assumptions, large outliers, losing streaks, and out-of-sample or forward observations.
A spreadsheet or a trade journal can perform this arithmetic, but simply naming an “expectancy calculator” does not demonstrate that a trading system is profitable. Inspect the inputs and verify that missing costs, zero outcomes and trade grouping are handled correctly. For a broader review of realistic profitability claims, see Can You Really Make Money Trading Forex?.
Common Mistakes and Limits of the Metric
- Equating win rate with profitability: many small wins can be outweighed by fewer, larger losses.
- Mixing gross and net figures: missing fees overstate results; subtracting an embedded spread twice understates them.
- Discarding zero-result trades: removing breakevens changes the denominator and can change the interpretation.
- Comparing incompatible risk units: average R, payoff ratio, dollar expectancy and account percentage return do not mean the same thing.
- Relying on one small or selected sample: unusual trades and strategy optimization can distort the historical mean.
- Ignoring path risk: a positive average does not limit maximum drawdown, margin pressure, gaps or clustered losses.
- Assuming the future repeats the sample: strategies, costs and market regimes can change, sometimes abruptly.
Forex risk reminder: Trading forex and CFDs involves substantial risk, especially with leverage. A positive result in a historical or hypothetical expectancy calculation does not guarantee a profitable outcome, control the worst possible trade loss or establish account suitability. Actual stop-order execution can differ from the planned exit.
The Key Lesson
Trading expectancy is about the average net outcome, not just how often a trade wins. Calculate it from a complete, consistently measured set of closed trades; state whether it is in dollars or R; include transaction costs exactly once; and compare the result with drawdowns, position sizing, sample reliability and changes in execution conditions. Use the figure to ask better questions about a trading process—not as a promise about the next trade.