
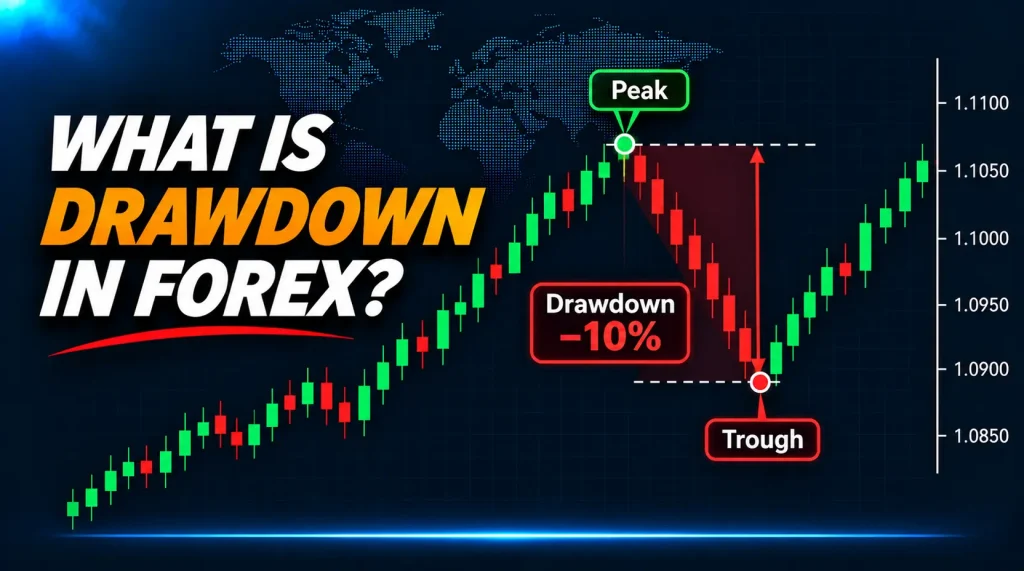
Drawdown in forex trading is the decline in a trading account's value from an earlier high (the peak) to a later lower value (the trough). Traders usually express it as a percentage of that earlier peak. It helps answer a different question from “How much did I lose on my latest trade?”: How far did my account fall from a previous high?
For example, if a hypothetical USD-denominated forex account peaks at $10,000 and then falls to $8,000, its peak-to-trough drawdown is 20%. A later recovery does not erase that historical 20% decline. The measurement must identify whether it uses account balance (generally reflecting closed trades) or account equity (which also reflects open-position profit and loss), and the time period being reviewed.
This lesson explains the formula, the distinction between current and maximum drawdown, and why the percentage gain needed to recover grows faster than the preceding percentage loss. Every account value below is hypothetical educational arithmetic, not a reported FXGlory account, live price series, recommended loss limit or performance forecast.
What Does Drawdown Mean in Forex Trading?
A drawdown starts after an account reaches a reference peak and declines below it. The lowest subsequent value in that episode is its trough. A recovery to the earlier peak ends that episode, but the recorded drop remains relevant when reviewing historical risk. Another drawdown can begin after a new high.
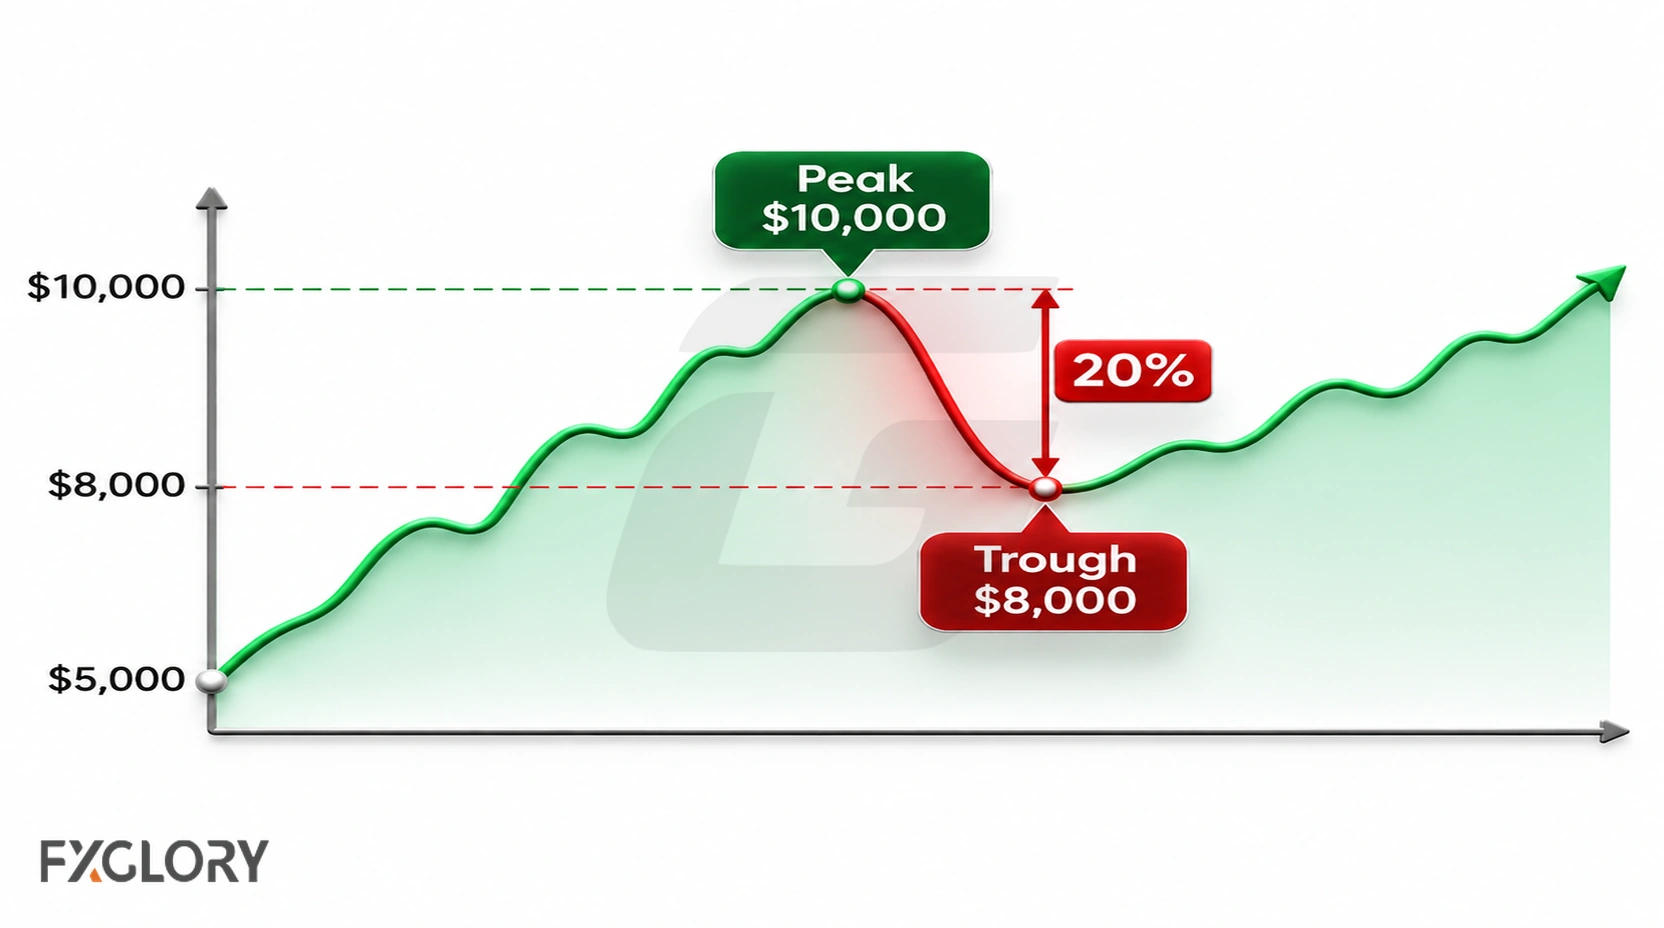
Imagine a trading account that started at $7,500, later rose to $10,000, and then fell to $8,000. The drawdown from the recent $10,000 peak is 20%, even though the account remains above its original $7,500 starting value. Using the starting deposit as the denominator would answer a different question and misstate the peak-based drawdown.
How to Calculate Drawdown in Forex
For a chosen series and a peak followed by a lower value, the basic peak-to-trough percentage formula is:
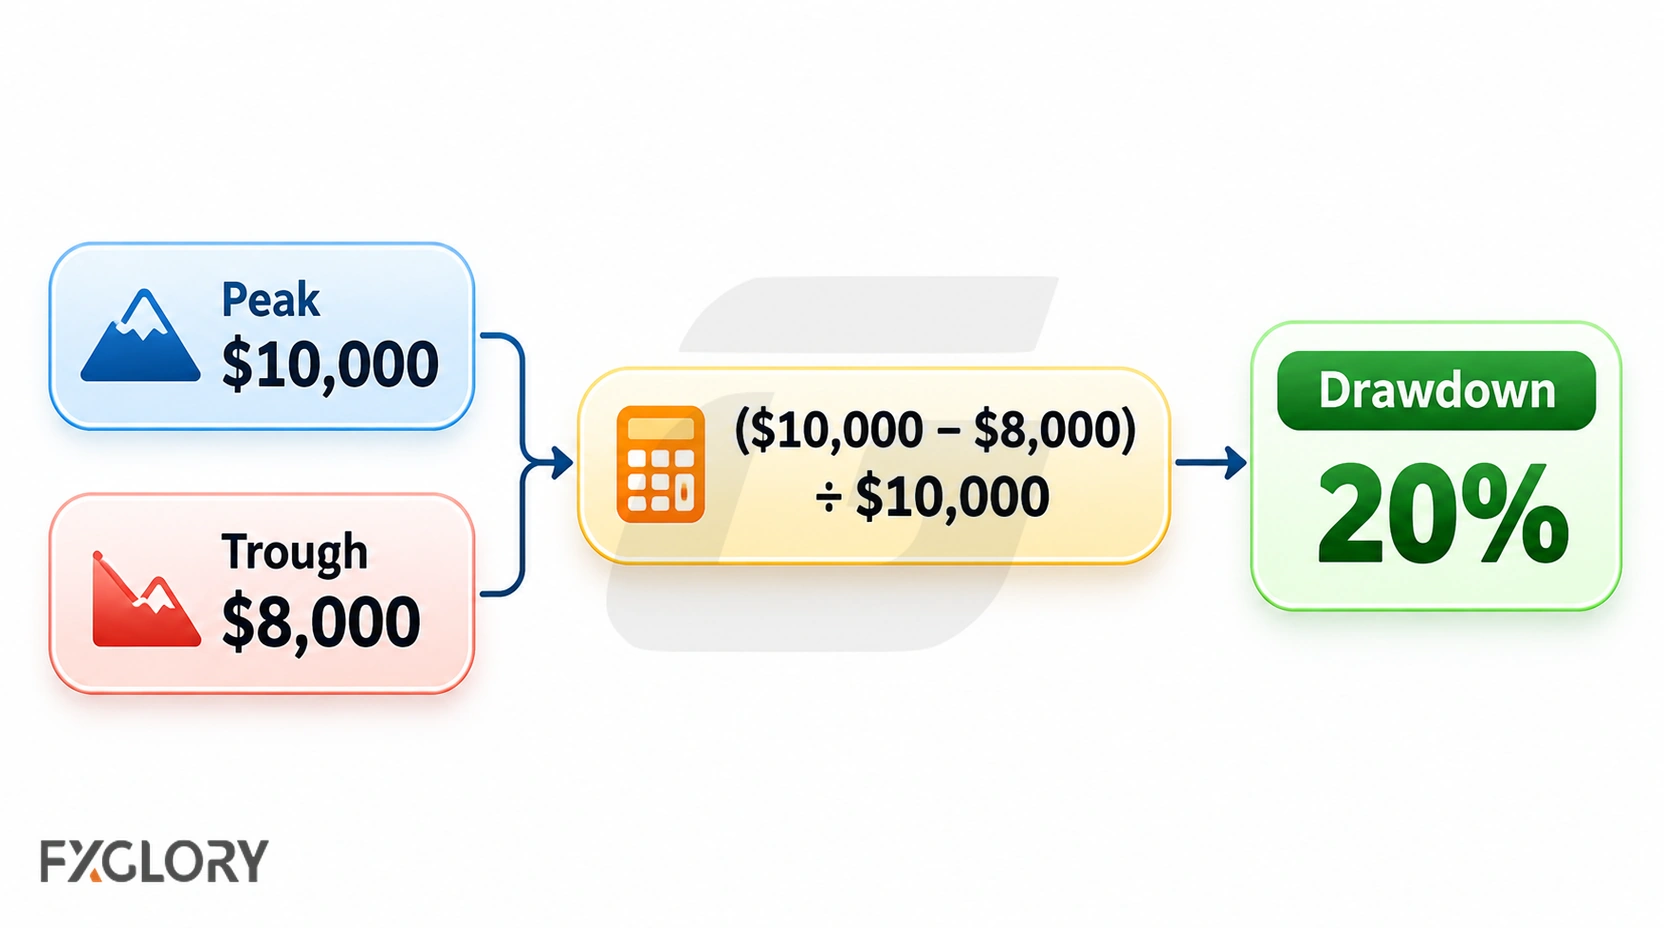
Drawdown (%) = [(Previous peak − Subsequent trough) ÷ Previous peak] × 100.
- Choose the data: account balance, account equity or a specified strategy value, measured in the same currency throughout.
- Identify a preceding peak within the observation period. The trough must come after that peak, not before it.
- Subtract the later low from the earlier peak, divide by the peak, and multiply by 100.
- State whether the number is the current decline, the largest historical decline or one completed episode.
Worked example: A hypothetical account reaches a balance peak of $10,000. After closed losses it records a balance of $8,000. The dollar decline is $10,000 − $8,000 = $2,000; the percentage drawdown is ($2,000 ÷ $10,000) × 100 = 20%. This calculation says nothing by itself about the number of trades, the strategy's expected return or how quickly the account might recover.
For the drawdown at the latest observation, substitute the latest account value for the trough and compare it with the running peak to that date. For maximum drawdown, compute declines from each running peak and report the largest within the chosen period. Cash deposits, withdrawals, transfers or currency conversion can distort an unadjusted series; performance comparisons need a consistent, cash-flow-aware method.
Current, Maximum, Balance and Equity Drawdown
These terms describe different aspects of a decline. Maximum drawdown is a statistic about how severe the worst recorded drop was; balance and equity specify what was measured.
| Measure | Meaning | Important limitation |
|---|---|---|
| Current drawdown | Decline from the relevant running peak to the latest recorded value. | Can shrink or grow as the account changes; it is not the worst historical decline. |
| Maximum drawdown | Largest observed peak-to-subsequent-trough percentage fall over a stated period. | Depends on the observation frequency and whether the series uses balance or equity. |
| Balance drawdown | Decline calculated from recorded account balance values, ordinarily reflecting realized trade results. | Can miss significant temporary floating losses on open trades. |
| Equity drawdown | Decline based on account equity, including open-position profit and loss at the sampled moments. | May change between observations; it does not guarantee a final realized loss. |
A report that says “maximum drawdown: 15%” is incomplete without context. Ask whether the figure uses balance or equity, which dates it covers and how often values were sampled. For strategy testing specifically, see FXGlory's guide to reading an MT5 backtest report; tester statistics may use their own conventions and depend on the test settings and available price data.
Why Balance and Equity Can Show Different Risk
Account balance generally changes when trades are closed or account transactions are recorded. Equity reflects the current value of the account after including floating gains or losses on open positions (subject to the platform's account calculation rules). As a result, an open trade can push equity far below the balance even when the closed-trade balance appears unchanged.
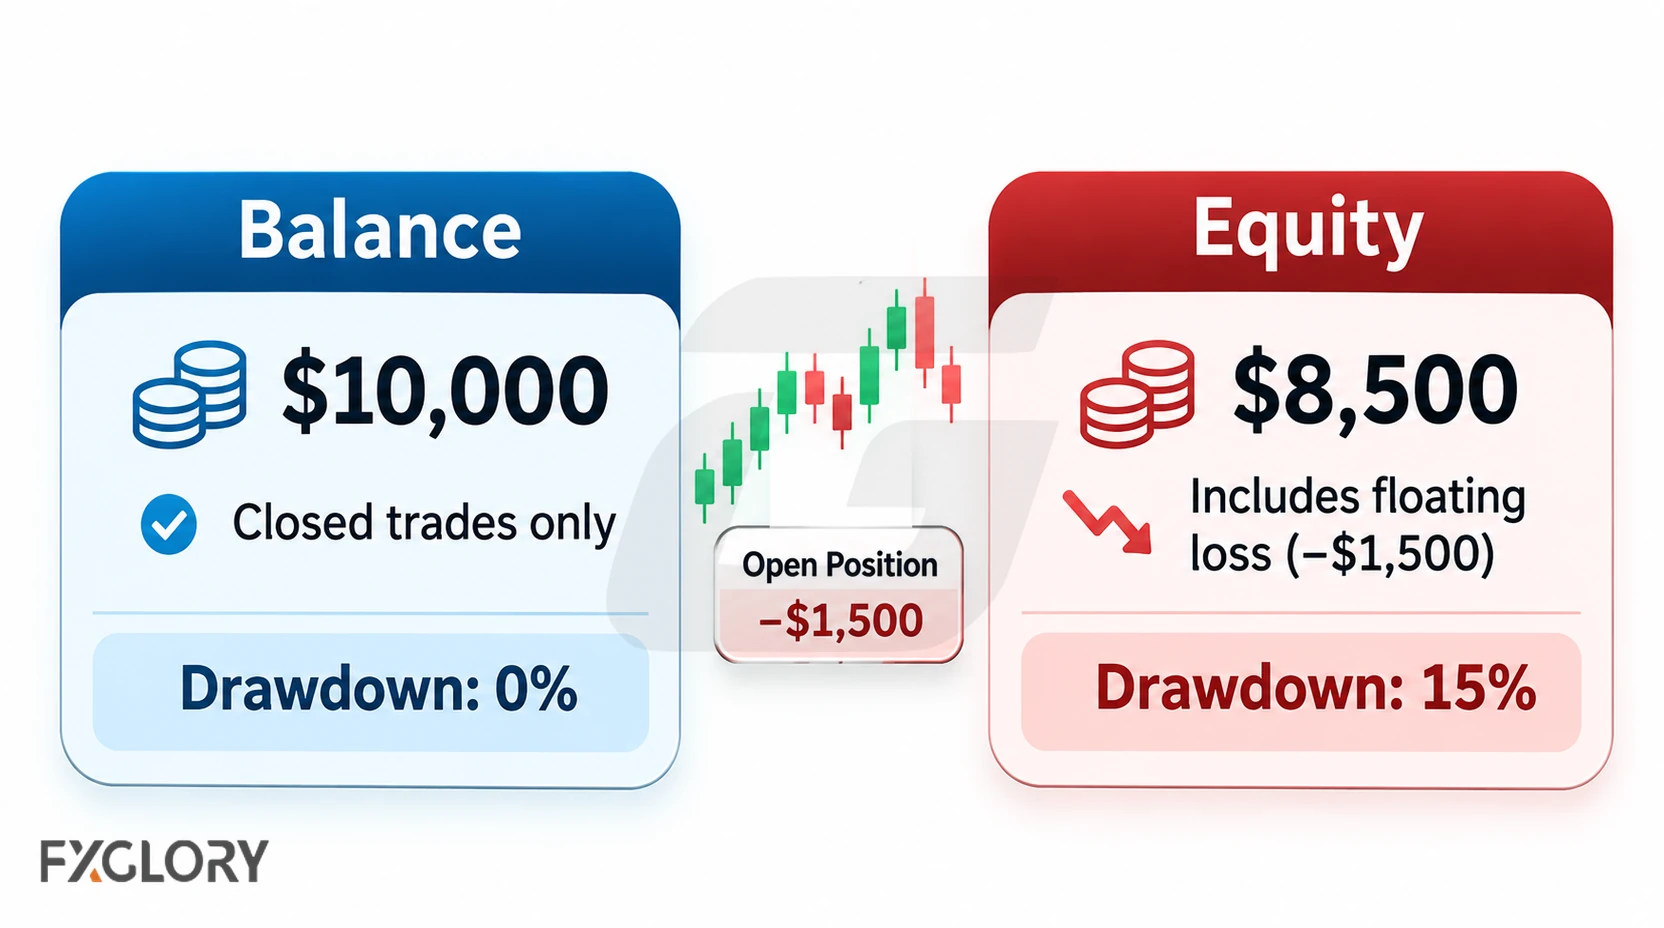
Suppose an account shows a balance of $10,000, and an open position has an unrealized loss of $1,500. In a simplified example with no other adjustments, the equity is $8,500. If both series previously peaked at $10,000 and no external cash flows occurred, the balance series may show no drawdown at that moment, while the equity series shows ($10,000 − $8,500) ÷ $10,000 = 15%. If the position later recovers, that equity decline may not become a realized loss. If it is closed at the loss, the balance can decline too.
Worked Example: Drawdown Across Several Account Values
Consider a hypothetical USD trading-account equity series sampled at five points. There are no deposits or withdrawals, and this example ignores fees and financing solely to demonstrate the metric. Each percentage below uses the highest previously observed equity, including the current observation if it sets a new high.
| Observation | Equity | Running peak | Drawdown at observation |
|---|---|---|---|
| A | $10,000 | $10,000 | 0% |
| B | $12,000 | $12,000 | 0% |
| C | $9,600 | $12,000 | 20% |
| D | $11,000 | $12,000 | 8.33% |
| E | $12,500 | $12,500 | 0% |
At C, the account has fallen $2,400 from B's $12,000 peak: $2,400 ÷ $12,000 = 20%. At D, the drop from that same peak is $1,000 ÷ $12,000 = approximately 8.33%. E reaches a new observed peak of $12,500, so the current drawdown at E is zero, but the maximum observed drawdown remains 20% for this five-point series.
Real accounts can change between recorded samples. A report based only on end-of-day figures may miss intraday equity lows, while a live account's equity can change with Bid/Ask prices, spreads and open positions. Therefore, two reports can differ without necessarily contradicting each other if their measurement methods differ.
Forex Drawdown Recovery: Why the Required Gain Is Larger
Recovering a percentage loss requires earning a gain on a smaller remaining base. To restore the same account value with no deposits, withdrawals or further charges, the percentage gain needed is:
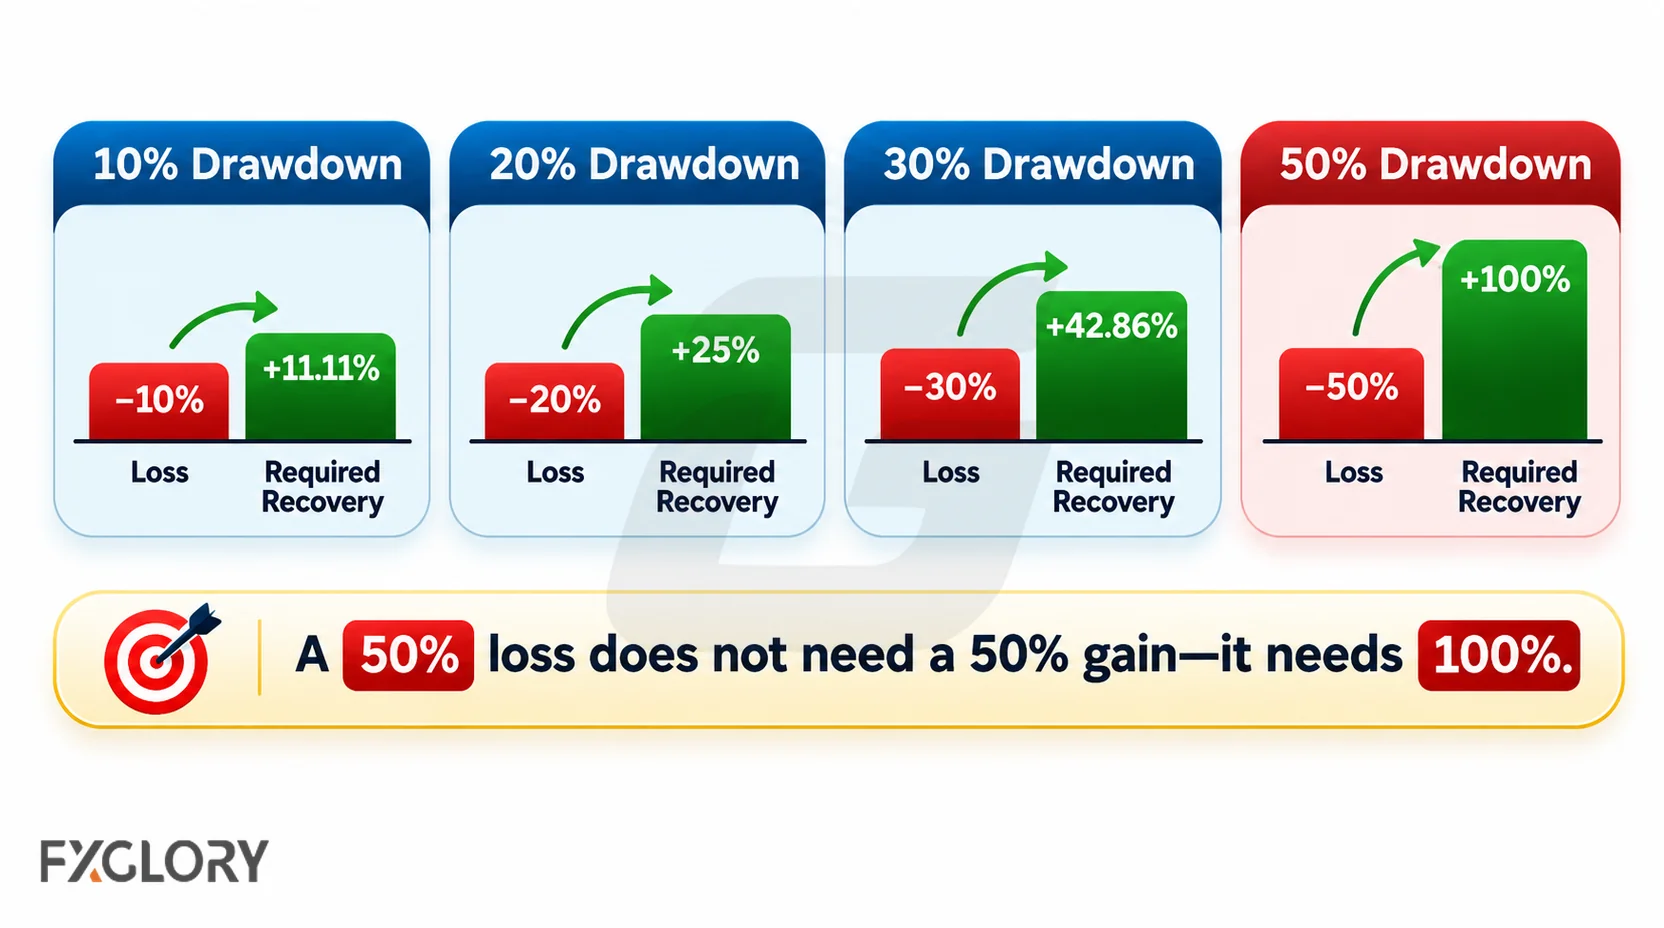
Required recovery gain (%) = [Drawdown fraction ÷ (1 − Drawdown fraction)] × 100, where the drawdown fraction is between 0 and 1. For a 20% drawdown, the fraction is 0.20; 0.20 ÷ 0.80 × 100 = 25%.
| Drawdown from peak | Remaining value from $10,000 peak | Gain needed on remaining value |
|---|---|---|
| 5% | $9,500 | 5.26% |
| 10% | $9,000 | 11.11% |
| 20% | $8,000 | 25.00% |
| 30% | $7,000 | 42.86% |
| 50% | $5,000 | 100.00% |
Return to the $10,000-to-$8,000 example. A 20% gain on the remaining $8,000 adds only $1,600, bringing the account to $9,600. A 25% gain on $8,000 adds $2,000, restoring $10,000 in pure arithmetic. After a 50% decline, the remaining $5,000 must double to return to $10,000: a 100% gain, not 50%.
How Drawdown Informs Forex Risk Management
Drawdown gives traders a record of the severity of adverse account moves. It is useful when reviewing a method, but it should be interpreted alongside trading costs, exposure, the number of trades, and the conditions that produced the decline. A historical maximum is not a guarantee that future losses will remain within that level.
- Size exposure in account-currency terms. Understand the loss that a price move could cause at the chosen position size; high leverage can amplify a small price change into a large equity swing.
- Check correlated positions. Several currency pairs exposed to the same underlying currency or market event can lose together.
- Include execution uncertainty. Stop-loss orders generally do not guarantee a specific fill; gaps, low liquidity and changing spreads can increase realized loss.
- Compare like with like. Use the same balance/equity definitions and time window when comparing strategies or trading periods.
- Review the trading plan before increasing risk. Taking larger positions solely to regain a previous peak can magnify the next drawdown.
The Forex Risk Management Strategy lesson discusses planned exposure and testing in more detail. The Martingale strategy guide explains why increasing position sizes after losses can compound risk rather than assure recovery.
Drawdown vs Loss, Margin Call and Risk of Ruin
Drawdown versus an individual trading loss
A trade loss is the unfavorable result of a particular position when measured or realized. Drawdown is a peak-relative account or strategy measure that can span many trades, and equity drawdown can include floating losses. The same dollar loss can represent very different percentages depending on the earlier account peak.
Drawdown versus margin call and stop-out
Drawdown reports a decline; a margin call concerns insufficient margin under a provider's account rules, while a stop-out is an account-level position-closing process when a defined margin condition is reached. Their thresholds, notifications and treatment depend on the applicable account terms. A 20% drawdown does not, by itself, establish whether a margin call or stop-out will occur.
Drawdown versus risk of ruin
Drawdown is a historical or current decline actually measured from an account series. Risk of ruin is an estimate of the probability of reaching a specified unacceptable loss boundary under a set of assumptions about future results. Its calculation depends on how “ruin” is defined, the trade-outcome model, payoff distribution, position sizing and other inputs. You cannot infer that probability from a single drawdown percentage; it deserves separate analysis.
What to Review After a Significant Drawdown
A drawdown is a reason to examine evidence, not proof that the next trade must be profitable. If losses have reached a pre-established limit—or trading decisions are becoming reactive—it may be appropriate to stop placing new trades while reviewing the record. There is no universal “safe” drawdown percentage for all accounts.
- Write down the balance/equity series, its previous peak, its latest trough and the observation period.
- Separate realized losses from floating equity changes, deposits/withdrawals and currency or pricing effects.
- Check whether one position, correlated exposures, leverage or an unusual market event drove the decline.
- Compare the actual decisions and fills with the plan, including stops and financing, rather than assuming every loss was a strategy failure.
- Reassess whether the loss boundary and position-sizing rules are still appropriate before making any new trade decision.
Attempts to recover losses quickly can introduce revenge trading, when emotions begin driving position size or entry selection. Keeping a dated record can help distinguish a measurement problem, an execution problem and a genuine change in strategy behavior.
Key Lesson: Measure the Decline Before Judging It
A forex drawdown measures how far a selected account or strategy value falls from a prior peak. Current drawdown describes the latest distance below that high; maximum drawdown records the largest observed decline over the period. Balance and equity drawdowns can differ because open trades change floating profit and loss.
Recovery percentages are asymmetric: a 20% fall requires a 25% gain on the remaining value to return to the former peak, before additional costs or changes. That mathematics can improve risk discussions, but it does not predict a recovery. The essential next step is to check the metric's definition, observation period and actual account exposure rather than treat a single number as a complete assessment of trading risk.